 2022, Vol. 40
Institute of Oceanology, Chinese Academy of Sciences
Article Information
- WU Ni, FU Suping, SONG Xinru, TONG Mengmeng, JIANG Tianjiu
- Stress regulation of photosynthetic system of Phaeocystis globosa and their hemolytic activity
- Journal of Oceanology and Limnology, 40(6): 2164-2177
- http://dx.doi.org/10.1007/s00343-022-1385-x
Article History
- Received Nov. 16, 2021
- accepted in principle Apr. 28, 2022
- accepted for publication Jul. 4, 2022


2 South China Sea Institute of Planning and Environmental Research, State Oceanic Administration, Guangzhou 510300, China;
3 Ocean College, Zhejiang University, Zhoushan 316021, China
The genus Phaeocystis were globally distributed and extensive blooms were reported mostly along the European and Chinese coast (Schoemann et al., 2005). Ten Phaeocystis species were identified morphologically and molecularly including P. globosa, P. antarctica, P. poucheti, P. cordata, P. brucei, P. jahnii, P. amoeboidea, P. giraudii, P. scrobiculata, and P. sphaeroides (Shen et al., 2018; Wang et al., 2021), among which, P. globosa (He et al., 1999) and P. poucheti (Hansen et al., 2004) were reported toxic. P. globosa giant colony were first reported in coastal China since 1997 (Chen et al., 1999), Viet Nam since 2002 (Qi et al., 2004; Hai et al., 2010), and the Arabian Sea (Madhupratap et al., 2000), causing massive fish death (Liu et al., 2015), mussel mortalities (Peperzak and Poelman, 2008), power plant closure (Gong et al., 2018; Liu and Zhou, 2018), and tourism closure (Nejstgaard et al., 2007; Blauw et al., 2010). The estimated economic loss of P. globosa reached ca. 35 million US dollars in South China Sea in 1997 (Qi et al., 2004), and ca. 0.65 million US dollars in Phan Ri Bay of Vietnam in 2002 (Doan et al., 2003).
The potential effects of Phaeocystis blooms include the production of hemolytic substance (He et al., 1999), dimethylsulfoniopropionate (DMSP), reactive oxygen species (ROS), and other polyunsaturated fatty acids (PUFA) (Van Leeuwe and Stefels, 2007; Sheehan and Petrou, 2020). Blooming of P. globosa can transform DMSP into dimethyl sulfide (DMS) with the production of ~0.5 Tmol/a (Mohapatra et al., 2013). Polyunsaturated aldehydes (PUAs), converted from PUFA with the presence of ROS, may lead to the blood apoptosis of sea urchin or human cytotoxicity (Pohnert, 2005). Hemolytic activity of P. globosa posed the most threat to the environment and fisheries (Yang et al., 2009; Liu et al., 2010). In addition, the giant colony of P. globosa, clogging the cooling system of power plant (Kang et al., 2020; Xu et al., 2020) or forming mucilage to make gelatinous foam (Karlson et al., 2021) were recently reported as the major ecological impact in Asian waters. Meanwhile, P. globosa blooms have influenced the viscosity change of seawater and leaded to the variation of marine ecological environment (Peperzak and Gäbler-Schwarz, 2012; Sheik et al., 2014). In terms of hemolytic toxins, the known components are mainly glycolipids, unsaturated fatty acids, fatty acid amides and porphyrins (Hiraga et al., 2008; Henrikson et al., 2010; Bertin et al., 2012). Hemolytic substance from one strain of P. globosa was similar with the structure of digitonin (He et al., 1999). Those hemolysins function similarly as the detergent solubilization, digtonin or Triton X-100, which caused acute toxicities to aquatic animals, i.e., Artemia salina, Brachionus plicatilis, and other zooplanktons (Yang et al., 2009). In additon, the synergetic effect of hemolytic toxins and ROS may show a critical role in fish killing during the blooms (Twiner and Trick, 2000; Ling and Trick, 2010).
Now the question becomes that what would be the driver(s) of the toxicity of P. globosa. Previous studies indicated that light (Moisan et al., 2006; Guo et al., 2007; Masotti et al., 2010), temperature (Selleslagh and Amara, 2008; Cao et al., 2015), and algicidal compounds (Yang et al., 2015; Zhang et al., 2017) could impact the hemolytic activity of P. globosa. The highest level of hemolytic activity was observed at 25 ℃ with the irradiance of 100 μmol/(m2·s) and the N: P ratio of 16:1 (Cao et., 2015). With the increasing salinity (19–29), temperature (15–25 ℃), and irradiance (14–38 μmol/(m2·s), the production of CH3Cl and CH3Br increased accordingly (Yan et al., 2019). Superfluous ROS of P. globosa can be triggered by the algicidal compounds, such as cyclo-(Pro-Gly), prodigiosin and combination of urocanic acid, N-acetylhistamine, and L-histidine (Zhuang et al., 2018). The production of DMSP in P. globosa was found associated with low temperature (20 ℃), high salinity (40) (Shen et al., 2011), acidic pH (pH=5) (Mohapatra et al., 2014), low ratio of N: P, and high concentrations of iron (Zhu et al., 2013).
Therefore, how would it possible that the hemolytic compounds of P. globosa be driven by the external stresses? In this case, a serious experiment was designed to investigate the response of photosynthetic system and hemolytic activity of P. globosa under the external stresses of light, temperature, iron, and algicidal compounds.
2 MATERIAL AND METHOD 2.1 Algae and culture conditionThe strain of P. globosa was isolated from the coast of Shantou, South China Sea in 1997 and obtained from Research Center of Harmful Algae and Marine Biology, Jinan University, China. All cultures were incubated in f/2-Si medium (salinity of 28 and pH 8) under a light: dark (L: D) cycle of 12 h: 12 h at 25 ℃ with an irradiance of 90 μmol/(m2·s).
Cell number was estimated using a hemacytometer every two days and growth rate was calculated by the difference in cell number during the exponential growth using the equation given by Guillard (1975).
 (1)
(1)where N2 and N1 are the cell numbers at time t2 and t1.
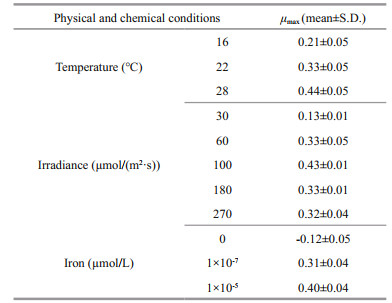
2.2 Physical environment stressThe stress experiments were carried out at three temperatures (16, 22, and 28 ℃), five light intensities (30, 60, 100, 180, and 270 μmol/(m2·s)) and three different FeCl3 concentrations (0, 10-5, and 10-7 μmol/L). Artificial seawater was used instead of natural seawater (Harrison et al., 1980) for two generations to preculture the algae in f/2-Si medium. The exponential growth phase of P. globosa was inoculated into fresh f/2-Si medium to ensure the same initial density and cultured under designed conditions as shown in Table 1. The position of bottles was changed every day to reduce the effects of uneven lighting or temperature. All treatments were conducted in triplicate. Subsamples were collected every two days to determine cell density, photosynthetic fluorescence, and hemolytic activity.
|
A stock culture of P. globosa was grown in a f/2-Si medium at 25 ℃ under 90 μmol/(m2·s) of cool-white fluorescent illumination on a 12-h: 12-h L: D cycle (light period 09:00–21:00). Subsamples were collected every four hours to determine cell density, photosynthetic fluorescence and hemolytic activity. The experiment last for 24 h.
2.4 Photosynthetic electron inhibitors stressDiuron, atrazine, dibromothymoquinone (DBMIB), and paraquat were chosen as four photosynthetic electron inhibitors. Certain amount of these inhibitors, 0.1, 0.15, 0.1, and 4.5 mg/L for diuron, atrazine, DBMIB, and paraquat, respectively, were added into 100 mL of exponential growth culture of P. globosa. Then samples were mixed and placed under 25 ℃ with an irradiance of 100 μmol/(m2·s). Photosynthetic efficiency and hemolytic activity were detected after one hour.
2.5 Data analysis 2.5.1 Photosynthetic fluorescencePhotosynthetic activity of samples was determined by measuring in-vivo chlorophyll fluorescence of photosystem II (PS II) using a Phyto-pulse amplitude modulation (PAM) (Walz, Effeltrich, Germany). Subsamples were taken and treated in darkness at 25 ℃ for 5 min each. The temperature experiment was conducted in darkness under the corresponding temperature conditions. The photosynthetic efficiency (Fv/Fm), the relative electron transfer rate (ETR), and quantum yield of photosystem II (Yield) were determined by Phyto-PAM.
2.5.2 Hemolytic activity assayThe hemolytic activity of P. globosa was evaluated by rabbit erythrocytes described in Eschbach et al. (2001) and Ling and Trick (2010). The rabbit erythrocytes were taken from the auricular veins of New Zealand rabbits and washed twice in the erythrocyte lysis assay (ELA) buffer. For the hemolytic activity, algae subsamples were placed into 10-mL tubes and centrifuged at 6 000×g for 10 min. Then the pallets were re-suspended in 400-μL ELA buffer and stored at -20 ℃. Before detecting the hemolytic activity, the samples were crushed in an ice bath by an ultrasonic crusher under the conditions of 10% power (650 W), 50 s (pulse on 2 s, pulse off 1 s) to obtain the hemolytic toxin extract. One hundred and fifty microlitre of P. globosa hemolysin extract and 150 μL of 0.6% rabbit erythrocytes were mixed in a 1.5-mL centrifuge tube (As). After centrifugation of the same volume of hemolysin buffer and rabbit erythrocytes, the absorbance of the supernatant was measured to eliminate the background value of erythrocytes (Aa). The absorbance of the supernatant was measured as the negative control (Ab) after centrifugation of the same volume of hemolysin extract and erythrocytes buffer. The positive control was the absorbance of the supernatant of completely lysed rabbit erythrocytes (Ac). All samples were well-mixed and placed under 25 ℃ with an irradiance of 100 μmol/(m2·s) for 5 h, then centrifuged at 3 000 r/min for 10 min. The supernatant was used to measure the absorbance at 414 nm in Microplate Reader (Biotek Synergy HT, USA).
The hemolytic activity was calculated according to the following formula (Ling and Trick, 2010):
 (2)
(2)where As is samples, Aa is algae background value, Ab is the background of erythrocytes (negative control), and Ac is the lysed rabbit erythrocytes (positive control).
The half effect concentration (EC50) is the concentration of algae cells that lyse half of the rabbit's red blood cells within 5 h. The EC50 was determined as the reaction algae density for subsequent experiments. The algae were gradually diluted into seven concentrations, 1.0, 2.0, 4.0, 8.0, 20.0, 40.0, and 80.0×10⁵ cells/mL. The EC50 of P. globosa was then determined as 1×10⁶ cells/mL.
2.5.3 Pigment analysisThe pigment samples were extracted every two days under light experiment as described in Buffan-Dubau and Carman (2000) and Zapata and Garrido (1991). Fifty milliliter of subsamples were filtered through Waterman GF/F glass fiber filters (0.7-μm nominal pore size, 25-mm diameter). Then the filter membranes were cut into pieces and incubated in 3 mL of 95% methanol (v: v). Then the samples were centrifuged at 4 000×g for 5 min. The supernatant was filtered into the chromatographic bottle for pigment detection. Pigment were determined using high performance liquid chromatography (HPLC)(Agilent 1200) with C8 column (4.6 mm×150 mm, 3.5 μm) and UV-detector as described in Zapata et al. (2000). The mobile phase used in this study were eluent A: Milli-Q water, eluent B: acetonitrile, eluent C: methanol-acetonitrile-acetone (volume ratio: 1:1:3), eluent D: methanol-acetonitrile-acetic acid pyridine (2:1:1). Elution time was 40 min and flow rate was 1 mL/min.
For each analysis, 30-μL standard pigment solution, 90-μL methanol, and 40-mL Milli-Q water were mixed as standard working solution. All treatments were performed under low light. Standard pigments were obtained from DHI Inc. (Denmark)
2.5.4 Statistical analysisOne-way ANOVA and correlation analysis were used to test the differences of photosynthetic fluorescence value, hemolytic activity, growth, and pigment under different conditions. All statistical analysis were conducted using SPSS 19.0 software. Origin 8.0 and Sigmaplot 12.5 were used for graphic rendering. Significant differences were determined using simple t-test (P < 0.05).
3 RESULT 3.1 Effect of temperatureLow temperature inhibited the growth of P. globosa. The maximum growth rate (μmax) of P. globosa increased with the increasing temperature, reaching 0.21, 0.33, and 0.44 (n=3) at 16, 22, and 28 ℃, respectively (Table 1). The exponential growth lasted 10 days in higher temperature, whereas 8 days in low temperature, resulting to the highest cell concentration of 1.70×10⁶ and 1.89×10⁶ cells/mL in 22 ℃ and 28 ℃ (Fig. 1a).

|
| Fig.1 Response of growth (a), photosynthetic activity (photosynthetic efficiency (Fv/Fm), quantum yield of photosystem II (Yield), and the relative electron transfer rate (ETR)) (b) and hemolytic activity (HA) (c and d) of P. globosa under temperature of 16, 22, and 28 ℃; linear relationship between hemolytic and photosynthetic activity of P. globosa (e) R2=coefficient of determination of the fitted linear regressions in (e). Letters in (c & d) indicate significant difference at P < 0.05. |
The temperature stress on photosynthetic system II (PSII) of P. globosa were also pronounced (Fig. 1b). Significant low values of Fv/Fm (circle), Yield (bar) and ETR (square) cells were observed in 16 ℃ (Fig. 1b), indicating the temperature inhibition of photosynthetic activity of P. globosa. Photosynthetic efficiency (Fv/Fm) of P. globosa kept the maximum level of 0.64±0.03 (n=18) on average during the entire growth at 28 ℃ (Fig. 1b), on the other hand, dramatically (One Way ANOVA, P < 0.05) decreased Fv/Fm from 0.63 at exponential growth to 0.47 when cell aged at 22 ℃, and from 0.57±0.01 to 0.37±0.01 at 16 ℃ (Fig. 1b). Similar trends were observed in the effective quantum yield of PSII (Yield) and relative electron transport rate (ETR). The maximum Yield and ETR of P. globosa were 0.58±0.01 and 34±0.6 at exponential growth of P. globosa at 28 ℃. The colder (16 ℃) and older (day 11) cells of P. globosa were under great stress, with Yield of 0.30 and ETR of 14.33, respectively.
The response of hemolytic activity of P. globosa was significant as the varied temperatures (Fig. 1c–d) and cell ages (Fig. 1c). The cells cultured under low temperature, had low hemolytic activity during the entire growth phase. In contrast, hemolytic activity of P. globosa significantly increased (One Way ANOVA, P < 0.05) at day 4 in 22 ℃ and 28 ℃, which varied from 23% to 51% and 63% on average, respectively (Fig. 1c). In general, hemolytic activity of P. globosa increased with increasing temperature (Fig. 1d). To evaluate the response of hemolytic activity to the photosynthetic system of P. globosa under the temperature treatments, the correlations between hemolytic activity and Fv/Fm, Yield, and ETR were analyzed in Fig. 1e. The clear positive correlations were found between hemolytic activity (HA) and Fv/Fm, Yield and ETR, with the R2 of 0.45, 0.43, and 0.44, respectively.
3.2 Effect of ironIron significantly affected the physiological and toxinological characteristics of P. globosa. Growth response of P. globosa under the exposure of iron are presented in Fig. 2a. P. globosa did not grow without iron, but with small amount of iron, i.e., 10-7 μmol/L, cells growth rapidly, reaching 0.49/d (Fig. 2a). And the maximum growth rate was found in 10-5 μmol/L of FeCl3 with 0.62/d.

|
| Fig.2 Response of growth (a), photosynthetic activity (photosynthetic efficiency (Fv/Fm), quantum yield of photosystem II (Yield), and the relative electron transfer rate (ETR)) (b) and hemolytic activity (HA) (c and d) of P. globosa under different iron condition (0, 10-7, and 10-5 μmol/L); linear relationship between hemolytic and photosynthetic activity of P. globosa (e) R2=coefficient of determination of the fitted linear regressions in (e). Letters above bars (c & d) indicate a significant difference at P < 0.05. |
As for the response of Fv/Fm, Yield, and ETR, healthier cells of P. globosa, higher values of PSII activity, were observed under iron sufficient (10-5 μmol/L) condition (Fig. 2b), however, even the growth was not limited under iron low condition (Fig. 2a), but all photosynthetic activities were declined from 0.64 to 0.38 (Fv/Fm), 0.40 to 0.25 (Yield), and 26.33 to 15.67 (ETR) at day 4. The Fv/Fm, Yield, and ETR values of P. globosa reached 0.09, 0.03, and 1.67 under most stressful condition when cell aged (Fig. 2b).
Iron also had a great impact on hemolytic toxin production of P. globosa. Lowest hemolytic activity was detected under iron free condition through all growth stage, with an average of 18% (n=15) per 1 million cells. On the other hand, hemolytic compounds were produced when iron was added. Higher hemolytic activity with around 43% was detected in iron sufficient cultural condition (Fig. 2c & d).
Linear relationship of photosynthetic and hemolytic activity was found in Fig. 2e. Similar as the temperature treatments, significant positive relationship between Fv/Fm (R2=0.45), Yield (R2=0.43) and ETR (R2=0.44) and hemolytic activity were also found.
3.3 Effect of irradianceLight intensities of 30, 60, 100, 180, and 270 μmol/(m2·s) were used in the present study. In Fig. 3a, the apparent growth was found in light treatments of over 60 μmol/(m2·s). The growth rates varied but not significant, with around 0.45/d on average. The highest growth rate, 0.68/d, was found at light of 100 μmol/(m2·s). In contrast, P.globosa grew much slower, ~0.13/d at the lowest irradiance (30 μmol/(m2·s)). Interestingly, the exponential growth last 9 days in the highest two light treatments(I180, I270), however, 11 days in the middle light treatments (I100 and I60), resulting to the significant difference of maximum cell concentrations (180 000 vs. 200 000 cells/mL).

|
| Fig.3 Response of growth (a), photosynthetic activity (photosynthetic efficiency (Fv/Fm), quantum yield of photosystem II (Yield), and the relative electron transfer rate (ETR) (b), and hemolytic activity (HA) (c and d) of P. globosa under different light treatments (30, 60, 100, 180, and 270 μmol/(m2 ∙s)); linear relationship between hemolytic and photosynthetic activity of P. globosa (e) R2=coefficient of determination of the fitted linear regressions in (e). Letters above bars (c & d) indicate a significant difference at P < 0.05. |
Photosynthetic activities of P. globosa, Fv/Fm, Yield, and ETR are shown in Fig. 3b. The two highest light treatments, I180 and I270, stressed the photosynthetic activity of P. globosa as the evidence of significant low values of Fv/Fm, Yield, and ETR (Fig. 3b). Light of 100 μmol/(m2·s) was sufficient for Fv/Fm (no declined through the entire growth), but shrunk after day 5 in both Yield and ETR. Low light, I30 and I60, did not stress the PSII of P. globosa, but no significant growth was found in I30 (Fig. 3a).
Hemolytic activities of P. globosa under variable light treatments were shown in Fig. 3c & d. Significant high amount (One Way ANOVA, P < 0.05) of hemolytic toxins were produced under the low light treatment, 30 μmol/(m2·s), with an average of 72% through the entire growth, followed by 60, 100, 180, and 270 μmol/(m2·s) (Fig. 3d). Hemolytic activities reached 32%, 24%, 20%, and 13% under the light of 60, 100, 180, and 270 μmol/(m2·s), respectively. The hemolytic activity decreased with the increasing irradiance during the whole exponential period (Fig. 3c). Linear relationship between hemolytic and photosynthetic activity showed the significant positive response of Fv/Fm (R2=0.48), Yield (R2=0.54), and ETR (R2=0.59) (Fig. 3e).
Pigment contents varied greatly with light and growth phase (Fig. 4). Pigments of chlorophyll c3 (Chl c3), chlorophyll c2 (Chl c2), 19′-But-fucoxanthin (But-fuco), fucoxanthin (Fuco), 19-Hex-fucoxanthin (Hex-fuco), diadinoxanthin (Diad), and chlorophyll a (Chl a) were detected in P. globosa. Chl c3, Chl c2, and Fuco were the dominant pigments in P. globosa. Cellular Chl c3 and Fuco of P. globosa, ranging from 78% to 31%, decreased with the increasing light intensity. Photopigments were further investigated with the relationship of hemolytic activity by principal component analysis (PCA) (Fig. 5). The scores of the first two principal components (PC1 and PC2) reached 49.9% and 24.5% for P. globosa. The hemolytic activity was apparent in highly positive PC1 space and appeared quite correlated with the pigments of Chl c2, Chl c3, and Fuco.

|
| Fig.4 Concentrations of chlorophyll a (a), 19′-But-fucoxanthin (b), diadinoxathin (c), chlorophyll c2 (d), chlorophyll c3 (e), fucoxanthin (f), 19′-Hex-fucoxanthin (g) per 108 cells of P. globosa under different light intensities on days 4, 6, and 8 (corresponding to early, middle, and late exponential growth phases of P. globosa) Letters above bars indicate significant difference at P < 0.05. |

|
| Fig.5 Results of principal component analysis (PCA) of hemolytic activity (HA) and the concentrations of photosynthetic pigments of P. globose Chl a: chlorophyll a; Chl c2: chlorophyll c2; Chl c3: chlorophyll c3; Fuco: fucoxanthin; Diad: diadinoxathin; But-fuco: 19′-Butfucoxanthin; Hex-fuco: 19′-Hex-fucoxanthin. |
Photosynthetic and hemolytic activity of P. globosa were investigated in a daily cycle (Fig. 6). The variations of Fv/Fm, Yield, and ETR of P. globosa are S-shaped. After entering the light time, the photosynthetic transfer efficiency gradually increased, and reached the highest value at 7-h light exposure, then gradually decreased. The lowest Fv/Fm were found after 3-h dark cycle. Similarly, hemolytic activity was higher during the day time, and lower during the night time. The maximum hemolytic activity of 74%±0.48% was obtained from 16:00 pm to 20:00 pm and the minimum of 64%±3.5% from 8:00 am to 16:00 pm and from 0:00 pm to 8:00 am.

|
| Fig.6 Variation of photosynthetic efficiency (Fv/Fm), quantum yield of photosystem II (Yield), the relative electron transfer rate (ETR), and hemolytic activity (HA) of P. globosa over 24 h, 12-h: 12-h light: dark cycle Grey shading represents the dark period; the light period started at 09:00 am. |
Four inhibitors of diuron, atrazine, DBMIB, and paraquat inhibited the photosynthetic activity of P. globosa, but had no effect on hemolytic activity (Fig. 7). Fv/Fm decreased from 0.58 to 0.18 (diuron), 0.43 (atrazine), 0.5 (DBMIB), and 0.55 (paraquat), respectively. Similar trends were observed in Yield and ETR of P. globosa. Diuron was the most effective inhibitors on PSII of P. globosa (Oneway ANOVA; P < 0.05).

|
| Fig.7 Effect of four photosynthesis blockers on percent hemolytic toxicity, photosynthetic efficiency (Fv/Fm), quantum yield of photosystem II (Yield), and the relative electron transfer rate (ETR) of P. globosa after one hour of exposure, relative to the control |
Phaeocystis globosa has attracted much attention and research due to the fundamental role and harmful algal bloom effects in many regions of the world (Blauw et al., 2010; Buchan et al., 2014). The temperature was one of the triggers that can affect the hemolytic activity of P. globosa in many aquatic system (Cao et al., 2015; Kang et al., 2020). Cells of P. globosa in an optimum temperature condition, i.e., 24 and 27 ℃ (Xu et al., 2017) or 27–30 ℃ (Guo et al., 2007), produce more hemolytic toxins into the water system (Guo et al., 2007). Similar results were also found in our study (Fig. 1). A higher hemolytic activity was observed in the faster growing rate of P. globosa and the healthier cells (higher values of PSII activity).
Iron is an important nutrient in marine phytoplankton (Lill, 2009), and would be a limiting factor in the metabolism of phytoplankton during algal blooms (Larson et al., 2018). Furthermore, metal oxides are photocatalysts that facilitate photocatalysis by absorbing solar photons over a broad spectral range, ultimately enhancing the absorption of visible light (Zhou et al., 2018; Wan et al., 2019). As for P. globosa, trace amount of iron, i.e., 10-7 μmol/L, can trigger the growth, as well as the active PSII and hemolytic activity (Fig. 2). Iron sufficient would contributed the growth of P. globosa (Slagter et al., 2016) and enhanced the hemolytic activity (Liu et al., 2006; Jiang et al., 2012). The stress of iron did not inhibit the growth, PSII and toxic activity in P. globosa, indicating the production of hemolytic compounds may associate with the growth and PSII activity.
Light was reported as the trigger of hemolytic compounds in many harmful algal species (Cao et al., 2015; de Q Mendes et al., 2017; Wang et al., 2019). The saturation light for one isolate of P. globosa was determined as 60 μmol/(m2·s) and the photoinhibition point was 230 μmol/(m2·s) (Xu et al., 2017). Lower light, i.e., 80 μmol/(m2·s), inhibited the growth rate of P. globosa isolated from North Sea, but had no effect on photosynthetic activity (Hoogstraten et al., 2012). Light intensities from 40 to 150 μmol/(m2·s) promoted P. globosa isolated from the East China Sea to growth faster (Liu et al., 2011). In our study, the growth rate of P. globosa did not change dramatically within the light of 60 to 270 μmol/(m2·s). However, the exponential duration under higher light intensities (I180 and I270) were inhibited to 9 days compared to 11 days under the relatively low light condition. Another evidence of P. globosa preferred low light is that the value of Fv/Fm in low light (25 μmol/(m2·s)) was 10%–20% higher than that in high-light intensity (Maat et al., 2016). As shown in Fig. 3b, light of 60– 100 μmol/(m2·s) was the most PSII active condition for P. globosa in the present study. The continuous light at daytime may inhibit the growth of P. globosa, which may due to the circadian rhythm pattern of DNA synthesis and cell division (Wang et al., 2014).
The hemolytic activity of P. globosa varied significantly under high and low light conditions (Cao et al., 2015). This finding can be seen in the light and daily cycle experiments in the present study. The significant high amount of hemolytic activity under light of 30 μmol/(m2·s) (Fig. 3c–d), and down regulated hemolytic activity at dark cycle (Fig. 6) indicated that light was essential for P. globosa to produce hemolytic toxins and a lower light promoted the production of the toxins.
Therefore, how could the hemolytic toxin production associate with the PSII activity of P. globosa? The significantly positive correlation between hemolytic and photosynthetic activity of P. globosa under temperature, light, iron, and daily cycle treatments made us to further consider whether the hemolytic compounds would be photopigments associated compounds or related with the electron transfer chain? Thereafter, pigments as well as electron inhibitors experiments were conducted.
The main pigments of P. globosa include Chl c3, magnesium-divinyl-pheo-porphyrin a5 monomethyl ester (Mg DVP), Chl c2, But-Fuco, Fuco, Hex-Fuco, Diad, Chl a, and Caroteniods (Caro) (Zapata et al., 2004). Chl c2, and c3 also are light-harvesting pigments (Bollivar, 2006), and part of the Fuco-chl a/c protein complex. In addition, Chl c3, Fuco, and Chl c2 are particularly sensitive to low light conditions. But-fuco is often described a light-harvesting role (Van Leeuwe et al., 2014). As we know, pigment composition of P. antarctica varied with light and iron conditions (Seoane et al., 2009; Van Leeuwe et al., 2014). Here the increased Fuco were confirmed at low light (Fig. 4f). Under the high light, P. globosa cells responded by reducing their content of light harvesting pigments, i.e., Chl c2, Chl c3, Fuco (Fig. 4d, e, f) and by increasing the presence of photo-protective xanthophylls diadinoxanthin (Fig. 4c). The results of PCA on hemolytic activity and pigments (Fig. 5) suggested that the production of hemolytic compounds might associate with the light-harvesting pigments.
However, the inhibitors limited the PSII activity of P. globosa, but no effect on hemolytic activity. DBMIB can block the PSII to PSI by the cytochrome b6f complex in activation of the kinase (Mao et al., 2002; Roberts et al., 2004; Trebst, 2007). Atrazine may cause the controversial response to different organisms (Brain et al., 2012). Trace amount of DBMIB resulted to significant inhibition of PSII photochemistry (Belatik et al., 2013); however, no response of hemolytic activity may indicate not the electron transfer chains in PSII, but other biosynthetic pathway of hemolytic activity may involve in P. globosa.
Stress, such as low temperature, high light, iron deplete, dark, and electron inhibitors, showed significant impact on the growth and photosynthetic activity of P. globosa, while, the external stresses do not correspond to the hemolytic activity of P. globosa. The heathier P. globose is, the higher hemolytic activity is. Stress could not be the driver of hemolytic activity of P. globosa.
5 CONCLUSIONThe current study focuses on regulation of external stressors, such as light, temperature, iron, and photosynthetic electron inhibitors, on photosynthetic system of P. globosa and their hemolytic activity. Light was essential for P. globosa to produce hemolytic toxins. However, high light intensity (i.e., > 100 μmol/(m2·s)) inhibited the hemolytic activity, together with the lower temperature (16 ℃) and iron-limited stress. Meanwhile, photosynthetic activity (Fv/Fm, Yield, and ETR) and hemolytic activity of P. globosa were positively correlated. However, the hemolytic activity of P. globosa was not affected by photosynthetic electron inhibitors, which blocked the photosynthetic activity significantly. Therefore, it could be concluded that hemolytic toxin production of P. globosa were associated with photosynthetic process but not with the electron transfer chain. The present study provides important information for understanding the formation mechanisms of hemolytic compounds of P. globosa.
6 DATA AVAILABILITY STATEMENTAll data generated and/or analyzed during this study are contained within this article.
Belatik A, Joly D, Hotchandani S, et al. 2013. Re-evaluation of the side effects of cytochrome b6f inhibitor dibromothymoquinone on photosystem II excitation and electron transfer. Photosynthesis Research, 117(1-3): 489-496.
DOI:10.1007/s11120-013-9798-1 |
Bertin M J, Zimba P V, Beauchesne K R, et al. 2012. The contribution of fatty acid amides to Prymnesium parvum Carter toxicity. Harmful Algae, 20: 117-125.
DOI:10.1016/j.hal.2012.08.004 |
Blauw A N, Los F J, Huisman J, et al. 2010. Nuisance foam events and Phaeocystis globosa blooms in Dutch coastal waters analyzed with fuzzy logic. Journal of Marine Systems, 83(3-4): 115-126.
DOI:10.1016/j.jmarsys.2010.05.003 |
Bollivar D W. 2006. Recent advances in chlorophyll biosynthesis. Photosynthesis Research, 89(3): 1-22.
DOI:10.1007/s11120-006-9076-6 |
Brain R A, Arnie J R, Porch J R, et al. 2012. Recovery of photosynthesis and growth rate in green, blue-green, and diatom algae after exposure to atrazine. Environmental Toxicology and Chemistry, 31(11): 2572-2581.
DOI:10.1002/etc.1988 |
Buchan A, LeCleir G R, Gulvik C A, et al. 2014. Master recyclers: features and functions of bacteria associated with phytoplankton blooms. Nature reviews Microbiology, 12(10): 686-698.
DOI:10.1038/nrmicro3326 |
Buffan-Dubau E, Carman K R. 2000. Extraction of benthic microalgal pigments for HPLC analyses. Marine Ecology Progress Series, 204: 293-297.
DOI:10.3354/meps204293 |
Cao J R, Huan Q L, Wu N, et al. 2015. Effects of temperature, light intensity and nutrient condition on the growth and hemolytic activity of six species of typical ichthyotoxic algae. Marine Environmental Science, 34(3): 321-329.
(in Chinese with English abstract) DOI:10.13634/j.cnki.mes.2015.03.001 |
Chen J F, Xu N, Jiang T J, et al. 1999. A report of Phaeocystis globosa bloom in coastal water of Southeast China. Journal-Jinan University Natural Science and Medicine Edition, 20(3): 124-129.
(in Chinese with English abstract) |
de Q Mendes M C, Nunes J M C, Menezes M, et al. 2017. Toxin production, growth kinetics and molecular characterization of Ostreopsis cf. ovata isolated from Todos os Santos Bay, tropical southwestern Atlantic. Toxicon, 138: 18-30.
DOI:10.1016/j.toxicon.2017.08.007 |
Doan H N, Nguyen N L, Nguyen C, et al. 2003. Plankton assemblages during the late bloom of Haptophyte algae in Binh Thuan province, Southern central Vietnam, in July 2002. Collection of Marine Research Works, 13: 105-118.
|
Eschbach E, Scharsack J P, John U, et al. 2001. Improved erythrocyte lysis assay in microtitre plates for sensitive detection and efficient measurement of haemolytic compounds from ichthyotoxic algae. Journal of Applied Toxicology, 21(6): 513-519.
DOI:10.1002/jat.797 |
Gong B, Wu H P, Ma J X, et al. 2018. The algae community in taxon Haptophyceae at the early bloom stage of Phaeocystis globosa in Northern Beibu Gulf in winter. BioRxiv.
DOI:10.1101/492454 |
Guillard R R L. 1975. Culture of phytoplankton for feeding marine invertebrates. In: Smith M L, Chanley M H eds. Culture of Marine Invertebrate Animals. Plenum Press, New York. p. 29-60, https://doi.org/10.1007/978-1-4615-8714-9_3.
|
Guo J, Yang W D, Liu J S, et al. 2007. Effects of salinity, temperature and light intensity on the growth and toxin production of Phaeocystis globosa. Acta Scientiae Circumstantiae, 27(8): 1341-1346.
(in Chinese with English abstract) DOI:10.3321/j.issn:0253-2468.2007.08.020 |
Hai D N, Lam N N, Dippner J W. 2010. Development of Phaeocystis globosa blooms in the upwelling waters of the south central coast of Viet Nam. Journal of Marine Systems, 83(3-4): 253-261.
DOI:10.1016/j.jmarsys.2010.04.015 |
Hansen E, Ernstsen A, Eilertsen H C. 2004. Isolation and characterisation of a cytotoxic polyunsaturated aldehyde from the marine phytoplankter Phaeocystis pouchetii (Hariot) Lagerheim. Toxicology, 199(2-3): 207-217.
DOI:10.1016/j.tox.2004.02.026 |
Harrison P J, Waters R E, Taylor F J R. 1980. A broad spectrum artificial sea water medium for coastal and open ocean phytoplankton. Journal of Phycology, 16(1): 28-35.
DOI:10.1111/j.0022-3646.1980.00028.x |
He J W, Shi Z X, Zhang Y H, et al. 1999. Morphological characteristics and toxins of Phaeocystis CF. Pouchetii (Prymnesiophyceae). Oceanologia et Limnologia Sinica, 30(2): 172-179.
(in Chinese with English abstract) |
Henrikson J C, Gharfeh M S, Easton A C, et al. 2010. Reassessing the ichthyotoxin profile of cultured Prymnesium parvum (golden algae) and comparing it to samples collected from recent freshwater bloom and fish kill events in North America. Toxicon, 55(7): 1396-1404.
DOI:10.1016/j.toxicon.2010.02.017 |
Hiraga Y, Shikano T, Widianti T, et al. 2008. Three new glycolipids with cytolytic activity from cultured marine dinoflagellate Heterocapsa circularisquama. Natural Product Research, 22(8): 649-657.
DOI:10.1080/14786410701369417 |
Hoogstraten A, Peters M, Timmermans K R, et al. 2012. Combined effects of inorganic carbon and light on Phaeocystis globosa Scherffel (Prymnesiophyceae). Biogeosciences, 9(5): 1885-1896.
DOI:10.5194/bg-9-1885-2012 |
Jiang T, Teng D Q, Jiang T J, et al. 2012. Advances in hemolytic toxins of marine microalgae. Journal of Tropical and Subtropical Botany, 20(3): 311-318.
(in Chinese with English abstract) DOI:10.3969/j.issn.1005-3395.2012.03.016 |
Kang Z J, Yang B, Lai J X, et al. 2020. Phaeocystis globosa bloom monitoring: based on P. globosa induced seawater viscosity modification adjacent to a nuclear power plant in Qinzhou Bay, China. Journal of Ocean University of China, 19(5): 1207-1220.
DOI:10.1007/s11802-020-4481-6 |
Karlson B, Andersen P, Arneborg L, et al. 2021. Harmful algal blooms and their effects in coastal seas of Northern Europe. Harmful Algae, 102: 101989.
DOI:10.1016/j.hal.2021.101989 |
Larson C A, Mirza B, Rodrigues J L M, et al. 2018. Iron limitation effects on nitrogen-fixing organisms with possible implications for cyanobacterial blooms. FEMS Microbiology Ecology, 94(5): fiy046.
DOI:10.1093/femsec/fiy046 |
Lill R. 2009. Function and biogenesis of iron-sulphur proteins. Nature, 460(7257): 831-838.
DOI:10.1038/nature08301 |
Ling C, Trick C G. 2010. Expression and standardized measurement of hemolytic activity in Heterosigma akashiwo. Harmful Algae, 9(5): 522-529.
DOI:10.1016/j.hal.2010.04.004 |
Liu D, Zhou M. 2018. Green tides of the Yellow Sea: massive free-floating blooms of Ulva prolifera. In: Glibert P, Berdalet E, Burford M et al eds. Global Ecology and Oceanography of Harmful Algal Blooms. Springer, Cham. p. 317-326, https://doi.org/10.1007/978-3-319-70069-4_16.
|
Liu H X, Huang H H, Xu S N, et al. 2015. Planktonic community structure during a harmful bloom of Phaeocystis globosa in a subtropical bay, with special reference to the ciliate assemblages. Ecotoxicology, 24(7-8): 1419-1429.
DOI:10.1007/s10646-015-1464-2 |
Liu J S, Peng X C, Yang W D. 2006. Growth and hemolytic activities of Phaeocystis globosa Scherffel at different mutrients condition. Acta Ecologica Sinica, 26(3): 780-785.
(in Chinese with English abstract) DOI:10.3321/j.issn:1000-0933.2006.03.020 |
Liu J S, van Rijssel M, Yang W D, et al. 2010. Negative effects of Phaeocystis globosa on microalgae. Chinese Journal of Oceanology and Limnology, 28(4): 911-916.
DOI:10.1007/s00343-010-9061-y |
Liu S X, Yu Z G, Yao P, et al. 2011. Effects of irradiance on pigment signatures of harmful algae during growth process. Acta Oceanologica Sinica, 30(6): 46-57.
DOI:10.1007/s13131-011-0160-1 |
Maat D S, de Blok R, Brussaard C P D. 2016. Combined phosphorus limitation and light stress prevent viral proliferation in the phytoplankton species Phaeocystis globosa, but not in Micromonas pusilla. Frontiers in Marine Science, 3: 160.
DOI:10.3389/fmars.2016.00160 |
Madhupratap M, Sawant S, Gauns M. 2000. A first report on a bloom of the marine prymnesiophycean, Phaeocystis globosa from the Arabian Sea. Oceanologica Acta, 23(1): 83-90.
DOI:10.1016/S0399-1784(00)00109-2 |
Mao H B, Li G F, Ruan X, et al. 2002. The redox state of plastoquinone pool regulates state transitions via cytochrome b6f complex in Synechocystis sp. PCC 6803. FEBS Letters, 519(1-3): 82-86.
DOI:10.1016/S0014-5793(02)02715-1 |
Masotti I, Belviso S, Alvain S, et al. 2010. Spatial and temporal variability of the dimethylsulfide to chlorophyll ratio in the surface ocean: an assessment based on phytoplankton group dominance determined from space. Biogeosciences, 7(10): 3215-3237.
DOI:10.5194/bg-7-3215-2010 |
Mohapatra B R, Rellinger A N, Kieber D J, et al. 2013. Comparative functional characteristics of DMSP lyases extracted from polar and temperate Phaeocystis species. Aquatic Biology, 18(2): 185-195.
DOI:10.3354/ab00504 |
Mohapatra B R, Rellinger A N, Kieber D J, et al. 2014. Kinetics of DMSP lyases in whole cell extracts of four Phaeocystis species: response to temperature and DMSP analogs. Journal of Sea Research, 86: 110-115.
DOI:10.1016/j.seares.2013.11.012 |
Moisan T A, Ellisman M H, Buitenhuys C W, et al. 2006. Differences in chloroplast ultrastructure of Phaeocystis antarctica in low and high light. Marine Biology, 149(6): 1281-1290.
DOI:10.1007/s00227-006-0321-5 |
Nejstgaard J C, Tang K W, Steinke M, et al. 2007. Zooplankton grazing on Phaeocystis: a quantitative review and future challenges. Biogeochemistry, 83(1-3): 147-172.
DOI:10.1007/s10533-007-9098-y |
Peperzak L, Gäbler-Schwarz S. 2012. Current knowledge of the life cycles of Phaeocystis globosa and Phaeocystis antarctica (Prymnesiophyceae). Journal of Phycology, 48(3): 514-517.
DOI:10.1111/j.1529-8817.2012.01136.x |
Peperzak L, Poelman M. 2008. Mass mussel mortality in The Netherlands after a bloom of Phaeocystis globosa (Prymnesiophyceae). Journal of Sea Research, 60(3): 220-222.
DOI:10.1016/j.seares.2008.06.001 |
Pohnert G. 2005. Diatom/copepod interactions in plankton: the indirect chemical defense of unicellular algae. ChemBioChem, 6(6): 946-959.
DOI:10.1002/cbic.200400348 |
Qi Y Z, Chen J F, Wang Z H, et al. 2004. Some observations on harmful algal bloom (HAB) events along the coast of Guangdong, Southern China in 1998. Hydrobiologia, 512(1): 209-214.
DOI:10.1023/B:HYDR.0000020329.06666.8c |
Roberts A G, Bowman M K, Kramer D M. 2004. The inhibitor DBMIB provides insight into the functional architecture of the Q0 site in the cytochrome b6f complex. Biochemistry, 43(24): 7707-7716.
DOI:10.1021/bi049521f |
Schoemann V, Becquevort S, Stefels J, et al. 2005. Phaeocystis blooms in the global ocean and their controlling mechanisms: a review. Journal of Sea Research, 53(1-2): 43-66.
DOI:10.1016/j.seares.2004.01.008 |
Selleslagh J, Amara R. 2008. Inter-season and interannual variations in fish and macrocrustacean community structure on a eastern English Channel Sandy beach: influence of environmental factors. Estuarine, Coastal and Shelf Science, 77(4): 721-730.
DOI:10.1016/j.ecss.2007.11.004 |
Seoane S, Zapata M, Orive E. 2009. Growth rates and pigment patterns of haptophytes isolated from estuarine waters. Journal of Sea Research, 62(4): 286-294.
DOI:10.1016/j.seares.2009.07.008 |
Sheehan C E, Petrou K. 2020. Dimethylated sulfur production in batch cultures of Southern Ocean phytoplankton. Biogeochemistry, 147(1): 53-69.
DOI:10.1007/s10533-019-00628-8 |
Sheik A R, Brussaard C P D, Lavik G, et al. 2014. Responses of the coastal bacterial community to viral infection of the algae Phaeocystis globosa. ISME Journal, 8(1): 212-225.
DOI:10.1038/ismej.2013.135 |
Shen P P, Qi Y Z, Ou L J. 2018. Phaeocystis globosa in coastal China: taxonomy, distribution, and its blooms. Marine Sciences, 42(10): 146-162.
(in Chinese with English abstract) DOI:10.11759/hykx20171225004 |
Shen P P, Qi Y Z, Wang Y, et al. 2011. Phaeocystis globosa Scherffel, a harmful microalga, and its production of dimethylsulfoniopropionate. Chinese Journal of Oceanology and Limnology, 29(4): 869-873.
DOI:10.1007/s00343-011-0515-7 |
Slagter H A, Gerringa L J A, Brussaard C P D. 2016. Phytoplankton virus production negatively affected by iron limitation. Frontiers in Marine Science, 3: 156.
DOI:10.3389/fmars.2016.00156 |
Trebst A. 2007. Inhibitors in the functional dissection of the photosynthetic electron transport system. Photosynthesis Research, 92(2): 217-224.
DOI:10.1007/s11120-007-9213-x |
Twiner M J, Trick C G. 2000. Possible physiological mechanisms for production of hydrogen peroxide by the ichthyotoxic flagellate Heterosigma akashiwo. Journal of Plankton Research, 22(10): 1961-1975.
DOI:10.1093/plankt/22.10.1961 |
Van Leeuwe M A, Stefels J. 2007. Photosynthetic responses in Phaeocystis antarctica towards varying light and iron conditions. Biogeochemistry, 83(1-3): 61-70.
DOI:10.1007/s10533-007-9083-5 |
Van Leeuwe M A, Visser R J W, Stefels J. 2014. The pigment composition of Phaeocystis antarctica (Haptophyceae) under various conditions of light, temperature, salinity, and iron. Journal of Phycology, 50(6): 1070-1080.
DOI:10.1111/jpy.12238 |
Wan L L, Zhou Q X, Wang X, et al. 2019. Cu2O nanocubes with mixed oxidation-state facets for (photo) catalytic hydrogenation of carbon dioxide. Nature Catalysis, 2(10): 889-898.
DOI:10.1038/s41929-019-0338-z |
Wang X D, Song H Y, Wang Y, et al. 2021. Research on the biology and ecology of the harmful algal bloom species Phaeocystis globosa in China: progresses in the last 20 years. Harmful Algae, 107: 102057.
DOI:10.1016/j.hal.2021.102057 |
Wang X D, Wang Y, Ou L J. 2014. The roles of light-dark cycles in the growth of Phaeocystis globosa from the South China Sea: the cost of colony enlargement. Journal of Sea Research, 85: 518-523.
DOI:10.1016/j.seares.2013.08.009 |
Wang X J, Feng X Q, Zhuang Y, et al. 2019. Effects of ocean acidification and solar ultraviolet radiation on physiology and toxicity of dinoflagellate Karenia mikimotoi. Harmful Algae, 81: 1-9.
DOI:10.1016/j.hal.2018.11.013 |
Xu N, Huang B Z, Hu Z X, et al. 2017. Effects of temperature, salinity, and irradiance on the growth of harmful algal bloom species Phaeocystis globosa Scherffel (Prymnesiophyceae) isolated from the South China Sea. Chinese Journal of Oceanology and Limnology, 35(3): 557-565.
DOI:10.1007/s00343-017-5352-x |
Xu Y X, He X L, Zhang T, et al. 2020. Causative species of Phaeocystis blooms in Beibu Gulf. Journal of Tropical Oceanography, 30(6): 122-130.
(in Chinese with English abstract) DOI:10.11978/2020030 |
Yan G J, Ding Q Y, Gao X C. 2019. The effect of temperature, salinity and light intensity on growth and methyl halides production of Phaeocystis globose. Periodical of ocean university of China, 49(2): 67-73.
(in Chinese with English abstract) DOI:10.16441/j.cnki.hdxb.20180057 |
Yang Q X, Chen L N, Hu X L, et al. 2015. Toxic effect of a marine bacterium on aquatic organisms and its algicidal substances against Phaeocystis globosa. PLoS One, 10(2): e0114933.
DOI:10.1371/journal.pone.0114933 |
Yang W D, Shang W, Liu J S. 2009. Acute toxicities of Phaeocystis globosa on five aquatic animals. Journal of Tropical and Subtropical Botany, 17(1): 68-73.
(in Chinese with English abstract) DOI:10.3969/j.issn.1005-3395.2009.01.012 |
Zapata M, Garrido J L. 1991. Influence of injection conditions in reversed-phase high-performance liquid chromatography of chlorophylls and carotenoids. Chromatographia, 31(11-12): 589-594.
DOI:10.1007/BF02279480 |
Zapata M, Jeffrey S W, Wright S W, et al. 2004. Photosynthetic pigments in 37 species (65 strains) of Haptophyta: implications for oceanography and chemotaxonomy. Marine Ecology Progress Series, 270: 83-102.
DOI:10.3354/meps270083 |
Zapata M, Rodríguez F, Garrido J L. 2000. Separation of chlorophylls and carotenoids from marine phytoplankton: a new HPLC method using a reversed phase C8 column and pyridine-containing mobile phases. Marine Ecology Progress Series, 195: 29-45.
DOI:10.3354/meps195029 |
Zhang H J, Wang H, Zheng W, et al. 2017. Toxic effects of prodigiosin secreted by Hahella sp. KA22 on harmful alga Phaeocystis globosa. Frontiers in Microbiology, 8: 999.
DOI:10.3389/fmicb.2017.00999 |
Zhou Q X, Ma S L, Zhan S H. 2018. Superior photocatalytic disinfection effect of Ag-3D ordered mesoporous CeO2 under visible light. Applied Catalysis B: Environmental, 224: 27-37.
DOI:10.1016/j.apcatb.2017.10.032 |
Zhu R, Yang G P, Yu Y, et al. 2013. Effects of different N/P ratios and concentration of iron on DMS and DMSP production in the culture of Phaeocystis globosa. Periodical of Ocean University of China, 43(10): 67-75.
(in Chinese with English abstract) DOI:10.16441/j.cnki.hdxb.2013.10.010 |
Zhuang L E, Zhao L, Yin P H. 2018. Combined algicidal effect of urocanic acid, N-acetylhistamine and L-histidine to harmful alga Phaeocystis globosa. RSC Advances, 8(23): 12760-12766.
DOI:10.1039/c8ra00749g |