 2022, Vol. 40
Institute of Oceanology, Chinese Academy of Sciences
Article Information
- LI Zhenxiang, LU Xinxin, FAN Yawen
- Seasonal shifts in assembly dynamics of phytoplankton communities in a humans-affected river in NE China
- Journal of Oceanology and Limnology, 40(5): 1985-2000
- http://dx.doi.org/10.1007/s00343-021-1272-x
Article History
- Received Aug. 25, 2021
- accepted in principle Sep. 30, 2021
- accepted for publication Dec. 4, 2021


2 Key Laboratory of Biodiversity of Aquatic Organisms, Harbin Normal University, Harbin 150025, China
The spatial and temporal distribution pattern of phytoplankton is a comprehensive indicator of ecological health (Cao et al., 2018). Community succession pattern is an effective tool for the control and management of the health of river ecosystems and an essential indicator of the restoration and reconstruction of degraded ecosystems (Huang et al., 2012). Phytoplankton is essential for primary productivity in river ecosystems, and their diversity and community structures can usually be used to determine the responses to the changes in nutrient levels in environment (Litchman et al., 2010). For example, local environmental conditions, temperature, light, grazing pressure, and nutrient supply strongly regulate phytoplankton reproduction and primary production through bottom-up and top-down controls (Kerimoglu et al., 2013). Phytoplankton occupies a unique niche in the ecosystem and plays an essential role in the biogeochemical cycle (Aufdenkampe et al., 2011; Ye et al., 2013). The phytoplankton community distribution pattern is widely used for the assessment of water quality in aquatic ecosystems (Zhao et al., 2020). Sommer et al. (2012) used the well-known Plankton Ecology Group (PEG) model to describe the seasonal changes in the richness and density of phytoplankton in a temperate mesotrophic lake. Since then, this model has been applied in many comparative studies of different types of lakes and rivers (Varol, 2019). However, there are few studies on the species composition and community structure changes of phytoplankton in rivers influenced by anthropogenic activities in NE China.
Eutrophication is an abnormal change in structure and function of an aquatic ecosystem and the apparent deterioration of water environment when a lake contains excessive nutrients, especially nitrogen and phosphorus (Wu et al., 2019). Globally, eutrophication is the most pervasive water quality challenge as seem in severe algae blooms (Foden et al., 2011). Recently, more studies focused on using phytoplankton as a tool for the assessment of eutrophication (Foden et al., 2011). Compared with the physical and chemical indices, phytoplankton is widely distributed and abundant, and responds quickly to environmental changes in the ecosystem; and the phytoplankton community structure is an excellent biological indicator to trophic state (Abell et al., 2010). Phytoplankton community structures provide unique information on the condition of aquatic ecosystem, and their succession traits can be used to indicate changes in water quality (Holopainen et al., 2008). Moreover, the appearance of some indicator species can effectively reflect the state of water quality in the area (Stenger-Kovács et al., 2007). Accordingly, phytoplankton was used to assess water quality in the Water Framework Directive (WFD, 2000/60/ EC). Rivers are lotic ecosystems, and can not only irrigate the land, but also undertake transportation roles. Anthropogenic activities along rivers lead to hydrological alterations and further the changes in local phytoplankton communities. Discharge of many pollutants decrease diversity and stability of phytoplankton community structure, thus affecting the biological integrity of the ecological service functions of river ecosystem (Sabater-Liesa et al., 2018). Understanding ecological changes in the regularity of rivers under human pressure requires countermeasure for sustainable watershed management. However, such studies in the ASRB were few.
With fast industrialization and urbanization, rivers in Heilongjiang Province have been polluted to varying degrees in recent years. China's Eco-Environmental Status Report (2018) shows that water of the Songhua River Basin was slightly polluted. The Ashi River is a primary tributary to the Songhua River. The Xiquanyan Reservoir located in the upper reaches of the river is a backup water source for Harbin City, the capital of Heilongjiang Province in NE China. Recently, water pollution in the ASRB has gradually attracted more and more attention. The water quality of ASRB had been documented in several studies (Guo et al., 2005; Ma et al., 2015). However, systematic studies on phytoplankton community succession and the use of phytoplankton communities as indicators of water quality are scarce. This study examines the seasonal succession pattern of the phytoplankton community and the environmental factors driving the seasonal succession of the phytoplankton community. We hypothesized that: (1) the PEG model is a relevant approach for studying the traits of the phytoplankton community succession in ASRB; (2) indicator species can respond to water pollution in the ASRB. This study was to develop the succession matrices of phytoplankton community, to explore the effect of environmental factors on phytoplankton community assembly, and to determine relevant phytoplankton indicators to water quality.
2 MATERIAL AND METHOD 2.1 Study area and sampling sitesThe Ashi River is located in the south of the Songhua River Basin, some 80 km from Harbin. The study areas are located between longitude 126°43′E–127°36′E and latitude 45°08′N–45°50′N, in total length of 213 km (Fig. 1), along which the Xiquanyan Reservoir is connected in the upper part of the main section of the ASRB. The area features a temperate continental monsoon, with below-freezing temperatures from November to April in ASRB, and the annual average temperature is 3.6 ℃. Sixteen sites along the river were selected for sampling. S13–S16 were located upstream of the river mostly forest covered; S15–S16 were in the water inlet of the reservoir, and S14 was in the outlet of the Xiquanyan Reservoir (Fig. 1; Supplementary Table S1). Sites S1– S9 were influenced by domestic sewage discharge and industrial pollution, while sites S10 to S12 were affected by agricultural activity. Many small- and medium-sized enterprises were located in this area, thus industrial wastewater was the main source of pollution. Samples were collected every three months from April 2018 to January 2019, representing the water conditions in spring, summer, autumn, and winter. However, due to meteorological reasons in the winter, samples were not collected at some sites.

|
| Fig.1 Map of ASRB indicating sample sites Map review No. HeiS(2018)030 (accessed from Heilongjiang (Province) Bureau of Surveying and Mapping Geographic Information). |
Surface water samples (0–0.5 m) were collected from each sample site using brown glass bottles in triplicate for analysis. Phytoplankton samples (1 L) were immediately fixed with 1.5% acidic Lugol's solution and stored in the dark at 20 ℃ until further processing. In this study, a multi-parameter water quality analyzer (Hydrolab DS5, Hach Company, Loveland, CO, USA) was used to record physical and chemical properties in all sample sites, such as water temperature (WT), dissolved oxygen (DO), electrical conductivity (Cond.), pH, and oxidation-reduction potential (ORP). The chemical indicators of the water environment, including total phosphorus (TP) (MEP, 1989a), total nitrogen (TN) (MEP, 2012), potassium permanganate index (CODMn) (MEP, 1989b), and biochemical oxygen demand after 5 days (BOD5) (MEP, 2009), were measured following the corresponding standard methods.
2.3 Plankton analysisBefore counting species, the final volume was concentrated from 1 L to 30 mL by siphoning and thorough shaking, after which a 100-μL plankton counting box chamber was used for counting. Phytoplankton identification was conducted at 400× magnification using a light microscope (Optec B302, Chongqing, China) (Yuan et al., 2018).
2.4 Calculation of diversity indicesThe dominant species of phytoplankton were determined based on the dominance value, Y, for each species (Guo et al., 2005; Ma et al., 2015) as follows:

where ni and N are the numbers of individuals of species i and the total number of individuals of all species within site, fi is the occurrence frequency of the species i.
Shannon-Wiener index (Shannon et al., 1949), Margalef richness index (Margalef, 1967), the Pielou evenness index (Pielou, 1966), and the Simpson diversity index (Simpson, 1949) were also calculated.
2.5 Data analysisStatistical analyses were performed to quantitatively determine the impacts of environmental factors on the phytoplankton. All data were logarithmically transformed to obtain factors of equal weight. A detrended correspondence analysis (DCA) was first performed to test the character of variability in the phytoplankton assemblage. The length of the first DCA gradient was 2.0 standard deviations for our dataset, indicating that the species responded linearly to the environmental factors. It justified the further use of the redundancy analysis (RDA). DCA and RDA were performed using CANOCO software, Canonical Community Ordination version 4.5 for Windows. The significance analysis was performed using SPSS 20.0 for Windows (SPSS Inc., Chicago, Illinois). Independent-samples t-test was conducted to evaluate the differences in the environmental data and species abundance. Statistical significance was set at * P < 0.05, ** P < 0.01.
The impacts of environmental variables on microbial diversity were conducted by multivariate regression tree (MRT) analysis. A 1 000 cross-validation process was used to decrease the structural complexity of MRT and predict the critical relationship between multispecies data and environmental variables; it was carried out with the packages 'mvpart' and 'MVPARTwrap' within the 'R' program.
A comprehensive trophic state index (TSI) was used to describe the trophic status in ASRB (Wang et al., 2002). The equations for TSI were as follows:
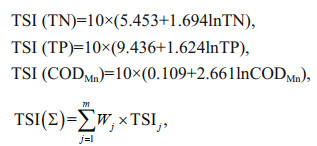
where TSI(∑) is trophic state index, m is evaluate the number of parameters, Wj is correlation weights of the nutrient state index for the jth parameter, TSIj is nutritional state index for the jth parameter.
Evaluation standard: 0 < TSI < 30 oligotrophic, 30≤TSI≤50 mesotrophic, TSI > 50 eutrophic, 50 < TSI≤60 light eutrophic, 60 < TSI≤70 middle eutrophic, TSI > 70 high eutrophic. The interpolation map was constructed by ArcGIS software using the inverse distance weighting method.
3 RESULT 3.1 Physical and chemical properties and the trophic status of ASRBMost of the physical and chemical factors had significant difference in different seasons (Fig. 2; Supplementary Table S2). Generally, in spring, the values of pH and TN were higher than those in other seasons, while the values of DO and BOD5 were lower than those in other seasons. There was no significant difference in pH, ORP, Cond., and TP between summer and autumn, but TN, CODMn, and BOD 5 were significantly higher in summer than in autumn. Although WT, pH, and ORP in winter were the lowest throughout the year, TP, DO, Cond., and BOD 5 were higher than those in other seasons. The WT ranged from 25.62 ℃ to -0.02 ℃, reaching its highest value in summer. The water was alkaline, the pH values ranged from 10.78 to 6.68, and there was no significant difference in the values between summer and autumn. The values for Cond. varied from 136 μS/cm (S14 in autumn) to 939 μS/cm (S2 in winter). ORP varied from 199 mV to 434 mV, the highest at S11. TN was higher in the spring and winter months than in summer and autumn. The highest TN concentrations were found at S1 (1.7 mg/L). TP did not change significantly in spring, summer, and autumn. The highest TP concentrations were mainly recorded in winter: ranging from 0.02 to 2.40 mg/L. The N: P ratio varied from 0.52 (S1 in summer) to 51.64 (S15 in spring), and the average value in spring was the highest. CODMn concentrations ranged from 1.57 mg/L to 10.31 mg/L, the highest value was found at S16 in winter, followed by S1 (9.89 mg/L) and S3 (9.87 mg/L) in spring, and the lowest value was found at S16 in autumn. DO values ranged from 1.05 mg/L to 12.31 mg/L, and the values in autumn and winter were significantly higher than those in spring and summer. The BOD5 was significantly lower in spring, and the highest value was found at S16 (6.40 mg/L) in winter, followed by S1 (5.80 mg/L) in spring, and the lowest value was found at S12 (0.07 mg/L) in spring.

|
| Fig.2 Variations of the environmental parameters in different seasons *: 0.01 < P≤0.05; **: P≤0.01. |
The seasonal and spatial variations of TSI are shown in Fig. 3. The trophic state of the water in the ASRB was best in autumn, followed by summer, spring, and winter. The upstream water quality of the ASRB was better than that of the downstream. The TSI values in winter and spring were 61.21±7.08 and 59.26±8.52, respectively, being significantly higher than those in summer and autumn (P < 0.05). It was at the middle eutrophic level in winter, light eutrophic level in spring and summer. The nutritional status in autumn was better than that in other seasons. In relation to the spatial distribution, the area near the reservoir (S14–S16) has a low nutritional status and was at oligotrophic to light eutrophic levels; the nutritional status of the lower reaches of the river (S1–S7) was significantly higher than that of other areas (P < 0.05), which is at the mesotrophic to high eutrophic levels.

|
| Fig.3 Spatial distribution of trophic state index in ASRB during different seasons a. spring; b. summer; c. autumn; d. winter. |
In this study, 127 taxa of phytoplankton belonging to 73 genera were identified including 66 species of Chlorophyta, 33 species of Bacillariophyta, 16 species of Cyanobacteria, 4 species of Cryptophyta, 4 species of Euglenophyta, 2 species of Dinophyta, 1 species of Chrysophyta, and 1 species of Xanthophyta. According to the dominance index (Y≥0.02), 37 species of dominant algae, with dominance indexes between 0.02 and 0.81 (Supplementary Table S3) were identified. Five algae, namely Cyclotella meneghiniana Kützing, Navicula radiosa Kützing, Nitzschia palea (Kützing) W. Smith, Limnothrix redekei Van Goor, and Pseudanabaena limnetica (Lemmermann) Komárek were dominant throughout the year. The phytoplankton abundance in spring reached the highest compared to other seasons. The highest abundance appeared at S10 in spring (3.45×10⁷ inds./L) and the lowest at S16 in summer (3.35×10⁵ inds./L; Fig. 4).

|
| Fig.4 Variation in abundances of phytoplankton during the study period |
Succession at the species level was compared among the four seasons (Fig. 5). There were significant differences (P < 0.05) between adjacent seasons among the 24 dominant species. The diatoms predominated the assemblages in spring, accounting for 95% of the total abundance. From spring to summer, five of the diatoms (C. meneghiniana, Asterionella formosa, Encyonema minutum (Hilse) Mann, Surirella angustata Kützing, and M. granulata) had significantly decreased. Then, there was a sharp increase in Chlorophyta and Cyanobacteria in summer, as they dominated by 31% and 10% respectively, including Merismopedia tenuissima, and Kirchneriella obesa (W. West) Schmidle. In autumn, M. tenuissima decreased, while Ankistrodesmus acicularis (A. Braun) Korschikoff and P. limnetica increased significantly. Although the status of diatom had gradually increased (from 48% to 72%), the abundance of Gyrosigma acuminatum (Kützing) Rabenhorst had decreased significantly. In the following autumn and winter, the dominance of the diatoms declined again. Dominant algae, such as C. meneghiniana Kützing, Nitzschia acicularis (Kützing) W. Smith, Gomphonema parvulum (Kützing) Kützing, and M. granulata, decreased significantly. Chlorophyta and Cyanobacteria (Ankistrodesmus falcatus (A. Braun) Korschikoff, Raphidiopsis sinensia Jao, K. obesa, Tetrastrum staurogeniaeforme (Schroeder) Lemmermann, A. acicularis, Scenedesmus quadricauda (Turpin) Brébisson, and M. tenuissima) also decreased significantly. Meanwhile, Gymnodinium aeruginosum Stein and Cryptomonas ovata Ehrenberg increased significantly. In the transition from winter to spring, the abundance of diatoms, including C. meneghiniana, M. granulata, E. minutum, G. parvulum, Synedra acus Kützing, and A. formosa increased significantly. A. falcatus, R. sinensia, S. quadricauda, Chroococcus minutus (Kützing) Nägeli, Ankistrodesmus falcatus var. mirabilis (West & West) G. S. West, and T. staurogeniaeforme also increased. At the same time, G. aeruginosum significantly decreased from winter to spring.

|
| Fig.5 Seasonal shifts in the assembly dynamics of phytoplankton communities in ASRB The composition of average seasonal profiling of dominant phylum is shown in the ring charts. Red arrows indicate that dominant species significantly increase between adjacent seasons, and blue arrows indicate a significant decrease. *: 0.01 < P≤0.05; **: P≤0.01. |
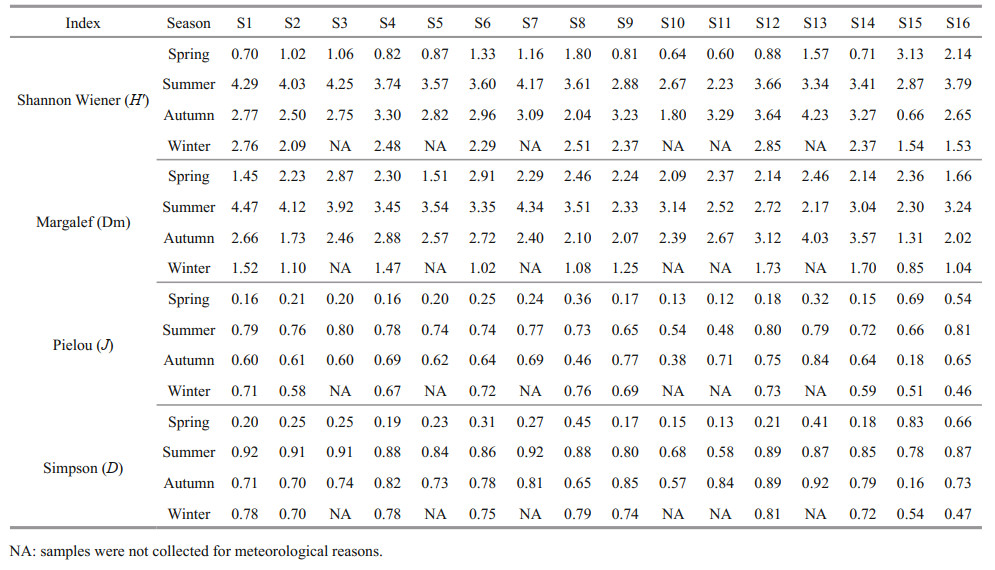
In this study, we calculated the multiple diversity indexes of the ASRB (Table 1). The Shannon Wiener (H′) indices varied from 0.6 to 4.29. The highest value appeared at the S1 (4.29) in summer, and the lowest values at S11 (0.60) and S10 (0.64) in spring. The Margalef index (Dm) ranged from 0.85 to 4.47, with the maximum occurring at S1 in summer, and the minimum occurring at S15 in winter. Species evenness index (J) varied from 0.12 (S11 in spring) to 0.84 (S13 in autumn), and average values were the lowest in spring. For the Simpson index (D), the highest value was obtained in S1 and S7 (0.92) in summer, and the lowest value appeared at S11 (0.13) in spring.
The redundancy analysis (RDA) shows the relationship between phytoplankton communities and the environmental factors. The eigenvalues of the first two axes were 0.128 and 0.096, accounting for 34.6% and 60.6%, respectively, of the cumulative variance of the relationship between species-environmental variables (Fig. 6). Based on the results, the TN (R2=0.937 8) contents were strongly related to axis 1, while DO (R2=0.881 4), ORP (R2=-0.827 2), pH (R2=-0.792 1), and WT (R2=-0.702 3) were strongly related to axis 2.

|
| Fig.6 RDA of all sample sites during the study period a. ordination graph showing the distribution of all sample sites during the study period; b. dominant species. Arrows indicate the phytoplankton's succession and distribution. |
Figure 6a shows an apparent seasonal variation during the study period. The ordination graph clearly shows that the succession of the phytoplankton community are mainly driven by physical and chemical factors. It shows that the succession of phytoplankton was under the influence of CODMn and TN in spring, and is restricted by water temperature in summer. In winter, the phytoplankton communities are closely associated with the concentration of DO.
As shown in Fig. 6b, two predominant species, S. angustata and Euglena viridis Ehrenberg, are highly positively correlated with CODMn. Chroomonas acuta Utermhöl is highly correlated with TN. A. falcatus and G. parvulum are influenced by temperature. Eight dominant species (Actinasturm hantzschii Lagerheim, A. acicularis, Ankistrodesmus angustus Bernard, Spirulina sprinceps W. et G. S. West, N. radiosa, Diatoma vulgare Borger, N. palea, and L. redekei) are associated with BOD5. C. microsphaerella and G. aeruginosum exhibit particular linkage to high DO.
3.5 MRT analysis and indicatorsMRT analysis revealed the relationship between environmental variables and the composition of the phytoplankton community (Fig. 7; Supplementary Table S4). The three groups were split based on the DO and TN. In total, the tree explains 25.4% of the variance of the phytoplankton community, suggesting that the phytoplankton community was split by the DO first, accounting for 13.4% of the variation, and then the phytoplankton communities in Group 1 were separated from those in Groups 2 and 3. The phytoplankton communities in Groups 2 and 3 were split by TN concentrations, accounting for 12% of the variation. Further analysis revealed that 24 of the 37 dominant species were significant indicators (P < 0.05), among which Group 1 contained three indicators, C. microsphaerella, G. aeruginosum, A. acicularis; Group 2 contained nine indicators, including M. granulata, M. tenuissima, S. quadricauda, and K. obesa. A total of 12 species were included in Group 3, including A. formosa, C. ovata, C. acuta, and S. angustata.

|
| Fig.7 Multivariate regression tree (MRT) analysis of the correlation between environmental variables and phytoplankton community composition n: the number of sample sites in each group. |
Phytoplankton are located at the bottom of the food chain. They play critical roles in global carbon cycle (Zguna et al., 2019). Phytoplankton plays important roles in aquatic ecosystems, as they release oxygen during photosynthesis and aid in the energy exchange process (Lansac-Tôha et al., 2019). The temporal-spatial distribution patterns of phytoplankton are essential in the evaluation of the functions of aquatic ecosystems; it affects ecological processes, functions, and stability and reflects changes in ecological environment (Guo et al., 2014).
Following the first exploration of the biodiversity of the phytoplankton community in the ASRB, 127 taxa of phytoplankton were identified. The richness was found higher in the ASRB than those of other aquatic ecosystems in Heilongjiang Province, such as Genhe River (61 taxa) (Li et al., 2019) and Xingkai Lake Basin (108 taxa) (Yuan et al., 2018). The highest phytoplankton abundance was recorded as 3.45×10⁷ inds./L in this study. These results might be attributed to the extreme anthropogenic activity-based ecological disturbance and a large amount of nutrient input in ASRB. Bacillariophyta and Chlorophyta were more abundant, whereas Cyanobacteria and Cryptophyta were less abundant. Bacillariophyta is considered the most critical taxonomic group in temperate rivers in terms of abundance and diversity (Rojo et al., 1994). In the rivers, Bacillariophyta and Chlorophyta usually dominate, followed by Cryptophyta and Cyanobacteria, whereas other phylum usually have less abundance (Rojo et al., 1994).
Total phytoplankton abundance in this study indicated an apparent increasing trend in spring and probably reflects the change in nutrient concentrations. TN reaches its highest value and the N: P ratio also reaches its highest value in spring. N: P ratio also plays a vital role in phytoplankton reproduction (Masithah et al., 2019). The higher N: P ratio in the ASRB promotes the reproduction of phytoplankton in spring. Storm rainfall events are usually recorded in summer in temperate rivers. Previous studies have shown that rainfall is the main natural disturbance driving hydrological changes (Bookhagen and Burbank, 2010). The amount of precipitation in summer (rainfall period) added to the river through surface runoff, leading to increase in turbidity. In addition, low light availability due to high-river discharge and fast flow velocity are the main factors contributing to the reduction of phytoplankton abundance (Bradford et al., 2013). The nutrient levels in autumn were similar to those in summer, the rainfall decreased, and water transparency increased. The average phytoplankton abundance in summer was (7.91±3.63)×105 inds./L, and the abundance in autumn was (1.01±0.65)×106 inds./L. During the study period, the lowest phytoplankton abundance was recorded in winter ((6.95±4.09)×105 inds./L). These results can be attributed to the thicker ice layer in winter and the low light utilization for phytoplankton reproduction. Only a few diatoms and Cyanobacteria dominated in the winter. The phytoplankton Shannon Weaner, Margalef, and Simpson indexes of the ASRB were the highest in summer, followed by autumn, suggesting that the phytoplankton community structure was relatively stable in spring and autumn. These results were also confirmed by the Pielou index in the ASRB. Although the number of phytoplankton species in spring (86) was higher than that in autumn, the dominance of C. meneghiniana in spring was significantly higher than that of other species, resulting in lower diversity indexes in spring than in the other seasons. Average Pielou index was 0.26±0.16 in spring, indicating that the phytoplankton community structures were unstable.
In this study, we observed that diatoms bloom in spring, then dominate throughout the year, Chlorophyta dominates in summer and autumn, while Cyanobacteria has a higher dominance in winter. The PEG model suggests that the seasonal succession of the phytoplankton community changes from Cryptophyta and Bacillariophyta in winter and spring, followed by Chlorophyta in summer and then Cyanobacteria in late summer and early autumn. These results show that although the PEG model can be used to describe the seasonal succession of phytoplankton communities in deep-water lakes in the temperate zone, there are specific differences in the ASRB. Diatoms like to live in low- and medium-temperature flowing water and are the leading ecological group in river ecosystems (Cibic et al., 2018). Under clear ice, light conditions may promote diatoms and provide conditions for the quick start of the spring bloom (Sommer et al., 2012). In this study, the order of diatom abundance changes is spring > autumn > winter > summer.
Compared with winter, the water temperature in spring gradually rises and the ice layer melts, which promotes the reproduction of diatoms. However, higher water temperature will also limit the growth of diatoms. A previous study noted that the diatoms could be dormant in warm water temperature; thus, the reproduction of diatoms stops in summer (Saros and Anderson, 2015). Combined with the ecological characteristics and changes in environmental factors, we found that the water temperature in summer was higher and induced dormancy in diatoms, while the temperature in other seasons was suitable for the reproduction of diatoms. The higher water temperature in summer is more suitable for the mass reproduction of Chlorophyta and Cyanobacteria, giving them a higher dominant position in summer and autumn. In winter, the purification ability of the water is poor and decomposers have a slower reproduction rate, and a large amount of pollutants is discharged into the ASRB from upstream. Pollutants can stimulate the rapid division of Cyanobacteria, which eventually causes the density of Cyanobacteria in winter to be higher than that in other seasons.
This study reveals a gradual increase in the abundance and diversity of phytoplankton, from upstream to downstream, throughout the year. These results can be explained by the extra time taken for the phytoplankton to grow and the inflow of more nutrients from upstream to downstream, which is a typical characteristic of rivers (Ha et al., 1998). Among them, sites (S1–S9) located downstream of the river in urban areas were subject to human interference much more than those located in the upstream in the ASRB. The intermediate disturbance hypothesis (IDH) suggests that moderate interference can increase species diversity (Liu et al., 2019), consistent with the IDH. Many pollutants were collected downstream of the river, promoting the increase in the abundance and diversity of phytoplankton located downstream. Low discharge coincided with high nutrient concentrations in the S10 and S11 sites, resulting in phytoplankton abundance reaching its maximum at these sites. These sites had the lowest evenness indexes, suggesting the domination by only a few species and the precarious community structures. Reservoirs might alter the physical and chemical conditions of the rivers and cause upstream and downstream variations in the composition and abundance of the phytoplankton communities (Tornés et al., 2014). Sabater-Liesa et al. (2018) reported that the responses of phytoplankton and environmental variables were not uniform in the Ebro River, and they revealed spatial variability discontinuities upstream and downstream of the reservoirs. Tornés et al. (2014) suggested that reservoirs could change the spatial pattern of phytoplankton density. However, in this study, the abundance of phytoplankton in S14, which is located downstream of the reservoir, was higher than those of S15 and S16, which were located upstream of the reservoir. However, phytoplankton species increased downstream. These results indicate that the reservoirs do not cause significant fluctuations in phytoplankton abundance and diversity of the ASRB.
4.2 Driving factor of phytoplankton communityThe relationship between phytoplankton and environmental factors is highly dynamic and have been the focus of many studies (Li et al., 2019). Various human activities increasingly influence the nutrient composition of the rivers (Liu et al., 2011). As with many other river systems, the richness, diversity, and succession patterns of phytoplankton were closely associated with anthropogenic pollution (Nassar and Fahmy, 2016; Tian et al., 2017). Phytoplankton succession is mainly determined by the interactions of environmental factors (Nassar and Fahmy, 2016; Tian et al., 2017). RDA reveals that the TN, WT, ORP, pH, and DO were critically linked to the phytoplankton community succession. More precisely, the main factors driving the change in phytoplankton community structures in spring was the TN; in summer and autumn they were WT, ORP, and pH; and it was DO in winter.
Nitrogen is one of the many elements required for reproduction and metabolism in phytoplankton (Tang et al., 2018). TN concentration is the key signal for assessing the pollution of aquatic systems. In this study, the RDA showed that A. formosa was positively correlated with TN. Notably, the average concentration of TN was as high as 1.26 mg/L during spring and winter in ASRB. The dominance of A. formosa was 0.06 and 0.11, in spring and winter, respectively; the density of A. formosa is usually the highest at the sites where the TN was higher, such as S1, S8, S9, and S10. A previous report showed that A. formosa is usually an indicator of nitrogen enrichment (Slemmons et al., 2017), which is consistent with the results obtained in this study. Additionally, we found that C. ovata and C. acuta were located in the right of the first RDA axis and were closely related to the increase in TN. Early studies have shown that C. ovata and C. acuta are highly adaptable to temperature and light, and that their growth is favoured by higher levels of nutrients (Greisberger and Teubner, 2007). These results are consistent with the closeness of these species to TN.
Warm temperatures provide favorable conditions for phytoplankton reproduction (Tucker and van der Ploeg, 1993). In previous studies, water temperature was the predominant environmental factor influencing the structure of the phytoplankton community (Ma et al., 2014). In this study, RDA shows that most of the Cyanobacteria and Chlorophyta were located on the left of the second RDA axis; the correlation between WT and Chlorophyta was higher than that between WT and Cyanobacteria. It is clear that the adaptability of Cyanobacteria to water temperature differs from that of Chlorophyta; Chlorophyta has the broadest range of adaptation to water temperature, followed by Cyanobacteria (McQueen and Lean, 1987).
The existence, migration, and transformation of various organic and inorganic substances in water are connected to the redox reactions (Kedziorek et al., 2008). The ORP reflects the strength of the oxidizing and reducing properties of the water; the higher the ORP, the better the water quality (Ioka et al., 2016). In the ASRB, the ORP in winter was significantly lower than that in other seasons, while the ORP in spring varied widely (367–483 mV). The RDA showed that N. radiosa, S. sprinceps, and Phacus pyrum (Ehrenberg) Stein were distributed above the second RDA axis, and they were related to the decline in ORP and increase in TP. The lower ORP in the areas subject to severe human disturbance located downstream of the ASRB was consistent with high concentrations of TP. A previous study indicated that the source of TP might be the lower ORP, which promoted the release of phosphorus in the water by the sediment, and led to the deepening of the eutrophication of the water (Shenker et al., 2005).
The reproduction and colonization of phytoplankton are closely associated with pH (Shi et al., 2009). Alkaline water with high pH is more conducive for the formation of organic matter, which is necessary for increase in phytoplankton reproduction (Liu et al., 2010). In the ASRB, phytoplankton community structures were significantly affected by pH in spring and summer, and this period has higher pH and phytoplankton abundance, which were consistent with previous research (Liu et al., 2010). The pH range of 7.5 to 9.0 was more conducive for the reproduction of Bacillariophyta (Unrein et al., 2010). RDA shows that most of the Bacillariophyta and Chlorophyta are located below the first RDA axis; they are positively linked to pH, and negatively correlated with TP. Previous studies have shown that the form of phosphorus in water is closely related to the pH; when pH > 8, phosphorus mainly exists as orthophosphate, the main form absorbed by algae (Kunoh and Niwa, 1997). Phytoplankton reproduction is closely related to pH; increased phytoplankton abundance leads to high pH (Zhang et al., 2019). Contrarily, CO2 is the primary raw material for photosynthesis by phytoplankton, and its decline can reduce photosynthesis, thereby inhibiting phytoplankton reproduction (Keys et al., 2018).
DO is a key factor for phytoplankton reproduction and metabolism as shown in earlier studies (Xu et al., 2010). Increased DO concentration has negative effects, not only on growth, but also on the biomass of individual phytoplankton species. In this study, the DO concentration changed seasonally, and the DO in spring and summer was significantly lower than that in autumn and winter. These results might be attributed to the phytoplankton abundance which increased significantly in spring and summer. Although photosynthesis increases O2 concentrations during daytime, higher phytoplankton abundance also accelerates the reduction of dissolved oxygen in the water column. In addition, the lower water temperature in winter is also one of the reasons for the increase in DO (Cardo et al., 2012). RDA shows that four dominant algae species (G. aeruginosum, S. sprinceps, C. microsphaerella, and N. radiosa) were positively correlated with DO, indicating that they make specific contribution to the DO in water. G. aeruginosum can adapt to low light intensity and temperature (Erturk et al., 2014). Thicker ice layers in winter prevent the penetration of sunlight and the light available in the water becomes weaker, resulting in a significantly higher density of this species in winter than in other seasons. We speculated that other factors unmeasured in our study might drive the dynamics of phytoplankton communities, such as rainfall, hydrology, suspended solids, and the relationship between phytoplankton community and other communities, and interspecific relationships. Thus, it is necessary to gain further insight into other factors that affect the ASRB phytoplankton community structure change.
4.3 Phytoplankton as indicators for water quality assessmentPhytoplankton growth and distribution are deeply dependent on environmental factors, such as changes in nutrient concentrations (Guo et al., 2019). Currently, phytoplankton is usually used as a biological indicator in water quality evaluation (Guo et al., 2019). In this study, the sites were divided into three groups for MRT analysis, and Group 1 mainly included winter sample sites. Our results showed that winter presents higher trophic state indexes throughout the year. Analysis of the indicators showed that C. microsphaerella was the species with the highest indicator value (0.67) in Group 1. At the same time, C. microsphaerella appeared in large numbers in winter sites. Kivrak (2006) reported that a river with high eutrophication, low water levels, and longer residence time resulted in high abundance of C. microsphaerella. Thus, C. microsphaerella is generally considered a sign of eutrophication. It is similar to the hydrological status of the ASRB in winter in this study. We speculated that C. microsphaerella in the ASRB could also be used as an indicator for eutrophication. M. granulata has the highest indicator value (0.68) in Group 2, mainly in summer and autumn sites. TSI indicates that its water environment is at a mesotrophic state. Studies have reported that M. granulata usually indicates the mesotrophic level (Li et al., 2011; Varol, 2019). In the ASRB in summer and autumn, most sites were at the mesotrophic level; only seven sites in summer were at light eutrophic level, indicating that M. granulata can also be a good indicator of ASRB waters during these seasons. The indicator value of M. tenuissima in Group 2 was 0.57, while M. tenuissima usually indicates the mesotrophic level (Barinova et al., 2008), which is also applicable in the ASRB. A. formosa had a higher indicator value (0.81) in Group 3, which were spring sites. We found that A. formosa had a higher abundance in spring; meanwhile, it has been proven in multiple studies to indicate eutrophication levels (Slemmons et al., 2017; Szabó et al., 2020). This finding is consistent with the results of TSI. The TSI in spring was 59.26 ± 8.52, which was close to the middle eutrophic level, indicating that A. formosa was an indicator of water quality in the ASRB. In summary, we believe that C. microsphaerella, M. granulata, M. tenuissima, and A. formosa can effectively indicate changes in water quality and be used as relevant tools for indicating water quality for ASRB.
5 CONCLUSIONThis study demonstrated the relationship between phytoplankton community and environmental factors in the ASRB. High phytoplankton richness with 127 species from 7 phyla and 73 genera was recorded in the ASRB. TSI showed that the water quality of ASRB is at mesotrophic to middle eutrophic levels. The significant seasonal variation of phytoplankton community and environmental factors revealed that phytoplankton community shift is a relevant indicator for water quality assessment. TN, WT, ORP, pH, and DO are crucial predictors of phytoplankton community structures. In addition, C. microsphaerella, M. granulata, M. tenuissima, and A. formosa are potential valuable indicators for the determination of water quality in ASRB. Our findings provide important information on water quality maintenance and management at the basin scale.
6 DATA AVAILABILITY STATEMENTThe authors declare that the data supporting the findings of this study are available within the article.
Electronic supplementary material
Supplementary material (Supplementary Tables S1–S4) is available in the online version of this article at https://doi.org/10.1007/s00343-021-1272-x.
Abell J M, Özkundakci D, Hamilton D P. 2010. Nitrogen and phosphorus limitation of phytoplankton growth in New Zealand lakes: implications for eutrophication control. Ecosystems, 13(7): 966-977.
DOI:10.1007/s10021-010-9367-9 |
Aufdenkampe A K, Mayorga E, Raymond P A, et al. 2011. Riverine coupling of biogeochemical cycles between land, oceans, and atmosphere. Frontiers in Ecology and the Environment, 9(1): 53-60.
DOI:10.1890/100014 |
Barinova S, Medvedeva L, Nevo E. 2008. Regional influences on algal biodiversity in two polluted rivers of Eurasia (Rudnaya River, Russia, and Qishon River, Israel) by bioindication and Canonical Correspondence Analysis. Applied Ecology and Environmental Research, 6(4): 29-59.
DOI:10.15666/aeer/0604_029059 |
Bookhagen B, Burbank D W. 2010. Toward a complete Himalayan hydrological budget: spatiotemporal distribution of snowmelt and rainfall and their impact on river discharge. Journal of Geophysical Research, 115(F3): F03019.
DOI:10.1029/2009JF001426 |
Bradford T M, Morgan M J, Lorenz Z, et al. 2013. Microeukaryote community composition assessed by pyrosequencing is associated with light availability and phytoplankton primary production along a lowland river. Freshwater Biology, 58(11): 2401-2413.
DOI:10.1111/fwb.12219 |
Cao J, Hou Z Y, Li Z K, et al. 2018. Succession of phytoplankton functional groups and their driving factors in a subtropical plateau lake. Science of the Total Environment, 631-632: 1127-1137.
DOI:10.1016/j.scitotenv.2018.03.026 |
Cardo M V, Vezzani D, Carbajo A E. 2012. Immature mosquitoes from groundwater habitats in a temperate wetland of Argentina: environmental associations and seasonal variation of community attributes. Journal of the American Mosquito Control Association, 28(3): 151-159.
DOI:10.2987/12-6225R.1 |
Cibic T, Cerino F, Karuza A, et al. 2018. Structural and functional response of phytoplankton to reduced river inputs and anomalous physical-chemical conditions in the Gulf of Trieste (northern Adriatic Sea). Science of the Total Environment, 636: 838-853.
DOI:10.1016/j.scitotenv.2018.04.205 |
Erturk A, Sivri N, Seker D Z, et al. 2014. Analysis of the distribution of phytoplankton and enteric bacteria in Efteni Lake, Turkey. African Journal of Microbiology Research, 8(21): 2144-2154.
DOI:10.5897/AJMR12.1147 |
Foden J, Devlin M J, Mills D K, et al. 2011. Searching for undesirable disturbance: an application of the OSPAR eutrophication assessment method to marine waters of England and Wales. Biogeochemistry, 106(2): 157-175.
DOI:10.1007/s10533-010-9475-9 |
Greisberger S, Teubner K. 2007. Does pigment composition reflect phytoplankton community structure in differing temperature and light conditions in a deep alpine lake? An approach using HPLC and delayed fluorescence techniques. Journal of Phycology, 43(6): 1108-1119.
DOI:10.1111/j.1529-8817.2007.00404.x |
Guo B Q, Wang Q C, Yu H L, et al. 2005. Stream water quality and its influencing factor in lower order streams in upriver sections of Ashihe River. Journal of Forestry Research, 16(3): 181-186.
DOI:10.1007/BF02856811 |
Guo C, Liu H, Zheng L, et al. 2014. Seasonal and spatial patterns of picophytoplankton growth, grazing and distribution in the East China Sea. Biogeosciences, 11(7): 1847-1862.
DOI:10.5194/bg-11-1847-2014 |
Guo F, Jiang G H, Zhao H L, et al. 2019. Physicochemical parameters and phytoplankton as indicators of the aquatic environment in karstic springs of South China. Science of the Total Environment, 659: 74-83.
DOI:10.1016/j.scitotenv.2018.12.329 |
Ha K, Kim H W, Joo G J. 1998. The phytoplankton succession in the lower part of hypertrophic Nakdong River (Mulgum), South Korea. Hydrobiologia, 369: 217-227.
DOI:10.1023/A:1017067809089 |
Holopainen A L, Lepistö L, Niinioja R, et al. 2008. Spatiotemporal and long-term variation in phytoplankton communities in the oligotrophic Lake Pyhäjärvi on the Finnish-Russian border. Hydrobiologia, 599(1): 135-141.
DOI:10.1007/s10750-007-9203-1 |
Huang W, Zhu X Y, Zeng J N, et al. 2012. Responses in growth and succession of the phytoplankton community to different N/P ratios near Dongtou Island in the East China Sea. Journal of Experimental Marine Biology and Ecology, 434-435: 102-109.
DOI:10.1016/j.jembe.2012.08.008 |
Ioka S, Muraoka H, Matsuyama K, et al. 2016. In situ redox potential measurements as a monitoring technique for hot spring water quality. Sustainable Water Resources Management, 2(4): 353-358.
DOI:10.1007/s40899-016-0065-4 |
Kedziorek M A M, Geoffriau S, Bourg A C M. 2008. Organic matter and modeling redox reactions during river bank filtration in an alluvial aquifer of the Lot River, France. Environmental Science & Technology, 42(8): 2793-2798.
DOI:10.1021/es702411t |
Kerimoglu O, Straile D, Peeters F. 2013. Seasonal, inter-annual and long term variation in top-down versus bottom-up regulation of primary production. Oikos, 122(2): 223-234.
DOI:10.1111/j.1600-0706.2012.20603.x |
Keys M, Tilstone G, Findlay H S, et al. 2018. Effects of elevated CO2 and temperature on phytoplankton community biomass, species composition and photosynthesis during an experimentally induced autumn bloom in the Western English Channel. Biogeosciences, 15(10): 3203-3222.
DOI:10.5194/bg-15-3203-2018 |
Kivrak E. 2006. Seasonal and long term changes of the phytoplankton in the lake Tortum in relation to environmental factors, Erzurum, Turkey. Biologia, 61(4): 339-345.
DOI:10.2478/s11756-006-0062-4 |
Kunoh M, Niwa K. 1997. Dependence of filamentous algae's absorption of dissolved orthophosphate on the concentration and temperature. Journal of Japan Society on Water Environment, 20(4): 269-277.
DOI:10.2965/jswe.20.269 |
Lansac-Tôha F M, Heino J, Quirino B A, et al. 2019. Differently dispersing organism groups show contrasting beta diversity patterns in a dammed subtropical river basin. Science of the Total Environment, 691: 1271-1281.
DOI:10.1016/j.scitotenv.2019.07.236 |
Li J, Peng F L, Ding D B, et al. 2011. Characteristics of the phytoplankton community and bioaccumulation of heavy metals during algal blooms in Xiangjiang River (Hunan, China). Science China Life Sciences, 54(10): 931-938.
DOI:10.1007/s11427-011-4222-6 |
Li X Y, Yu H X, Wang H B, et al. 2019. Phytoplankton community structure in relation to environmental factors and ecological assessment of water quality in the upper reaches of the Genhe River in the Greater Hinggan Mountains. Environmental Science and Pollution Research, 26(17): 17512-17519.
DOI:10.1007/s11356-019-05200-3 |
Litchman E, de Tezanos Pinto P, Klausmeier C A, et al. 2010. Linking traits to species diversity and community structure in phytoplankton. Hydrobiologia, 653(1): 15-28.
DOI:10.1007/s10750-010-0341-5 |
Liu S M, Li R H, Zhang G L, et al. 2011. The impact of anthropogenic activities on nutrient dynamics in the tropical Wenchanghe and Wenjiaohe Estuary and Lagoon system in East Hainan, China. Marine Chemistry, 125(1-4): 49-68.
DOI:10.1016/j.marchem.2011.02.003 |
Liu X H, Liu X F, Wu L, et al. 2019. Diversity in phytoplankton communities: a field test of the intermediate disturbance hypothesis. Ecological Engineering, 129: 54-60.
DOI:10.1016/j.ecoleng.2018.12.009 |
Liu X J, Shi X L, Qi G L, et al. 2010. Application of freshwater algae in monitoring water quality and sewage purification. Journal of Biology, 27(6): 76-78, 86.
(in Chinese with English abstract) DOI:10.3969/j.issn.1008-9632.2010.06.076 |
Ma G W, Wang Y Y, Bao X, et al. 2015. Nitrogen pollution characteristics and source analysis using the stable isotope tracing method in Ashi River, northeast China. Environmental Earth Sciences, 73(8): 4831-4839.
DOI:10.1007/s12665-014-3786-4 |
Ma Y, Li G B, Li J, et al. 2014. Seasonal succession of phytoplankton community and its relationship with environmental factors of North Temperate Zone water of the Zhalong Wetland, in China. Ecotoxicology, 23(4): 618-625.
DOI:10.1007/s10646-014-1231-9 |
Margalef D R. 1967. Some concepts relative to the organization of plankton. Oceanography and Marine Biology - an Annual Review, 5: 257-289.
|
Masithah E D, Nindarwi D D, Husin D, et al. 2019. Dynamic ratio correlation of N: P toward phytoplankton explosions in intensive systems of white shrimp pond. IOP Conference Series: Earth and Environmental Science, 236: 012019.
DOI:10.1088/1755-1315/236/1/012019 |
McQueen D J, Lean D R S. 1987. Influence of water temperature and nitrogen to phosphorus ratios on the dominance of blue-green algae in Lake St. George, Ontario. Canadian Journal of Fisheries and Aquatic Sciences, 44(3): 598-604.
DOI:10.1139/f87-073 |
Ministry of Environmental Protection of the People's Republic of China (MEP). 1989a. Water Quality— Determination of Total Phosphorus—Ammonium Molybdate Spectrophotometric Method (GB11893-89). China Environmental Science Press, Beijing, China. (in Chinese)
|
Ministry of Environmental Protection of the People's Republic of China (MEP). 1989b. Water Quality—Determination of Permanganate Index (11892-89). China Environmental Science Press, Beijing, China. (in Chinese)
|
Ministry of Environmental Protection of the People's Republic of China (MEP). 2009. Water Quality—Determination of Biochemical Oxygen Demand after 5 Days (BOD5) for Dilution and Seeding Method (HJ505-2009). China Environmental Science Press, Beijing, China. (in Chinese)
|
Ministry of Environmental Protection of the People's Republic of China (MEP). 2012. Water Quality-Determination of Total Nitrogen-Alkaline Potassium Persulfate Digestion UV Spectrophotometric Method (HJ636-2012). China Environmental Science Press, Beijing, China. (in Chinese)
|
Nassar M Z A, Fahmy M A. 2016. Effects of some environmental factors on the population density and species diversity of phytoplankton in Bitter Lakes, Egypt. Rendiconti Lincei, 27(2): 291-298.
DOI:10.1007/s12210-015-0476-4 |
Pielou E C. 1966. The measurement of diversity in different types of biological collections. Journal of Theoretical Biology, 13: 131-144.
DOI:10.1016/0022-5193(66)90013-0 |
Rojo C, Cobelas M A, Arauzo M. 1994. An elementary, structural analysis of river phytoplankton. Hydrobiologia, 289(1-3): 43-55.
DOI:10.1007/BF00007407 |
Sabater-Liesa L, Ginebreda A, Barceló D. 2018. Shifts of environmental and phytoplankton variables in a regulated river: a spatial-driven analysis. Science of the Total Environment, 642: 968-978.
DOI:10.1016/j.scitotenv.2018.06.096 |
Saros J E, Anderson N J. 2015. The ecology of the planktonic diatom Cyclotella and its implications for global environmental change studies. Biological Reviews, 90(2): 522-541.
DOI:10.1111/brv.12120 |
Shannon C E, Weaver W, Wiener N. 1949. The Mathematical Theory of Communication. University of Illinois Press, Urbana.
|
Shenker M, Seitelbach S, Brand S, et al. 2005. Redox reactions and phosphorus release in re-flooded soils of an altered wetland. European Journal of Soil Science, 56(4): 515-525.
DOI:10.1111/j.1365-2389.2004.00692.x |
Shi D, Xu Y, Morel F M M. 2009. Effects of the pH/pCO 2 control method on medium chemistry and phytoplankton growth. Biogeosciences, 6(7): 1199-1207.
DOI:10.5194/bg-6-1199-2009 |
Simpson E H. 1949. Measurement of diversity. Nature, 163(4148): 688.
DOI:10.1038/163688a0 |
Slemmons K E H, Rodgers M L, Stone J R, et al. 2017. Nitrogen subsidies in glacial meltwaters have altered planktonic diatom communities in lakes of the US Rocky Mountains for at least a century. Hydrobiologia, 800(1): 129-144.
DOI:10.1007/s10750-017-3187-2 |
Sommer U, Adrian R, De Senerpont Domis L, et al. 2012. Beyond the Plankton Ecology Group (PEG) model: mechanisms driving plankton succession. Annual Review of Ecology Evolution & Systematics, 43: 429-448.
DOI:10.1146/annurev-ecolsys-110411-160251 |
Stenger-Kovács C, Buczkó K, Hajnal É, et al. 2007. Epiphytic, littoral diatoms as bioindicators of shallow lake trophic status: Trophic Diatom Index for Lakes (TDIL) developed in Hungary. Hydrobiologia, 589(1): 141-154.
DOI:10.1007/s10750-007-0729-z |
Szabó Z, Buczkó K, Haliuc A, et al. 2020. Ecosystem shift of a mountain lake under climate and human pressure: a move out from the safe operating space. Science of the Total Environment, 743: 140584.
DOI:10.1016/j.scitotenv.2020.140584 |
Tang X, Zhang X L, Cao T, et al. 2018. Reconstructing clear water state and submersed vegetation on behalf of repeated flocculation with modified soil in an in situ mesocosm experiment in Lake Taihu. Science of the Total Environment, 625: 1433-1445.
DOI:10.1016/j.scitotenv.2018.01.008 |
Tian W T, Zhang H Y, Zhao L, et al. 2017. Phytoplankton diversity effects on community biomass and stability along nutrient gradients in a Eutrophic lake. International Journal of Environmental Research and Public Health, 14(1): 95.
DOI:10.3390/ijerph14010095 |
Tornés E, Pérez M C, Durán C, et al. 2014. Reservoirs override seasonal variability of phytoplankton communities in a regulated Mediterranean river. Science of the Total Environment, 475: 225-233.
DOI:10.1016/j.scitotenv.2013.04.086 |
Tucker C S, van der Ploeg M. 1993. Seasonal changes in water quality in commercial channel catfish ponds in Mississippi. Journal of the World Aquaculture Society, 24(4): 473-481.
DOI:10.1111/j.1749-7345.1993.tb00576.x |
Unrein F, O'Farrell I, Izaguirre I, et al. 2010. Phytoplankton response to pH rise in a N-limited floodplain lake: relevance of N2-fixing heterocystous cyanobacteria. Aquatic Sciences, 72(2): 179-190.
DOI:10.1007/s00027-009-0115-1 |
Varol M. 2019. Phytoplankton functional groups in a monomictic reservoir: seasonal succession, ecological preferences, and relationships with environmental variables. Environmental Science and Pollution Research, 26(20): 20439-20453.
DOI:10.1007/s11356-019-05354-0 |
Wang M C, Liu X Q, Zhang J H. 2002. Evaluate method and classification standard on lake eutrophication. Environmental Monitoring in China, 18(5): 47-49.
(in Chinese with English abstract) DOI:10.3969/j.issn.1002-6002.2002.05.018 |
Wu T F, Qin B Q, Brookes J D, et al. 2019. Spatial distribution of sediment nitrogen and phosphorus in Lake Taihu from a hydrodynamics-induced transport perspective. Science of the Total Environment, 650: 1554-1565.
DOI:10.1016/j.scitotenv.2018.09.145 |
Xu J, Yin K D, Lee J H W, et al. 2010. Long-term and seasonal changes in nutrients, phytoplankton biomass, and dissolved oxygen in Deep Bay, Hong Kong. Estuaries and Coasts, 33(2): 399-416.
DOI:10.1007/s12237-009-9213-5 |
Ye L, Chang C Y, García-Comas C, et al. 2013. Increasing zooplankton size diversity enhances the strength of top-down control on phytoplankton through diet niche partitioning. Journal of Animal Ecology, 82(5): 1052-1061.
DOI:10.1111/1365-2656.12067 |
Yuan Y X, Jiang M, Liu X T, et al. 2018. Environmental variables influencing phytoplankton communities in hydrologically connected aquatic habitats in the Lake Xingkai basin. Ecological Indicators, 91: 1-12.
DOI:10.1016/j.ecolind.2018.03.085 |
Zguna N, Karlson A M L, Ilag L L, et al. 2019. Insufficient evidence for BMAA transfer in the pelagic and benthic food webs in the Baltic Sea. Scientific Reports, 9(1): 10406.
DOI:10.1038/s41598-019-46815-3 |
Zhang Y F, Gao Y H, Kirchman D L, et al. 2019. Biological regulation of pH during intensive growth of phytoplankton in two eutrophic estuarine waters. Marine Ecology Progress Series, 609: 87-99.
DOI:10.3354/meps12836 |
Zhao G X, Gao X P, Zhang C, et al. 2020. The effects of turbulence on phytoplankton and implications for energy transfer with an integrated water quality-ecosystem model in a shallow lake. Journal of Environmental Management, 256: 109954.
DOI:10.1016/j.jenvman.2019.109954 |