 2022, Vol. 40
Institute of Oceanology, Chinese Academy of Sciences
Article Information
- MA Jie, HE Fei, YAN Xingcheng, SHI Ruijie, JI Ming, XU Bin, WU Xiaodong, LI Zhichun, XU Xiaoguang, WANG Guoxiang
- Stoichiometric flexibility regulates the co-metabolism effect during organic carbon mineralization in eutrophic lacustrine sediments
- Journal of Oceanology and Limnology, 40(5): 1974-1984
- http://dx.doi.org/10.1007/s00343-021-1261-0
Article History
- Received Aug. 19, 2021
- accepted in principle Oct. 4, 2021
- accepted for publication Nov. 15, 2021


2 Sorbonne University, Paris, UMR 7619, METIS, Paris 75005, France;
3 School of Environment, Nanjing Normal University, Nanjing 210023, China;
4 College of Urban and Environmental Sciences, Hubei Normal University, Huangshi 435002, China;
5 School of Environment and Surveying Engineering, Soochow University
Organic carbon (OC) burial in lacustrine sediments represent an important sink in global carbon cycling (Cole et al., 2007; Gudasz et al., 2010). Although lakes cover only about 2% of Earth's surface, annual OC burial in lake sediments can amount to approximately 50% of the annual OC burial in marine sediments (Sobek et al., 2009). Aquatic macrophytes are one of the primary sources of OC, which deposit residues composed of cellulose, hemicellulose, lignins, tannins, and cuticular matrix onto the surface of sediments (Li et al., 2013). The relatively recalcitrant OC accumulates gradually and then increases with the lake ecosystem succession (Hanamachi et al., 2008). However, as eutrophication becomes a more widespread environmental problem, an increasing number of shallow lakes have shifted from a clear-water state dominated by macrophytes to a turbid-water state dominated by phytoplankton (i.e., "retrogressive succession") (Scheffer et al., 1993, 2001). Compared with the slow accumulation and decomposition of macrophyte-dominated lakes, the turnover of phytoplankton-dominated lakes is more rapid (Hanamachi et al., 2008). That is, the rate of succession may decrease in phytoplankton-dominated eutrophication lakes. Clarifying the underlying response mechanism of inputing phytoplankton-derived OC into sediments is crucial for understanding the direction and magnitude of succession in eutrophication lacustrine ecosystems.
One vital mechanism driving changes in OC reserves in terrestrial ecosystems is the priming effect, wherein labile OC input affects the extent of microbial activity mediating native OC decomposition (Kuzyakov et al., 2000; Blagodatskaya and Kuzyakov, 2008; Fang et al., 2018). This process is sometimes referred to as the ''co-metabolism effect'' because similar observations have not been made under aseptic conditions (Horvath, 1972; Wakeham and Canuel, 2006; Van Nugteren et al., 2009). Labile sources of any form, including manure, plant residues, and root exudates (Dai et al., 2009; Phillips et al., 2012; Qiao et al., 2014; Zhu et al., 2018), can aid microbial community composition and enhance the decomposition of indigenous OC (Fontaine et al., 2004; De Graaff et al., 2010). Although the co-metabolism effect has been widely reported in terrestrial ecosystems, this effect has been virtually ignored in the study of aquatic ecosystems, especially lacustrine ecosystems (Guenet et al., 2010a). A few studies have mentioned that algae may stimulate the co-metabolism effect in the water column (Bianchi, 2011; Bianchi et al., 2015). In contrast, lake sediments collect a large amount of OC from a wide range of sources and of complex composition (Xu et al., 2015), consequently, the potential co-metabolism effect of phytoplankton detritus and OC in sediments may be more spatially heterogeneous. With global climate warming and eutrophication, recurrent algae blooms have been frequently observed in freshwater lakes with continuous and considerable deposition onto the surface of sediments after their decay, which provides ideal conditions for the co-metabolism effect between detritus and OC in sediments (Yan et al., 2017; Qin et al., 2018). In addition, the input of residual phytoplankton also maintains sediment nutrient levels in the surrounding environment (Zhao et al., 2019). Despite experimental evidence showing that nitrogen addition increases carbon dioxide (CO2) emissions and that phosphorus (P) addition inhibits methane (CH4) emissions (Huang et al., 2019; Wang et al., 2019; Ma et al., 2020), few studies have linked the co-metabolism effect with nutrient supply and nutrient stoichiometric control in lacustrine ecosystems.
Two distinct mechanisms have been proposed in terrestrial ecosystems to explain the co-metabolism effect caused by nutrient availability and OC inputs: "microbial nutrient mining" and "stoichiometry decomposition" (Chen et al., 2014). In the former, the nutrient-acquiring microbes use input carbon as an energy source to enhance OC decomposition. That is, when the nutrient supply is low, microorganisms facilitate the acquisition of nutrients via native OC mineralization (Razanamalala et al., 2018). In contrast, the co-metabolism effect generated by "stoichiometric decomposition" theory predicts a correlation between stoichiometric C source and nutrient ratios. In other words, decomposition rates are maximized if C and nutrient inputs match microbial demands (Fang et al., 2018). Although many studies have focused on the mechanisms by which nutrient availability affects the co-metabolism effect in terrestrial ecosystems, these underlying mechanisms have not yet been validated in aquatic ecosystems.
This study aimed to reveal the exogenous organic C, nutrient input impact on co-metabolism effect of sediment OC in lacustrine ecosystems. Specifically, our objectives of this study were to (i) link nutrient availability and the co-metabolism effect and (ii) test the applicability of two associated but competing hypotheses of how nutrients affect the co-metabolism effect. Addressing these knowledge gaps is critical for improving the prediction of OC models in eutrophic lakes and for identifying labile OC and stoichiometric changes that can increase sediment OC.
2 MATERIAL AND METHOD 2.1 Field samplingTaihu Lake (30°56′N–31°33′N, 119°54′E–120°36′E) is located in the Changjiang (Yangtze) River delta in East China. It is a typical large shallow lake with an area of 2 338 km2 with a mean depth of 1.9 m (Qin et al., 2007). In recent years, large-scale cyanobacteria blooms in Taihu Lake have occurred frequently because of eutrophication, especially along the northwestern bay and shorelines, which induced a serious ecological and environmental problem (Liu et al., 2015). In September 2019, surface sediments (0– 10 cm) were sampled around Maodu Port in the west of Taihu Lake (Fig. 1) where the sediment has accumulated to a high degree by a steady stream of algae organic detritus. The sediments were air-dried and sieved to pass through 2-mm mesh. The values of TN, TP, and TOC in sediments were 3.39±0.24, 2.51±0.41, and 50.19±2.19 mg/g DW (dry weight), respectively. The TOC and TN in sediments were determined by an Element Analyzer (EA, VARIO EL, OSIC, Germany), and TP were measured by Inductively Coupled Plasma-Optical Emission Spectrometer (ICP-OES) (Ji et al., 2021).

|
| Fig.1 The sampling site in Taihu Lake |
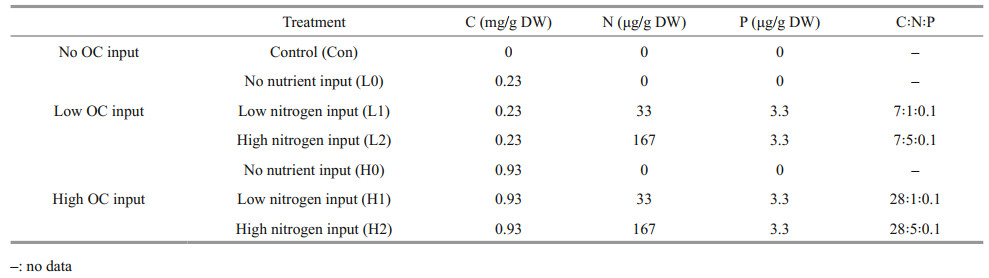
Thirty grams of dry sediment were weighed in 500-mL Schott bottles. Water was added to 2 cm above the sediment surface. All treatments were preincubated at 25 ℃. Thereafter, water or 13C-labeled glucose (10.5 atom% 13C) solution was evenly added dropwise to the sediment surface using an injector. Before the incubation, the labeled glucose was gently and uniformly mixed, and added to the sediment at two levels. This is equivalent to adding 0.23 and 0.93 mg/g DW carbon to the sediment. There were seven treatments: low and high input levels of the labeled glucose with and without two levels of nutrients and a control without nutrient and glucose inputs (Table 1). Each treatment had three replicates. All treatments were incubated at 25 ℃. The headspace gas was collected at Days 3, 7, 13, 21, 32, and 45 for total CO2-C and δ13C-CO2 analyses.
Headspace samples were collected using a 25-mL gas-tight syringe and stored in pre-evacuated 35-mL glass bottles (Yan et al., 2017). The CO2 concentrations were measured using an Agilent 7890B gas chromatograph (Agilent Technologies, Alto Palo, California, USA) equipped with flame ionization, flame photometric, electron capture detectors, and a nickel catalyst methanizer. The CO2 emission was expressed as cumulative production. In addition, the stable C isotope composition in the headspace samples was analyzed using a Picarro G2101-i CO2 cavity ring-down isotope spectroscope (Picarro Inc., Sunnyvale, California, USA).
2.4 Extracellular enzyme activitiesExtracellular enzyme activities reflect the functions of decomposer communities. Three enzymes: β-glucosidase (AG), chitinase (CH), and phosphatase (PHOS), were determined using a modified 96-well plate assay method (Bell et al., 2013). β-glucosidase is a commonly measured enzyme responsible for degrading cellulose. Chitinase is a common enzyme involved in degrading organic N compounds. Artificial substrates labeled with the methylumbelliferone fluorophore were used to estimate the activities of three enzymes involved in sediment organic C, N, and P degradation.
2.5 Sediment microbial community abundance analysisTotal genomic DNA of each sediment sample was used for DNA extraction using a soil DNA isolation kit (OMEGA Bio-tek, Inc.). DNA concentrations were measured with a spectrophotometer (Nanodrop ND- 2000; NanoDrop Technologies). The extracted DNA was stored at -20 ℃ until further analysis.
PCR amplification was conducted for Illumina MiSeq sequencing using bacterial primers. The forward primer 5′-ACTCCTACGGGAGGCA-GCA-3′ and the universal reverse primer 3′-GGACTACHVGG-GTWTCTAAT-5′ targeted the V3V4 hypervariable regions of bacterial 16S rRNA genes. PCR amplification was performed in triplicate using an ABI 2720 PCR System. The 25-μL PCR mixture contained 5 μL of 5×buffer, 5 μL of 5×GC buffer, 2 μL of dNTP (2.5 mmol/L), 1 μL of forward primer (10 μmol/L), 1 μL of reverse primer (10 μmol/L), 2 μL of DNA template, 8.75 μL of ddH2O, and 0.25 μL of Q5 DNA polymerase. Cycling parameters were as follows: initial denaturation 98 ℃ for 2 min, denaturation 98 ℃ for 15 s, annealing 55 ℃ for 30 s, extension 72 ℃ for 30 s, with a final extension of 10 min at 72 ℃. For each sample, the products of three parallel PCRs were mixed. The PCR amplicons were pooled together and purified using a PCR purification kit. The purified amplicons were merged at equal concentrations for all samples with a KAPA Library Quantification Kit. The purified amplicons were sequenced on the Illumina MiSeq platform.
2.6 Calculations and statisticsBecause of the different δ13C signatures between sediment and labeled glucose, the total CO2 emissions can be separated into sediment-derived CO2 emissions (CSOC) and glucose-derived CO2 emissions (Cglu) using the following equations (Grasset et al., 2018):
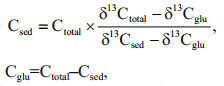
where Csed represent the CO2 derived from the glucose-treated sediment, Cglu represent the CO2 derived from added glucose, and Ctotal represent the total CO2 produced. Values of δ13Cglu in equations are δ13C values of glucose. δ13Csed in the equations was obtained from control treatment.

where CE is the intensity of the co-metabolism effect. Ccon represent the total CO2 derived from control treatment.
The repeated measures Anova test method was used to identify the differences for cumulative CO2 emissions and CE in different treatment groups by R language, version 3.5.1. Moreover, One-way ANOVAs test method was used to compare the accumulated sediment-derived CO2 emissions and glucose-derived CO2 emissions in different treatment groups at final stage. The multifactorial analysis was used to explain time, C, N, and P inputs to cumulative CE. The criteria of P < 0.05 and P < 0.01 were used to determine statistical significance at the 0.05 and 0.01 levels, respectively.
3 RESULT 3.1 Cumulative CO2 emissionsCO2 emissions from the background sediments gradually increased to 2 112.82 μg/g DW during the 45-day incubation period (Fig. 2a). The repeated measures Anova test showed that the glucose addition led to a significant increase in CO2 emissions relative to background levels (P < 0.05). High-C treatments caused 40.52% higher CO2 emissions than low-C treatments during incubation. Glucose with high nitrogen treatments led to higher CO2 emissions compared with the no nutrient treatments. By the end of incubation, both high nitrogen input treatments led to higher cumulative CO2 emissions than low nitrogen treatments. The CO2 released from each treatment increased rapidly at the beginning of the incubation and then increased slowly after 13 days. The cumulative CO2 emissions ranged from 2 112.82–3 794.23 μg/g DW. However, nutrient input significantly increased glucose-C mineralization at the high-C input level relative to the no nutrient treatment but not at low-glucose input. The cumulative CO2 driven by glucose ranged from 154.47– 793.27 μg/g DW, which was equivalent to adding 4.33%–17.70% of CO2 emissions across all treatments (Fig. 2b).

|
| Fig.2 The cumulative CO2 emissions in each treatment over time (a) and the cumulative CO2 emissions at the end of the experiment (b) Data are means of 3 replicates ±SE (n=3). Bars contained the same letter are not significantly different (P < 0.05); uppercase letters are for sediment-derived CO2 and lowercase letters for glucose-derived CO2. The orange dotted line represents the CO2 emission in the control group without glucose added. |
The percentage of CO2 emission driven by sediment and glucose during the decomposition was shown in Fig. 3a & b, respectively. The percentage of CO2 driven by glucose in each treatment continually decline over time, while the percentage of CO2 driven by sediment showed an opposite direction (Fig. 3). Noteworthily, the proportion of CO2 emission in low C treatment driven by sediment and glucose reached dynamic equilibrium around Day 13. As a contrast, similar dynamic equilibrium in high C treatment was reached in about 30 days.

|
| Fig.3 The percentage of CO2 driven by sediment (a) and CO2 driven by glucose (b) in each treatment |
All treatments with added glucose with or without nutrients had a significantly positive co-metabolism effect of sediment OC mineralization over the 45-day period (P < 0.05). The co-metabolism effect generally remained positive until the end of the experiment (except for the occurrence of negative rates on Days 7 and 13) (Fig. 4). During the first three days, the positive co-metabolism effect increased rapidly in all treatment groups and reached 34.12–258.17 μg/g DW. All treatments except for the high C and high nitrogen treatment (H2) declined to varying degrees (i.e., the rate of OC decomposition in sediments reduced). However, the positive co-metabolism effect of each group increased gradually after Day 13. By the end of incubation, the cumulative co-metabolism effect reached 178.25–888.14 μg/g DW. The positive co-metabolism effect was consistently higher at high C inputs, which was 152% more than low C inputs across the nutrient treatments. The multifactorial analysis showed that C input and time are significant positive correlation with the co-metabolism effect (P < 0.05).

|
| Fig.4 The cumulative co-metabolism effect in the low glucose treatment (a) and high glucose treatment (b) |
All treatments with added labile C at both low and high levels led to increases in the activities of all measured enzymes on Days 3, 10, and 45 (Fig. 5). The activity of β-glucosidase has no significant differences between treatments on Day 3. However, treatments with the addition of N and P were higher with the only glucose treatments on Days 10 and 45 (P < 0.05). In both high C and low C addition treatments, increasing nutrient input levels generally increased the activity of phosphatase on Day 3, but no significant differences were observed among treatments. The activity of chitinase almost continuously decreased over time, which was significantly higher in C input treatment than control treatment on Day 3 (P < 0.05).

|
| Fig.5 Activity of the extracellular enzymes β-glucosidase (a), chitinase (b), and phosphatase (c) in sediments on days 3, 10, and 45 |
The dominant phyla in this study were Proteobacteria, Firmicutes, Actinobacteria, Bacteroidetes, and Armatimonadete (Fig. 6). In treatments with low C input, Proteobacteria generally increased, especially on Day 3, and then decreased to the same level as in the high C input treatments. Furthermore, almost no Acidobacteria were observed in each treatment group on Day 3. However, the relative abundance of Acidobacteria increased over time. Although the relative abundance changed, there was no significant difference at the phylum level in each treatment.

|
| Fig.6 Bacterial community composition of the sediment layers at the phylum level |
Increases and decreases in OC decomposition upon labile C input (a readily available energy source) have been commonly observed (Löhnis, 1926; Kuzyakov et al., 2000). The recent renewed interest in this phenomenon—the priming effect—has still not penetrated many disciplines. However, it has been virtually ignored in aquatic ecosystems. As a subcomponent of priming (Bianchi, 2011), the co-metabolism effect primarily emphasized the role of microorganisms in OC decomposition, and excluded other bioprocess such as biodigestion, biodisturbance, etc. (Dai et al., 2009; Ma et al., 2020). Here, we proposed a method to evaluate the co-metabolism effect based on the end-member mixing model to calculate the fraction of CO2 from labile C added and refractory OC derived from sediment in shallow lake ecosystems.
The labile C addition caused a rapid increase in the positive co-metabolism effect at the first 7 days of incubation (Fig. 4). This increase is generally attributed to the activation of microorganisms from starvation states to active states by labile OC (Blagodatskaya and Kuzyakov, 2008). We observed enzyme production rapidly increasing during the initial stage, which caused the microbial switch from dormancy to activity (Fig. 5). Especially on Day 10, the higher β-glucosidase activity after nutrient addition, which, in turn, promoted the OC mineralization in sediments (Figs. 2 & 5a). On a time scale, the sediment OC mineralization was inhibited by glucose addition during early incubation (the first 3–13 days) (Fig. 4). This inhibition likely stems from the fact that the preference of microorganisms for substrate switched from the relatively recalcitrant OC in sediments to the available energy source, thus causing a negative co-metabolism effect (Kuzyakov and Bol, 2006; Zhu et al., 2018). Moreover, the proportion of CO2 emissions from glucose in the total emissions decreased gradually, which was attributable to microorganisms preferentially utilizing glucose (Fig. 3). However, as more glucose was consumed, the microorganisms had to utilize sediment OC, which then enhanced the co-metabolism effect (Fang et al., 2018).
Generally, the co-metabolism effect is positively correlated with OC input level (Guenet et al., 2010b; Di Lonardo et al., 2019; Lyu et al., 2019). This finding may result from the alleviation of energy limitation, thus leading to increased microbial activities and nutrient demand (Fang et al., 2018). By the end of incubation, the co-metabolism effect with high C input was almost double that at low C input, which was not proportional to the applied dose of glucose (4 times higher in the high glucose compared with the low glucose treatment) (Fig. 4). Nevertheless, several studies indicate that the occurrence of the positive co-metabolism effect requires the amount of labile OC to reach a threshold, but this threshold differs between substrates (Bastida et al., 2013; Qiao et al., 2014). In addition, if the threshold is exceeded, further addition may not lead to increases in mineralization (Bremer and Kuikman, 1994). Microbial growth has been shown to strongly depend on the quality and size of available substrates (Wang et al., 2015); however, the underlying mechanisms need to be clarified for our understanding of sediment OC decomposition and turnover in eutrophic lakes to be enhanced.
4.2 Co-metabolism effect in response to N and P additionThere is an interactive effect between labile C and nutrient input on the co-metabolism effect. We observed different impacts of nutrients on the co-metabolism effect under different C inputs, which were supported by previous study in paddy soil ecosystem (Wang et al., 2019). Under high C treatments, a significant impact of nutrients on the magnitude of the co-metabolism effect was observed. However, there was no obvious impact of nutrients on co-metabolism under low C input treatments (Fig. 4). In general, nutrient addition may induce shifts in the abundance and diversity of bacteria, extracellular enzyme activities with increasing C turnover and sediment OC mineralization (Luo et al., 2019). A study showed that nutrient input did not increase the co-metabolism effect of maize straw after a 9-day incubation period (Chen et al., 2014). This result implies that microbial growth was constrained by C availability more than by nutrient availability (Heuck et al., 2018), which is supported by the changes in enzyme activities observed in this study, especially during the initial phase (Fig. 5). Similarly, another study reported that nutrient inputs did not affect the co-metabolism effect under low-residue input levels (Fang et al., 2018).
In this study, no increase in the co-metabolism effect during the first 3–13 days was observed in all treatments except for the high C with high nitrogen treatment (Fig. 4). This finding may stem from the fact that the initial nutrients were not limited, which increased the decomposition of glucose during the early period (Kuzyakov and Bol, 2006). As available nutrients were depleted, nutrient limitation might lead to a shift in microorganisms when they degrade recalcitrant compounds in sediment OC in later stages (Kuzyakov et al., 2000). The microorganisms could then decompose more stable OC for nutrient acquisition and induce a higher mineralization of OC (positive co-metabolism effect), which is explained by the domination of "microbial nutrient mining" theory (Blagodatskaya et al., 2009). We also observed that the co-metabolism effect increased continuously in the high C with high nitrogen treatment and induced the largest co-metabolism effect by the end of the incubation period (Fig. 4), which contradicts microbial "nutrient mining" predicting a lower co-metabolism effect at higher nutrient availability (Chen et al., 2014). Another mechanism called "stoichiometric decomposition" (Craine et al., 2007) might explain the co-metabolism effect under high C levels and nutrient availability in the substrate. Differing from the "microbial nutrient mining" theory, the "stoichiometry decomposition" theory suggests that native OC decomposition can be enhanced as nutrient limitation is alleviated. Due to suficient amount of nutrients and labile C may promote the growth of microbial communities. That is, decomposition rates are increased if C and nutrient inputs match microbial demands. In our study, chitinase activity in high nitrogen with high C treatment was significantly higher than other groups during early incubation (Fig. 5), which may stimulate the growth and activity of microbial communities.
4.3 Implications for eutrophic lacustrine ecosystemsIn this study, we tested the occurrence of the co-metabolism effect in lake sediments. The availability of nutrients may lead to different co-metabolism effect mechanisms, even though decomposers can degrade sediment OC by using labile C substrate as a source of energy. The microorganisms maintained their stoichiometric responses to labile C input, indicating that the acquisition of nutrients may be constrained by the environment. Thus, the nutrient requirements of microorganisms are likely beneficial for sediment OC decomposition. In this study, a positive co-metabolism effect was also observed without nutrient addition (Fig. 4). Alternatively, the sediment microbes may be flexible and shift their elemental balance in response to such labile C input (Kuzyakov et al., 2000). Hence, the highest co-metabolism effect was observed in the high C with high nitrogen treatment.
In lacustrine ecosystems, the dramatic increase in nutrient inputs has accelerated eutrophication (Qin et al., 2019). An increase in nutrient availability further stimulates the primary production of algae in shallow lakes, making the large algae blooms during summer months increasingly severe (Shi et al., 2015; Ma et al., 2016) and resulting in the deposition of massive amounts of algae detritus (Yan et al., 2017). In this case, algae detritus may be a preferred energy source for sediment microorganisms given that it is better suited to their requirements. Such an energy source also contributes to the decomposition of recalcitrant OC (mainly macrophyte residue and humus) in sediments. This finding could also be explained by an increase in microorganism production because of labile C and the nutrient supply (Guenet et al., 2014). This positive co-metabolism effect might be common in most shallow lakes, where phytoplankton is primarily dominated by algae blooms. In addition, massive algae decomposition has also led to increases in nutrients, which may be one of the important factors underlying the self-maintenance of eutrophic lakes, such as Taihu Lake in China, especially at the northwestern shorelines. The algal blooms accumulate, decay, and release nitrogen and phosphorus (Otten et al., 2012), which might further affect the metabolism of OC in sediments. For example, with suficient C sources and nutrients, the stoichiometric ratio can be adjusted according to microbial demands, maintain activity and further facilitate OC mineralization in sediments (Fang et al., 2018). The co-metabolism effect of algae detritus and sediment OC further weakened the function of the lake sediment carbon sink. The amount of glucose added in this study was based on the accumulation of algae in the context of eutrophication lakes (Liu et al., 2017; Yan et al., 2017).
5 CONCLUSIONNew evidence indicating that different dominant mechanisms can co-exist in the same system and co-influence the strength of the co-metabolism effect, probably because the availability of labile C and nutrients in sediments can be explained by the correlation of the co-metabolism effect with key microbial variables. Compared with the low nutrient treatments, larges co-metabolism effect under high C with high nutrient treatment was observed by the end of the incubation. And in the low C treatment, the amount of nitrogen had limited impact on co-metabolism effect. Higher nutrition further promotes the decomposition of sediment OC, which should be considered in the future management of aquatic ecosystems. Considering that the occurrence intensity, frequency, and duration of algae blooms were still enhanced, this study may underestimate the co-metabolism effect in eutrophic lacustrine ecosystems.
6 DATA AVAILABILITY STATEMENTThe data that support the findings of this study are available from the corresponding author upon reasonable request.
Bastida F, Torres I F, Hernández T, et al. 2013. Can the labile carbon contribute to carbon immobilization in semiarid soils? Priming effects and microbial community dynamics. Soil Biology and Biochemistry, 57: 892-902.
DOI:10.1016/j.soilbio.2012.10.037 |
Bell C W, Fricks B E, Rocca J D, et al. 2013. High-throughput fluorometric measurement of potential soil extracellular enzyme activities. Journal of Visualized Experiments, (81): e50961.
DOI:10.3791/50961 |
Bianchi T S, Thornton D C O, Yvon-Lewis S A, et al. 2015. Positive priming of terrestrially derived dissolved organic matter in a freshwater microcosm system. Geophysical Research Letters, 42(13): 5460-5467.
DOI:10.1002/2015GL064765 |
Bianchi T S. 2011. The role of terrestrially derived organic carbon in the coastal ocean: a changing paradigm and the priming effect. Proceedings of the National Academy of Sciences of the United States of America, 108(49): 19473-19481.
DOI:10.1073/pnas.1017982108 |
Blagodatskaya E V, Blagodatsky S A, Anderson T H, et al. 2009. Contrasting effects of glucose, living roots and maize straw on microbial growth kinetics and substrate availability in soil. European Journal of Soil Science, 60(2): 186-197.
DOI:10.1111/j.1365-2389.2008.01103.x |
Blagodatskaya Е, Kuzyakov Y. 2008. Mechanisms of real and apparent priming effects and their dependence on soil microbial biomass and community structure: critical review. Biology and Fertility of Soils, 45(2): 115-131.
DOI:10.1007/s00374-008-0334-y |
Bremer E, Kuikman P. 1994. Microbial utilization of 14C[U] glucose in soil is affected by the amount and timing of glucose additions. Soil Biology and Biochemistry, 26(4): 511-517.
DOI:10.1016/0038-0717(94)90184-8 |
Chen R R, Senbayram M, Blagodatsky S, et al. 2014. Soil C and N availability determine the priming effect: microbial N mining and stoichiometric decomposition theories. Global Change Biology, 20(7): 2356-2367.
DOI:10.1111/gcb.12475 |
Cole J J, Prairie Y T, Caraco N F, et al. 2007. Plumbing the global carbon cycle: integrating inland waters into the terrestrial carbon budget. Ecosystems, 10(1): 172-185.
DOI:10.1007/s10021-006-9013-8 |
Craine J M, Morrow C, Fierer N. 2007. Microbial nitrogen limitation increases decomposition. Ecology, 88(8): 2105-2113.
DOI:10.1890/06-1847.1 |
Dai J H, Sun M Y, Culp R A, et al. 2009. A laboratory study on biochemical degradation and microbial utilization of organic matter comprising a marine diatom, land grass, and salt marsh plant in estuarine ecosystems. Aquatic Ecology, 43(4): 825-841.
DOI:10.1007/s10452-008-9211-x |
De Graaff M A, Classen A T, Castro H F, et al. 2010. Labile soil carbon inputs mediate the soil microbial community composition and plant residue decomposition rates. New Phytologist, 188(4): 1055-1064.
DOI:10.1111/j.1469-8137.2010.03427.x |
Di Lonardo D P, de Boer W, Zweers H, et al. 2019. Effect of the amount of organic trigger compounds, nitrogen and soil microbial biomass on the magnitude of priming of soil organic matter. PloS One, 14(5): e0216730.
DOI:10.1371/journal.pone.0216730 |
Fang Y Y, Nazaries L, Singh B K, et al. 2018. Microbial mechanisms of carbon priming effects revealed during the interaction of crop residue and nutrient inputs in contrasting soils. Global Change Biology, 24(7): 2775-2790.
DOI:10.1111/gcb.14154 |
Fontaine S, Bardoux G, Benest D, et al. 2004. Mechanisms of the priming effect in a Savannah soil amended with cellulose. Soil Science Society of America Journal, 68(1): 125-131.
DOI:10.2136/sssaj2004.1250 |
Grasset C, Mendonça R, Villamor Saucedo G, et al. 2018. Large but variable methane production in anoxic freshwater sediment upon addition of allochthonous and autochthonous organic matter. Limnology and Oceanography, 63(4): 1488-1501.
DOI:10.1002/lno.10786 |
Gudasz C, Bastviken D, Steger K, et al. 2010. Temperature-controlled organic carbon mineralization in lake sediments. Nature, 466(7305): 478-481.
DOI:10.1038/nature09186 |
Guenet B, Danger M, Abbadie L, et al. 2010a. Priming effect: bridging the gap between terrestrial and aquatic ecology. Ecology, 91(10): 2850-2861.
DOI:10.1890/09-1968.1 |
Guenet B, Danger M, Harrault L, et al. 2014. Fast mineralization of land-born C in inland waters: first experimental evidences of aquatic priming effect. Hydrobiologia, 721(1): 35-44.
DOI:10.1007/s10750-013-1635-1 |
Guenet B, Neill C, Bardoux G, et al. 2010b. Is there a linear relationship between priming effect intensity and the amount of organic matter input?. Applied Soil Ecology, 46(3): 436-442.
DOI:10.1016/j.apsoil.2010.09.006 |
Hanamachi Y, Hama T, Yanai T. 2008. Decomposition process of organic matter derived from freshwater phytoplankton. Limnology, 9(1): 57-69.
DOI:10.1007/s10201-007-0232-2 |
Heuck C, Weig A, Spohn M. 2018. Corrigendum to Heuck et al. (2015) 'Soil microbial biomass C: N: P stoichiometry and microbial use of organic phosphorus', Soil Biology & Biochemistry 85, 119-129. Soil Biology and Biochemistry, 127: 329-330, https://doi.org/10.1016/j.soilbio.2018.09.011.
|
Horvath R S. 1972. Microbial co-metabolism and the degradation of organic compounds in nature. Bacteriological Reviews, 36(2): 146-155.
DOI:10.1128/br.36.2.146-155.1972 |
Huang C C, Chen Z L, Gao Y, et al. 2019. Enhanced mineralization of sedimentary organic carbon induced by excess carbon from phytoplankton in a eutrophic plateau lake. Journal of Soils and Sediments, 19(5): 2613-2623.
DOI:10.1007/s11368-019-02261-2 |
Ji Z H, Long Z W, Zhang Y, et al. 2021. Enrichment differences and source apportionment of nutrients, stable isotopes, and trace metal elements in sediments of complex and fragmented wetland systems. Environmental Pollution, 289: 117852.
DOI:10.1016/j.envpol.2021.117852 |
Kuzyakov Y, Bol R. 2006. Sources and mechanisms of priming effect induced in two grassland soils amended with slurry and sugar. Soil Biology and Biochemistry, 38(4): 747-758.
DOI:10.1016/j.soilbio.2005.06.025 |
Kuzyakov Y, Friedel J K, Stahr K. 2000. Review of mechanisms and quantification of priming effects. Soil Biology and Biochemistry, 32(11-12): 1485-1498.
DOI:10.1016/S0038-0717(00)00084-5 |
Li X, Cui B S, Yang Q C, et al. 2013. Effects of plant species on macrophyte decomposition under three nutrient conditions in a eutrophic shallow lake, North China. Ecological Modelling, 252: 121-128.
DOI:10.1016/j.ecolmodel.2012.08.006 |
Liu C, Shen Q S, Zhou Q L, et al. 2015. Precontrol of algae-induced black blooms through sediment dredging at appropriate depth in a typical eutrophic shallow lake. Ecological Engineering, 77: 139-145.
DOI:10.1016/j.ecoleng.2015.01.030 |
Liu X S, Shi C F, Xu X G, et al. 2017. Spatial distributions of β-cyclocitral and β-ionone in the sediment and overlying water of the west shore of Taihu Lake. Science of the Total Environment, 579: 430-438.
DOI:10.1016/j.scitotenv.2016.11.079 |
Löhnis F. 1926. Effect of growing legumes upon succeeding crops. Soil Science, 22(5): 355-389.
DOI:10.1097/00010694-192611000-00002 |
Luo Y, Zhu Z K, Liu S L, et al. 2019. Nitrogen fertilization increases rice rhizodeposition and its stabilization in soil aggregates and the humus fraction. Plant and Soil, 445(1-2): 125-135.
DOI:10.1007/s11104-018-3833-0 |
Lyu M, Nie Y Y, Giardina C P, et al. 2019. Litter quality and site characteristics interact to affect the response of priming effect to temperature in subtropical forests. Functional Ecology, 33(11): 2226-2238.
DOI:10.1111/1365-2435.13428 |
Ma J R, Qin B Q, Paerl H W, et al. 2016. The persistence of cyanobacterial (Microcystis spp.) blooms throughout winter in Lake Taihu, China. Limnology and Oceanography, 61(2): 711-722.
DOI:10.1002/lno.10246 |
Ma J, Xu X G, Yu C C, et al. 2020. Molecular biomarkers reveal co-metabolism effect of organic detritus in eutrophic lacustrine sediments. Science of the Total Environment, 698: 134328.
DOI:10.1016/j.scitotenv.2019.134328 |
Otten T G, Xu H, Qin B, et al. 2012. Spatiotemporal patterns and ecophysiology of toxigenic Microcystis blooms in Lake Taihu, China: implications for water quality management. Environmental Science & Technology, 46(6): 3480-3488.
DOI:10.1021/es2041288 |
Phillips R P, Meier I C, Bernhardt E S, et al. 2012. Roots and fungi accelerate carbon and nitrogen cycling in forests exposed to elevated CO2. Ecology Letters, 15(9): 1042-1049.
DOI:10.1111/j.1461-0248.2012.01827.x |
Qiao N, Schaefer D, Blagodatskaya E, et al. 2014. Labile carbon retention compensates for CO2 released by priming in forest soils. Global Change Biology, 20(6): 1943-1954.
DOI:10.1111/gcb.12458 |
Qin B Q, Paerl H W, Brookes J D, et al. 2019. Why Lake Taihu continues to be plagued with cyanobacterial blooms through 10 years (2007-2017) efforts. Science Bulletin, 64(6): 354-356.
DOI:10.1016/j.scib.2019.02.008 |
Qin B Q, Xu P Z, Wu Q L, et al. 2007. Environmental issues of Lake Taihu, China. Hydrobiologia, 581(1): 3-14.
DOI:10.1007/s10750-006-0521-5 |
Qin B Q, Yang G J, Ma J R, et al. 2018. Spatiotemporal changes of cyanobacterial bloom in large shallow eutrophic lake Taihu, China. Frontiers in Microbiology, 9: 451.
DOI:10.3389/fmicb.2018.00451 |
Razanamalala K, Fanomezana R A, Razafimbelo T, et al. 2018. The priming effect generated by stoichiometric decomposition and nutrient mining in cultivated tropical soils: actors and drivers. Applied Soil Ecology, 126: 21-33.
DOI:10.1016/j.apsoil.2018.02.008 |
Scheffer M, Carpenter S, Foley J A, et al. 2001. Catastrophic shifts in ecosystems. Nature, 413(6856): 591-596.
DOI:10.1038/35098000 |
Scheffer M, Hosper S H, Meijer M L, et al. 1993. Alternative equilibria in shallow lakes. Trends in Ecology & Evolution, 8(8): 275-279.
DOI:10.1016/0169-5347(93)90254-M |
Shi K, Zhang Y L, Xu H, et al. 2015. Long-term satellite observations of microcystin concentrations in Lake Taihu during cyanobacterial bloom periods. Environmental Science & Technology, 49(11): 6448-6456.
DOI:10.1021/es505901a |
Sobek S, Durisch-Kaiser E, Zurbrügg R, et al. 2009. Organic carbon burial efficiency in lake sediments controlled by oxygen exposure time and sediment source. Limnology and Oceanography, 54(6): 2243-2254.
DOI:10.4319/lo.2009.54.6.2243 |
Van Nugteren P, Moodley L, Brummer G J, et al. 2009. Seafloor ecosystem functioning: the importance of organic matter priming. Marine Biology, 156(11): 2277-2287.
DOI:10.1007/s00227-009-1255-5 |
Wakeham S G, Canuel E A. 2006. Degradation and preservation of organic matter in marine sediments. In: Volkman J K ed. Marine Organic Matter: Biomarkers, Isotopes and DNA. Springer, Berlin Heidelberg. p.295-321, https://doi.org/10.1016/j.soilbio.2018.09.011.
|
Wang D D, Zhu Z K, Shahbaz M, et al. 2019. Split N and P addition decreases straw mineralization and the priming effect of a paddy soil: a 100-day incubation experiment. Biology and Fertility of Soils, 55(7): 701-712.
DOI:10.1007/s00374-019-01383-6 |
Wang H, Boutton T W, Xu W H, et al. 2015. Quality of fresh organic matter affects priming of soil organic matter and substrate utilization patterns of microbes. Scientific Reports, 5(1): 10102.
DOI:10.1038/srep10102 |
Xu X G, Li W, Fujibayashi M, et al. 2015. Predominance of terrestrial organic matter in sediments from a cyanobacteria-blooming hypereutrophic lake. Ecological Indicators, 50: 35-43.
DOI:10.1016/j.ecolind.2014.10.020 |
Yan X C, Xu X G, Wang M Y, et al. 2017. Climate warming and cyanobacteria blooms: looks at their relationships from a new perspective. Water Research, 125: 449-457.
DOI:10.1016/j.watres.2017.09.008 |
Zhao Y P, Zhang Z Q, Wang G X, et al. 2019. High sulfide production induced by algae decomposition and its potential stimulation to phosphorus mobility in sediment. Science of the Total Environment, 650: 163-172.
DOI:10.1016/j.scitotenv.2018.09.010 |
Zhu Z K, Ge T D, Luo Y, et al. 2018. Microbial stoichiometric flexibility regulates rice straw mineralization and its priming effect in paddy soil. Soil Biology and Biochemistry, 121: 67-76.
DOI:10.1016/j.soilbio.2018.03.003 |