 2022, Vol. 40
Institute of Oceanology, Chinese Academy of Sciences
Article Information
- WANG Xianzhe, HAN Xingye, GE Hongmei
- Effect of light intensity on bound EPS characteristics of two Microcystis morphospecies: the role of bEPS in the proliferation of Microcystis
- Journal of Oceanology and Limnology, 40(5): 1706-1719
- http://dx.doi.org/10.1007/s00343-022-1362-4
Article History
- Received Oct. 30, 2021
- accepted in principle Jan. 4, 2022
- accepted for publication Apr. 28, 2022


2 Hubei Key Laboratory of Ecological Restoration for River-Lakes and Algal Utilization, Wuhan 430068, China
Cyanobacterial blooms result in disastrous ecosystem effects and degrade the water quality in drinking water, recreation, fisheries, and human health (Huisman et al., 2018). Microcystis, one of the most cosmopolitan genera of bloom-forming cyanobacteria, has been found in at least 108 countries worldwide (Harke et al., 2016). Colony formation could provide Microcystis with many ecological advantages, including sustained growth under poor nutrient condition, adaption to varying light, protection from grazing, and chemical stressor grazing (Yamamoto et al., 2011; Gan et al., 2012; Li et al., 2016; Xiao et al., 2018). Thus, the colony formation of Microcystis is regarded as a contributor to bloom formation and the competitive success of this genus in freshwater ecosystems (Yamamoto et al., 2011; Tan et al., 2020).
The extracellular polymeric substances(EPS) of cyanobacteria are mainly composed of polysaccharides, proteins, amino acids, and humic substances. The contents and compositions of EPS were reported to play an important role in the proliferation of Microcystis through processes, such as cell adhesion and aggregation (Yang et al., 2008; Xiao et al., 2017). Therefore, insights into EPS characterization are very crucial for an enhanced understanding on the growth, competitive advantages, and proliferation of Microcystis.
The EPS of Microcystis could be divided into soluble EPS (SL-EPS) released into the surrounding environment and bound EPS (bEPS) associated with the cell surface. bEPS exhibit a dynamic double-layered structure (Yang et al., 2008; Qu et al., 2012), and they could be further distinguished into loosely bound EPS (LB-EPS) and tightly bound EPS (TB-EPS) (Li and Yang, 2007; Sheng et al., 2010; Xu et al., 2010). These two types are the main contributor to the size and tightness of Microcystis colonies (Li et al., 2013; Tan et al., 2020). Cyanobacterial EPS contain charged groups, such as sulphate groups, uronic acids, hydroxyl, amine, and carboxylic groups, which are all essential for determining their binding capacity, biomineralization, and adhesion properties (Dittrich and Sibler, 2005; Pokrovsky et al., 2008). The electrostatic or hydrophobicity interactions on the surface are the main adhesion mechanism of cell surfaces, and they could be presented by zeta potential and hydrophobicity, respectively (Sirmerova et al., 2013). Recently, protein- and humic acid-like substances have been found in EPS (Xu et al., 2013a; Xiao et al., 2019). Xu et al. (2013a) found that tryptophan- and humic-like substances were associated with the growth of Microcystis aeruginosa. Xiao et al. (2019) reported that humic acid-like components were involved in the colony formation and colony-size growth of Microcystis.
The light in photoautotrophic metabolism is the energy provider for cyanobacterial growth. Changes in light quality, light intensity, and light/dark cycles have a significant influence on the production of cyanobacterial EPS (Ge et al., 2014; Han et al., 2015; Xu et al., 2016; Cruz et al., 2020). Continuous light and high light intensities are generally favorable for EPS production (Ge et al., 2014; Han et al., 2015). Some studies found that low light intensity is a good strategy to increase EPS production. In addition, light intensities could significantly affect the contents of protein and polysaccharides in EPS (Phélippé et al., 2019). However, how light intensity affects the EPS characterization of Microcystis is yet to be fully understood.
Nutrient concentrations, species density, light, temperature, allelopathy, and dissolved organic/inorganic compounds affect Microcystis species competition (Zhai et al., 2013; Yue et al., 2014; Xu et al., 2016). Recent studies focused on the influence of zeta potential on Microcystis species competition in Taihu Lake, China (Liu et al., 2016). Some evidence indicated that zeta potential could be used as a good index for cell surface characterization and to study Microcystis colony formation (Liu et al., 2016; Tan et al., 2020). The specific composition of EPS could be determined by fluorescence excitation-emission matrix (EEM) spectroscopy. In aquatic environments, Microcystis is exposed to a changing light environment due to mixing events and the vertical migration controlled by its buoyancy regulation (Walsby et al., 1997; Huisman et al., 2004). Microcystis aeruginosa and Microcystis flos-aquae are common dominant bloom morphospecies in Taihu Lake, China. They are the predominant species in May, June, July, and November among different long-term sampling sites, while M. aeruginosa is more dominant than M. flos-aquae in June and July (Chen et al., 2009). However, the response of growth and proliferation of M. aeruginosa and M. flos-aquae to changing light intensities is yet to be fully understood. Therefore, in this paper, the growth, composition, hydrophobicity, and zeta potential of bEPS from M. aeruginosa and M. flos-aquae were investigated under different light intensities to provide a new perspective on the role of bEPS in Microcystis proliferation.
2 MATERIAL AND METHOD 2.1 Algal species and culture conditionsUnicellular cyanobacteria M. aeruginosa (FACHB-905) and M. flos-aquae (FACHB-1344) were purchased from the Institute of Hydrobiology, Chinese Academy of Sciences. The algal solution was placed in a conical flask and cultured in BG-11 medium (Stanier et al., 1971) under the conditions of incandescent lamp illumination of 40-μE/(m2·s) light intensity with the light: dark cycle of 12 h: 12 h at 25 ℃. Before culture, the required glassware medium was sterilized at 121 ℃ for 30 min.
Cells in the exponential growth phase were diluted with BG11 medium to achieve an initial cell density of approximately 5×10⁶ cells/mL. Experiments were carried out at light intensities of 10, 35, 70, and 105 μE/(m2·s) on a 12-h: 12-h light: dark cycle at the temperature of 25 ℃±1 ℃. All strains were cultured in triplicate and maintained in 250-mL Erlenmeyer flasks containing 200 mL of sterilized BG-11 medium. The initial pH of the BG-11 medium was adjusted to 7.2. All the flasks were shaken by hand two times every day to maintain culture homogeneity.
2.2 Growth measurement and morphological observationsGrowth was measured at 1-day interval in terms of cell numbers. The cells were counted using a blood-cell counting chamber (Wang et al., 2010). For the specific growth rate (μ) of M. aeruginosa and M. flos-aquae at different light intensities was calculated according to the method described by Xu et al. (2016). The diameter of the two Microcystis morphospecies at the mid-logarithmic growth phase was also observed by transmission electron microscopy (TEM, Hitachi H-7000FA). For TEM observation, samples were processed as described by Chen et al. (2019). First, samples were fixed with 3% glutaraldehyde in cacodylate buffer and then fixated in 1% osmium tetroxide. Second, the samples were dehydrated in graded ethanol (30%, 50%, 70%, 90%, 95%, and 100%) and then implanted with Epon resin. Last, ultrathin sections were sliced with a diamond knife and stained with 3% uranyl acetate and lead citrate. Thirty measurements of each strain diameter were carried on individual cells to compare the size of the two Microcystis species.
2.3 Maximal chlorophyll fluorescence of photosystem II (PSII) (Fv/Fm) measurementChlorophyll fluorescence was measured using a pulse amplitude modulated fluorometer (WATER-PAM, Walz, Germany). The two Microcystis species were dark adapted for 10 min before determining the fluorescence parameter Fv/Fm. The saturating light pulse was 1 500 μE/(m2·s).
2.4 bEPS extraction and measurementbEPS extraction was performed in accordance with the method reported by Xu et al. (2013a). First, samples (10 mL) were centrifuged at 2 500×g for 15 min, and the supernatant was removed. Second, the harvested algal samples were suspended in 0.05% NaCl solution and centrifuged at 5 000×g for 15 min. The supernatant was collected carefully to measure LB-EPS. Third, the remaining algae samples were resuspended in 0.05% NaCl solution and then heated at 60 ℃ for 30 min. The extracted solutions were centrifuged at 15 000×g for 20 min, with the supernatant as the TB-EPS fraction. Finally, all the EPS fractions were filtered out using a 0.45- m polytetrafluoroethylene (PTFE) membrane. The polysaccharide contents of bEPS were measured by phenol sulfuric acid method (Dubois et al., 1956), using glucose as the standard. The protein contents in bEPS were measured via Bradford method (Bradford, 1976), and the standard curve was constructed using bovine serum albumin.
2.5 Fluorescence EEM determinationThe bEPS extracted by the above method at day 20 was used for fluorescence EEM spectrum analysis. Fluorescence EEM was measured using a Thermo Scientific Lumina fluorescence spectrometer (Thermo Fisher Scientific, USA) in scan mode with a 700-voltage xenon lamp at room temperature (25±1 ℃). The EEM spectra were used with scanning emission (Em) spectra from 250 nm to 550 nm at 2-nm increments, and the excitation (Ex) wavelengths were set from 200 nm to 450 nm at 10-nm increments. The spectra were recorded at a scan rate of 1 200 nm/min, and the slit bandwidths of Ex and Em were both 5 nm (Xu et al., 2013a). Blank scans were performed using Milli-Q water.
2.6 Hydrophobicity analysisThe hydrophobicity of the cell surface was determined by bacterial-adhesion-to-hydrocarbon method (Fattom and Shilo, 1984). Cultured algal suspension at day 20 was harvested directly, with centrifugation of 12 000×g for 15 min. Then, the algal cells were washed twice with phosphate-buffered saline (PBS, 10 mmol/L, pH 7.2) and suspended in PBS until the optical density at 560 nm (OD560) was about 0.9. A volume of 2 mL of xylene was added to 5 mL of cell suspension. The two-phase system was vortexed for 1 min and settled for 10 min. The OD560 of the lower aqueous phase was determined. The hydrophobicity of the algal solution is expressed as follows:
 (1)
(1)where H refers to hydrophobicity, ODi represents the initial algal solution OD560, and ODf represents the final algal solution OD560.
2.7 Zeta potential analysisIn this study, a laser particle sizer and a zeta potentiometer (NanoBrook ZetaPlus US) were used to determine the zeta potentials of the two types of bEPS (pH 7.0) and Microcystis cells (pH 7.0) at 25℃. 50 mL of cultured algal suspension at 20 days was used to extract bEPS, and the bEPS extraction was performed as above. Finally, the supernatants containing bEPS were dialyzed using the method reported by Ge et al. (2014). The zeta potentials of the two types of bEPS were determined. The zeta potential of Microcystis cells were performed according to Hadjoudja et al. (2010). A volume of 25 mL of algal suspension at day 20 was harvested with centrifugation of 10 000×g for 10 min and resuspended in 15 mL of 0.1-mol/L NaNO3. The cell suspensions were used to determine the zeta potential of Microcystis cells. All measurements were carried out in triplicate.
2.8 Data analysisData were expressed as mean±standard deviation (SD). The significant differences among treatments were analyzed by ANOVA using Tukey's post-hoc test on SPSS 26.0. P < 0.05 was considered significant difference, while P < 0.01 indicated extremely significant difference. Graphs were carried out on Origin 18.0.
3 RESULT 3.1 Growth of the two Microcystis species at different light intensitiesFigure 1 shows the growth curve of the two Microcystis species at different light intensities. Along with prolongation of the culture time, the growth of M. aeruginosa was significantly higher than that of M. flos-aquae under the selected light intensities (P < 0.05). The growth of the two species was the slowest at 10 μE/(m2·s) (P < 0.01), while that at 105 μE/(m2·s) was slightly higher than that under 10 μE/(m2·s) (P < 0.01; Fig. 1). M. aeruginosa had the highest growth at 70 μE/(m2·s) (P < 0.05), with the ultimate algal density of 3.59×10⁷ cells/mL (Fig. 1a). M. flos-aquae had the maximum value at 35 μE/(m2·s) (P < 0.05), with the ultimate algae density of 2.72×10⁷ cells/mL (Fig. 1b). However, the two species exhibited significant growth inhibition at 105 μE/(m2·s) (P < 0.05; Fig. 1). Moreover, 10 μE/(m2·s) had a negligible effect on the growth of M. flos-aquae before 14 days.

|
| Fig.1 The growth curve of the two Microcystis species at different light intensities |
Figure 2 shows the diameter of the two Microcystis species at the mid-logarithmic growth phase. M. aeruginosa and M. flos-aquae were 2.66±0.4 and 1.49±0.3 μm in diameter, respectively (Fig. 2a–b). The diameter of M. aeruginosa was larger than that of M. flos-aquae (P < 0.05).

|
| Fig.2 TEM images of the two Microcystis species at the mid-logarithmic growth phase in BG11 medium |
The maximum photochemical yield of PSII, represented by Fv/Fm, all decreased with increasing light intensity, except at 10 μE/(m2·s) in M. aeruginosa (Fig. 3a). As shown in Fig. 3, the Fv/Fm of M. flos-aquae was obviously higher than that of M. aeruginosa in 70 μE/(m2·s) after 8 days (P < 0.05). The Fv/Fm of M. aeruginosa was obviously higher than that of M. flos-aquae in 35 μE/(m2·s) after 4 days (P < 0.01). However, the Fv/Fm between the two species did not exhibit obvious differences at 105 μE/(m2·s) (P > 0.05, Fig. 3a–b).

|
| Fig.3 The Fv/Fm of the two Microcystis species at different light intensities |
All changes in the polysaccharide contents in bEPS of the two species are depicted in Fig. 4. The polysaccharide contents in the LB-EPS, TB-EPS, and bEPS of the two Microcystis species showed an obvious decrease under all light intensities with incubation time. The polysaccharide contents in the TB-EPS or bEPS of M. aeruginosa increased with increasing light intensity, except at 105 μE/(m2·s) (Fig. 4b & e). In M. flos-aquae, the polysaccharide contents of TB-EPS or bEPS showed no obvious interspecific variation under different light intensities (P > 0.05; Fig. 4d & f). In addition, the polysaccharide content in TB-EPS was higher over time than that in the LB-EPS of M. aeruginosa at the same light intensity (P < 0.01; Fig. 4a–b). However, the polysaccharide contents between LB-EPS and TB-EPS in M. flos-aquae did not show significant differences at the same light intensity (P > 0.05; Fig. 4c–d). As shown in Fig. 4, after 4 days of culture, the polysaccharide contents in the TB-EPS or bEPS of M. aeruginosa were obviously higher than those of M. flos-aquae at each light intensity (P < 0.05). However, the polysaccharide contents of LB-EPS between the two species did not exhibit obvious differences after 8 days (P > 0.05; Fig. 4a & c). Furthermore, Fig. 4c shows that the polysaccharide contents in the LB-EPS of M. flos-aquae was the highest under 10 μE/(m2·s) of light intensity after 16 days (P < 0.01).

|
| Fig.4 Variations of polysaccharides in bEPS of the two Microcystis species at different light intensities |
The changes in the protein contents of bEPS are depicted in Fig. 5. The proteins in the LB-EPS or TB-EPS of M. aeruginosa were higher than those in M. flos-aquae (P < 0.01) under the selected culture conditions. Figure 5a shows that the protein contents in the TB-EPS of M. aeruginosa were significantly higher than those in LB-EPS under different light intensities (P < 0.01). However, in M. flos-aquae, the opposite rule was observed. In particular, the protein contents in TB-EPS were significantly lower than those in LB-EPS at each light intensity (P < 0.01).

|
| Fig.5 Proteins contents in bEPS of the two Microcystis species at different light intensities |
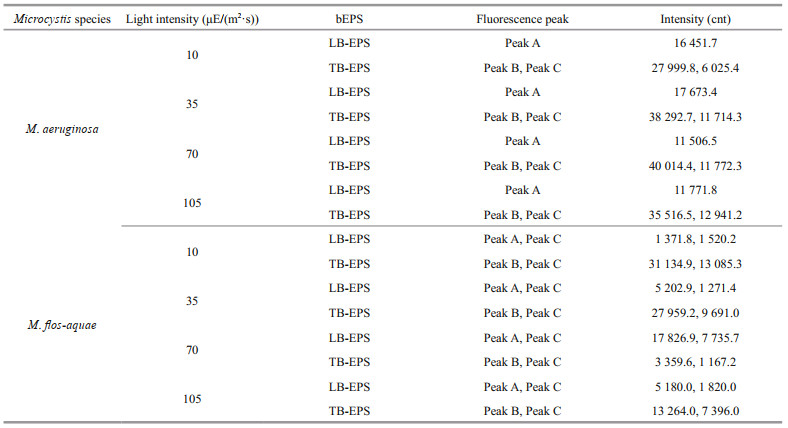
In this study, 16 fluorescence EEM spectra of bEPS from M. aeruginosa and M. flos-aquae were obtained at different light intensities at day 20 (Figs. 6–7). The fluorescence EEM spectra of the two Microcystis bEPS contained three fluorescence components. Here, peak A (Ex/Em=270–280/332–340 nm) is composed of protein-like substances (Dainard et al., 2015), peak B (290/354–360) are tryptophan-like substances (Amaral et al., 2020), and peak C (320–370/420–450) consists of humic acid-like substance (Chen et al., 2018), which may be derived from the decomposition of macromolecular organics, such as dead cells or proteins (Parlanti et al., 2000).

|
| Fig.6 Typical EEM contours of different bEPS fractions at different light intensities for M. aeruginosa Specifically, peaks A, B, and C were located at Ex/Em of 270-280/332-340, 290/354-360, and 320-370/420-450 nm, respectively. |

|
| Fig.7 Typical EEM contours of different bEPS fractions at different light intensities for M. flos-aquae Specifically, peaks A, B, and C were located at Ex/Em of 270-280/332-340, 290/354-360, and 320-370/420-450 nm, respectively. |
In this study, the EEM contours of different bEPS fractions from each strain at different light intensities were almost the same, but the light intensity significantly affected the fluorescence intensities of the peaks of different EPS fractions for the two strains (Figs. 6–7). The LB-EPS of M. aeruginosa contained peak A (Fig. 6a, c, e, & g) at different light intensities, and another peak C was detected in the LB-EPS of M. flos-aquae (Fig. 7a, c, e, & g). The TB-EPS of both strains contained the same peak, that is, they contained peaks B and C (Figs. 6–7).
As shown in Table 1, the fluorescence intensity of peak B (tryptophan-like substances) in the TB-EPS of M. aeruginosa were significantly higher than those of M. flos-aquae when the light intensity was higher than 10 μE/(m2·s). With the increase in light intensity, the fluorescence intensity of peak B (tryptophan-like substances) in the TB-EPS of M. aeruginosa gradually became stronger than before, whereas that of peak B (tryptophan-like substances) in the TB-EPS of M. flos-aquae weakened (Table 1).
|
The zeta potentials of bEPS and Microcystis cells from the two Microcystis species at different light intensities (pH 7.0) are shown in Fig. 8. The absolute values of the zeta potential of LB-EPS in M.aeruginosa were higher than those of TB-EPS under different light intensities (P < 0.01). In M. flos-aquae, the opposite rule was observed, that is, the absolute values of the zeta potential of LB-EPS at each light intensity were all lower than those of TB-EPS (P < 0.01). The absolute values of the zeta potential of TB-EPS in M. aeruginosa increased with increasing light intensity (P < 0.05), except at 105 μE/(m2·s) (Fig. 8a). And the absolute zeta values of LB-EPS in M. aeruginosa at 10 and 105 μE/(m2·s) were the same (P > 0.05), and those at 35 and 70 μE/(m2·s) were almost similar (P > 0.05). Moreover, the former was lower than the latter (P < 0.05; Fig. 8a). Figure 8b also shows that in M. flos-aquae, the absolute values of the zeta potential of the two bEPS types all increased with increasing light intensity (P < 0.01), except those in 35 and 70 μE/(m2·s), which were the same (P > 0.05). As shown in Fig. 8, the absolute values of the zeta potential of M. aeruginosa increased with increasing light intensity when the light intensity was higher than 35 μE/(m2·s) (P < 0.01; Fig. 8a). In M. flos-aquae, the absolute values of the zeta potential showed no exhibit obvious differences under different light intensities (P > 0.05; Fig. 8b). Comparison showed that the absolute values of the zeta potential of LB-EPS or Microcystis cells in M. aeruginosa were higher than those in M. flos-aquae at each light intensity (P < 0.05; Fig. 8).

|
| Fig.8 Changes in zeta potentials of bEPS and Microcystis cells from the two Microcystis species at different light intensities |
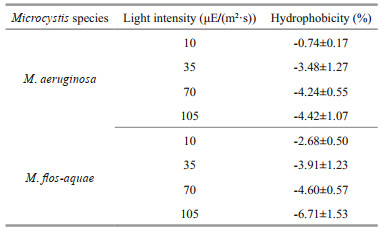
Table 2 shows the hydrophobicity of the two Microcystis species at different light intensities. For M. aeruginosa and M. flos-aquae, the hydrophobicity on the cell surface was all negative, indicating that the surface of Microcystis cells in culture is hydrophilic. These results were in good agreement with the results reported by Yang et al. (2011).
|
Previous studies have shown that growth (Li et al., 2013; Ge et al., 2014) and photosynthetic activity (Rousso et al., 2021) enhanced with the gradually increased light intensity, but intense light may inhibit the growth (Trabelsi et al., 2009) and photosynthetic activity (Meneghesso et al., 2016; Rousso et al., 2021). A similar correlation was observed in the current study, confirming that light availability was the key factor affecting growth and maximal chlorophyll fluorescence of PSII (Fv/Fm). Moreover, the present study revealed a negligible effect of the lowest light intensity on the growth of M. flos-aquae before 14 days, which is consistent with the highest Fv/Fm of M. flos-aquae. Similar results were also found for eukaryotic alga Nannochloropsis grown at intensities of 10, 100, and 1 000 μE/(m2·s) (Meneghesso et al., 2016). These phenomena can be explained by the increase in large antennae by cells to capture light under dim light (Müller et al., 2001; Straka and Rittmann, 2017) or the increase in capacity for non-photochemical quenching of chlorophyll fluorescence under abundant or excessive light (Straka and Rittmann, 2018).
4.2 Relationship between EPS and growthEPS affects the stickiness of cell surface, and EPS adhesion among individual cells may contribute to forming large colonies. In general, EPS production is enhanced by high light intensities (Yang et al., 2012; Ge et al., 2014; Xu et al., 2016). A similar correlation was observed in the present study of M. aeruginosa. However, for M. fl os-aquae, the light intensity did not significantly affect the amounts of LB-EPS, TB-EPS, and bEPS. The difference in EPS production between various strains of Microcystis may be attributed to the difference in photosynthetic carbon fixation and the utilization effciency or carbon balance control ability between species (Otero and Vincenzini, 2003; Yang and Kong, 2013). M. fl os-aquae may secrete SL-EPS into the media. TB-EPS contributed to the formation of tight Microcystis aggregates, and LB-EPS played an important role in the subsequent development from aggregates to mucilaginous colonies (Tan et al., 2020). In the present study, the TB-EPS or bEPS contents of M. aeruginosa were higher than those of M. fl os-aquae under selected light intensities, indicating that M. aeruginosa may proliferate more quickly than M. fl os-aquae at certain light intensities.
Many previous studies revealed that the optimizing biomass differs from that for EPS production (Xu et al., 2016; Chen et al., 2019). For Microcystis, previous studies demonstrated that high EPS content and colony formation were associated with low specific growth rate (Li et al., 2013; Xu et al., 2016; Chen et al., 2019). By contrast, in the present study, the TB-EPS or bEPS of M. aeruginosa was shown to produce high contents whilst maintaining corresponding high growth compared with that corresponding to 10 μE/(m2·s) conditions. Similar results were also found for cyanobacterium Nostoc flagelliforme culture in white light (Han et al., 2017). Temperature had an obvious effect on the growth of M. aeruginosa, and a twofold interaction was found with light intensity at 80 μE/(m2·s). Growth increased with increased temperature, whereas at 35 μE/(m2·s), growth decreased with increased temperature. However, temperature did not influence the polysaccharide content of M. aeruginosa at these two light-intensity conditions (Yang et al., 2012). In this study, the contents of TB-EPS or bEPS in M. flos-aquae did not change with the increase in growth at each light intensity. A previous study found that no correlation could be established between cell growth and EPS production for cultures grown at 30 ℃/50 μE/(m2·s) and 35 ℃/115 μE/(m2·s) (Trabelsi et al., 2009). These results further indicated that cell growth and EPS production are highly dependent on the algal physiological properties and the culture conditions. Furthermore, M. aeruginosa could produce more EPS whilst maintaining corresponding high growth at each light intensity than M. flos-aquae, possibly conducive to its competitive advantage.
4.3 The role of organic compositions of bEPSLow nutrient medium (1/7 of N and P contents of BG11 medium), linoleic acid (LA), and LA sustained-release microspheres did not affect the EEM contours of different EPS fractions in M. aeruginosa FACHB-905 (Xu et al., 2013a; Ni et al., 2017). However, the fluorescence intensities of the peaks of different EPS fractions were significantly different among the treatments (Ni et al., 2017). A similar phenomenon was found in the present study. In particular, the light intensity did not affect the organic compositions of bEPS but significantly affected the fluorescence intensities of the peaks of different EPS fractions for the two strains. Tryptophan can absorb ultraviolet (UV) radiation and help cells avoid acute cellular damage. In addition, tryptophan is one precursor to the synthesis of scytonemin absorbing UV. Therefore, the existence of tryptophan-like substances in EPS could help cells resist UV radiation damage (Xu et al., 2013a; Wang et al., 2020). The intensities of peak B (tryptophan-like substances) increased with increasing light intensities in M. aeruginosa, indicating that M. aeruginosa could adapt to high light environment conditions. On the contrary, they decreased with increasing light intensities in M. flos-aquae, indicating that M. flos-aquae is easily dominant in water with slightly lower light intensity. The intensities of peak B (tryptophan-like substances) in the TB-EPS from M. aeruginosa were stronger than those from M. flos-aquae when the light intensity was higher than 10 μE/(m2·s), suggesting that M. aeruginosa could more easily survive on the surface of eutrophic freshwater systems than M. flos-aquae at higher light intensities.
4.4 Effect of light intensity on the zeta potential of the bEPS and Microcystis cellsZeta potential is closely related to the charges on cell surface. Cyanobacterial EPS are mainly composed of high-molecular-mass heteropolysaccharides, and they have multiple functional groups. Thus, cell surface properties could be determined by EPS (Tan et al., 2020) through polymer bridging (Vogelaar et al., 2005) and electrostatic binding (Liu and Fang, 2002). The value of zeta potential reflects the degree of repulsion force between similarly charged particles. Thus, the zeta potential of EPS needs to be studied to well understand the mechanism of Microcystis colony formation. The values of zeta potential of the LB-EPS, TB-EPS, and Microcystis cells in the two strains were negative at pH 7.0 in this study, consistent with the report of Tan et al. (2020) for Microcystis wesenbergii. This finding suggested that the Microcystis cell surface carries negative charges. Tan et al. (2020) found that the zeta potential changed with the thickness of bound EPS on the cell surface. The absolute value of the zeta potential of the retaining group (with higher EPS content and larger colony size) was higher than that of the stripped group (with lower EPS content and lower colony size) at low calcium concentration (≤20 mg/L). However, when the calcium concentration was more than 20 mg/L, the absolute value of the zeta potential of the retaining group was lower than that of the stripped group (Tan et al., 2020). In the present study, the absolute values of the zeta potential of TB-EPS in the two species all increased with increasing light intensities, except the absolute values of the zeta potential of TB-EPS in M. aeruginosa at 105 μE/(m2·s). And the absolute values of the zeta potential of M. aeruginosa increased with rising light intensity when the light intensity was higher than 35 μE/(m2·s). These results may be due to the changes in the composition and contents of polysaccharide and protein in bEPS, further indicating that the lower the light intensity, the smaller electrostatic repulsion between Microcystis cells. Previous studies have shown that limiting nutrient supplies facilitated Microcystis spp. growth (Xu et al., 2013b), and higher absolute zeta potential allowed Microcystis to absorb more nutrients (Liu et al., 2016). In the present study, the absolute values of the zeta potential of M. aeruginosa were higher than those of M. fl os-aquae at each light intensity, suggesting that these cells carried relatively higher negative charge than M. fl os-aquae cells, thus allowing the absorption of additional iron ions or other cations. Compared with M. fl os-aquae, increased absorption of cations in the light intensity range could also be beneficial for M. aeruginosa proliferation.
5 CONCLUSIONThe bEPS characterization of two bloom-forming Microcystis in Taihu Lake, China, at different light intensities was studied. The growth and contents of the TB-EPS, bEPS, and tryptophan-like substances in M. aeruginosa were higher than those in M. flos-aquae when the light intensity was higher than 10 μE/(m2·s). The absolute values of the zeta potential of M. aeruginosa were higher than those of M. flos-aquae at each light intensity. All these results indicated that M. aeruginosa may more quickly proliferate than M. flos-aquae through increased negative charges, bEPS contents, growth, and tryptophan-like substance contents at certain light intensities. This study provides new insights on the role of bEPS in the proliferation of Microcystis.
6 DATA AVAILABILITY STATEMENTThe datasets generated and analyzed during the current study are available from the corresponding author on reasonable request.
Amaral V, Romera-Castillo C, García-Delgado M, et al. 2020. Distribution of dissolved organic matter in estuaries of the southern Iberian Atlantic Basin: sources, behavior and export to the coastal zone. Marine Chemistry, 226: 103857.
DOI:10.1016/j.marchem.2020.103857 |
Bradford M M. 1976. A rapid and sensitive method for the quantitation of microgram quantities of protein utilizing the principle of protein-dye binding. Analytical Biochemistry, 72(1-2): 248-254.
DOI:10.1016/0003-2697(76)90527-3 |
Chen B F, Huang W, Ma S Z, et al. 2018. Characterization of chromophoric dissolved organic matter in the littoral zones of eutrophic lakes Taihu and Hongze during the algal bloom season. Water, 10(7): 861.
DOI:10.3390/w10070861 |
Chen M, Tian L L, Ren C Y, et al. 2019. Extracellular polysaccharide synthesis in a bloom-forming strain of Microcystis aeruginosa: implications for colonization and buoyancy. Scientific Reports, 9(1): 1251.
DOI:10.1038/s41598-018-37398-6 |
Chen W, Peng L, Wan N, et al. 2009. Mechanism study on the frequent variations of cell-bound microcystins in cyanobacterial blooms in lake Taihu: implications for water quality monitoring and assessments. Chemosphere, 77(11): 1585-1593.
DOI:10.1016/j.chemosphere.2009.09.037 |
Cruz D, Vasconcelos V, Pierre G, et al. 2020. Exopolysaccharides from cyanobacteria: strategies for bioprocess development. Applied Sciences, 10(11): 3763.
DOI:10.3390/app10113763 |
Dainard P G, Guéguen C, McDonald N, et al. 2015. Photobleaching of fluorescent dissolved organic matter in Beaufort Sea and North Atlantic subtropical Gyre. Marine Chemistry, 177: 630-637.
DOI:10.1016/j.marchem.2015.10.004 |
Dittrich M, Sibler S. 2005. Cell surface groups of two picocyanobacteria strains studied by zeta potential investigations, potentiometric titration, and infrared spectroscopy. Journal of Colloid and Interface Science, 286(2): 487-495.
DOI:10.1016/j.jcis.2005.01.029 |
DuBois M, Gilles K A, Hamilton J K, et al. 1956. Colorimetric method for determination of sugars and related substances. Analytical Chemistry, 28(3): 350-356.
DOI:10.1021/ac60111a017 |
Fattom A, Shilo M. 1984. Hydrophobicity as an adhesion mechanism of benthic cyanobacteria. Applied and Environmental Microbiology, 47(1): 135-143.
DOI:10.1128/aem.47.1.135-143.1984 |
Gan N Q, Xiao Y, Zhu L, et al. 2012. The role of microcystins in maintaining colonies of bloom-forming Microcystis spp. Environmental Microbiology, 14(3): 730-742.
DOI:10.1111/j.1462-2920.2011.02624.x |
Ge H M, Zhang J, Zhou X P, et al. 2014. Effects of light intensity on components and topographical structures of extracellular polymeric substances from Microcoleus vaginatus (Cyanophyceae). Phycologia, 53(2): 167-173.
DOI:10.2216/13-163.1 |
Hadjoudja S, Deluchat V, Baudu M. 2010. Cell surface characterisation of Microcystis aeruginosa and Chlorella vulgaris. Journal of Colloid and Interface Science, 342(2): 293-299.
DOI:10.1016/j.jcis.2009.10.078 |
Han P P, Shen S G, Wang H Y, et al. 2015. Comparative metabolomic analysis of the effects of light quality on polysaccharide production of cyanobacterium Nostoc flagelliforme. Algal Research, 9: 143-150.
DOI:10.1016/j.algal.2015.02.019 |
Han P P, Shen S G, Wang H Y, et al. 2017. Applying the strategy of light environment control to improve the biomass and polysaccharide production of Nostoc flagelliforme. Journal of Applied Phycology, 29(1): 55-65.
DOI:10.1007/s10811-016-0963-8 |
Harke M J, Steffen M M, Gobler C J, et al. 2016. A review of the global ecology, genomics, and biogeography of the toxic cyanobacterium, Microcystis spp. Harmful Algae, 54: 4-20.
DOI:10.1016/j.hal.2015.12.007 |
Huisman J, Codd G A, Paerl H W, et al. 2018. Cyanobacterial blooms. Nature Reviews Microbiology, 16(8): 471-483.
DOI:10.1038/s41579-018-0040-1 |
Huisman J, Sharples J, Stroom J M, et al. 2004. Changes in turbulent mixing shift competition for light between phytoplankton species. Ecology, 85(11): 2960-2970.
DOI:10.1890/03-0763 |
Li M, Zhu W, Gao L, et al. 2013. Changes in extracellular polysaccharide content and morphology of Microcystis aeruginosa at different specific growth rates. Journal of Applied Phycology, 25(4): 1023-1030.
DOI:10.1007/s10811-012-9937-7 |
Li M, Zhu W, Guo L L, et al. 2016. To increase size or decrease density? Different Microcystis species has different choice to form blooms. Scientific Reports, 6(1): 37056.
DOI:10.1038/srep37056 |
Li X Y, Yang S F. 2007. Influence of loosely bound extracellular polymeric substances (EPS) on the flocculation, sedimentation and dewaterability of activated sludge. Water Research, 41(5): 1022-1030.
DOI:10.1016/j.watres.2006.06.037 |
Liu H, Fang H H P. 2002. Characterization of electrostatic binding sites of extracellular polymers by linear programming analysis of titration data. Biotechnology and Bioengineering, 80(7): 806-811.
DOI:10.1002/bit.10432 |
Liu L Z, Huang Q, Qin B Q, et al. 2016. Characterizing cell surface of blooming Microcystis in Lake Taihu, China. Water Science & Technology, 73(11): 2731-2738.
DOI:10.2166/wst.2016.069 |
Meneghesso A, Simionato D, Gerotto C, et al. 2016. Photoacclimation of photosynthesis in the Eustigmatophycean Nannochloropsis gaditana. Photosynthesis Research, 129(3): 291-305.
DOI:10.1007/s11120-016-0297-z |
Müller P, Li X P, Niyogi K K. 2001. Non-photochemical quenching. A response to excess light energy. Plant Physiology, 125(4): 1558-1566.
DOI:10.1104/pp.125.4.1558 |
Ni L X, Li D Y, Rong S Y, et al. 2017. Characterization of extracellular polymeric substance (EPS) fractions produced by Microcystis aeruginosa under the stress of linoleic acid sustained-release microspheres. Environmental Science and Pollution Research, 24(26): 21091-21102.
DOI:10.1007/s11356-017-9540-1 |
Otero A, Vincenzini M. 2003. Extracellular polysaccharide synthesis by Nostoc strains as affected by N source and light intensity. Journal of Biotechnology, 102(2): 143-152.
DOI:10.1016/S0168-1656(03)00022-1 |
Parlanti E, Wörz K, Geoffroy L, et al. 2000. Dissolved organic matter fluorescence spectroscopy as a tool to estimate biological activity in a coastal zone submitted to anthropogenic inputs. Organic Geochemistry, 31(12): 1765-1781.
DOI:10.1016/S0146-6380(00)00124-8 |
Phélippé M, Gonçalves O, Thouand G, et al. 2019. Characterization of the polysaccharides chemical diversity of the cyanobacteria Arthrospira platensis. Algal Research, 38: 101426.
DOI:10.1016/j.algal.2019.101426 |
Pokrovsky O S, Martinez R E, Golubev S V, et al. 2008. Adsorption of metals and protons on Gloeocapsa sp. cyanobacteria: A surface speciation approach. Applied Geochemistry, 23(9): 2574-2588.
DOI:10.1016/j.apgeochem.2008.05.007 |
Qu F S, Liang H, Wang Z Z, et al. 2012. Ultrafiltration membrane fouling by extracellular organic matters (EOM) of Microcystis aeruginosa in stationary phase: influences of interfacial characteristics of foulants and fouling mechanisms. Water Research, 46(5): 1490-1500.
DOI:10.1016/j.watres.2011.11.051 |
Rousso B Z, Bertone E, Stewart R A, et al. 2021. Light-induced fluorescence quenching leads to errors in sensor measurements of phytoplankton chlorophyll and phycocyanin. Water Research, 198: 117133.
DOI:10.1016/j.watres.2021.117133 |
Sheng G P, Yu H Q, Li X Y. 2010. Extracellular polymeric substances (EPS) of microbial aggregates in biological wastewater treatment systems: a review. Biotechnology Advances, 28(6): 882-894.
DOI:10.1016/j.biotechadv.2010.08.001 |
Sirmerova M, Prochazkova G, Siristova L, et al. 2013. Adhesion of Chlorella vulgaris to solid surfaces, as mediated by physicochemical interactions. Journal of Applied Phycology, 25(6): 1687-1695.
DOI:10.1007/s10811-013-0015-6 |
Stanier R Y, Kunisawa R, Mandel M, et al. 1971. Purification and properties of unicellular blue-green algae (order Chroococcales). Bacteriological Reviews, 35(2): 171-205.
DOI:10.1128/br.35.2.171-205.1971 |
Straka L, Rittmann B E. 2017. Light attenuation changes with photo-acclimation in a culture of Synechocystis sp. PCC 6803. Algal Research, 21: 223-226.
DOI:10.1016/j.algal.2016.11.024 |
Straka L, Rittmann B E. 2018. Light-dependent kinetic model for microalgae experiencing photoacclimation, photodamage, and photodamage repair. Algal Research, 31: 232-238.
DOI:10.1016/j.algal.2018.02.022 |
Tan X, Shu X Q, Duan Z P, et al. 2020. Two types of bound extracellular polysaccharides and their roles in shaping the size and tightness of Microcystis colonies. Journal of Applied Phycology, 32(1): 255-262.
DOI:10.1007/s10811-019-01937-z |
Trabelsi L, Ouada H B, Bacha H, et al. 2009. Combined effect of temperature and light intensity on growth and extracellular polymeric substance production by the cyanobacterium Arthrosp ira platensis. Journal of Applied Phycology, 21(4): 405-412.
DOI:10.1007/s10811-008-9383-8 |
Vogelaar J C T, De Keizer A, Spijker S, et al. 2005. Bioflocculation of mesophilic and thermophilic activated sludge. Water Research, 39(1): 37-46.
DOI:10.1016/j.watres.2004.07.027 |
Walsby A E, Hayes P K, Boje R, et al. 1997. The selective advantage of buoyancy provided by gas vesicles for planktonic cyanobacteria in the Baltic Sea. New Phytologist, 136(3): 407-417.
DOI:10.1046/j.1469-8137.1997.00754.x |
Wang C, Kong H N, He S B, et al. 2010. The inverse correlation between growth rate and cell carbohydrate content of Microcystis aeruginosa. Journal of Applied Phycology, 22(1): 105-107.
DOI:10.1007/s10811-009-9421-1 |
Wang Q, Pang W J, Mao Y D, et al. 2020. Changes of extracellular polymeric substance (EPS) during Microcystis aeruginosa blooms at different levels of nutrients in a eutrophic microcosmic simulation device. Polish Journal of Environmental Studies, 29(1): 349-360.
DOI:10.15244/pjoes/102367 |
Xiao M, Li M, Duan P F, et al. 2019. Insights into the relationship between colony formation and extracellular polymeric substances (EPS) composition of the cyanobacterium Microcystis spp. Harmful Algae, 83: 34-41.
DOI:10.1016/j.hal.2019.02.006 |
Xiao M, Li M, Reynolds C S. 2018. Colony formation in the cyanobacterium Microcystis. Biological Reviews, 93(3): 1399-1420.
DOI:10.1111/brv.12401 |
Xiao M, Willis A, Burford M A, et al. 2017. Review: a meta-analysis comparing cell-division and cell-adhesion in Microcystis colony formation. Harmful Algae, 67: 85-91.
DOI:10.1016/j.hal.2017.06.007 |
Xu F, Zhu W, Xiao M, et al. 2016. Interspecific variation in extracellular polysaccharide content and colony formation of Microcystis spp. Cultured under different light intensities and temperatures. Journal of Applied Phycology, 28(3): 1533-1541.
DOI:10.1007/s10811-015-0707-1 |
Xu H C, Cai H Y, Yu G H, et al. 2013a. Insights into extracellular polymeric substances of cyanobacterium Microcystis aeruginosa using fractionation procedure and parallel factor analysis. Water Research, 47(6): 2005-2014.
DOI:10.1016/j.watres.2013.01.019 |
Xu H C, He P J, Wang G Z, et al. 2010. Three-dimensional excitation emission matrix fluorescence spectroscopy and gel-permeating chromatography to characterize extracellular polymeric substances in aerobic granulation. Water Science & Technology, 61(11): 2931-2942.
DOI:10.2166/wst.2010.197 |
Xu H, Zhu G W, Qin B Q, et al. 2013b. Growth response of Microcystis spp. to iron enrichment in different regions of Lake Taihu, China. Hydrobiologia, 700(1): 187-202.
DOI:10.1007/s10750-012-1229-3 |
Yamamoto Y, Shiah F K, Chen Y L. 2011. Importance of large colony formation in bloom-forming cyanobacteria to dominate in eutrophic ponds. Annales de Limnologie-International Journal of Limnology, 47(2): 167-173.
DOI:10.1051/limn/2011013 |
Yang H L, Cai Y F, Xia M, et al. 2011. Role of cell hydrophobicity on colony formation in Microcystis (Cyanobacteria). International Review of Hydrobiology, 96(2): 141-148.
DOI:10.1002/iroh.201011312 |
Yang Z, Geng L L, Wang W, et al. 2012. Combined effects of temperature, light intensity, and nitrogen concentration on the growth and polysaccharide content of Microcystis aeruginosa in batch culture. Biochemical Systematics and Ecology, 41: 130-135.
DOI:10.1016/j.bse.2011.12.015 |
Yang Z, Kong F X, Shi X L, et al. 2008. Changes in the morphology and polysaccharide content of Microcystis aeruginosa (Cyanobacteria) during flagellate grazing. Journal of Phycology, 44(3): 716-720.
DOI:10.1111/j.1529-8817.2008.00502.x |
Yang Z, Kong F X. 2013. Abiotic factors in colony formation: effects of nutrition and light on extracellular polysaccharide production and cell aggregates of Microcystis aeruginosa. Chinese Journal of Oceanology and Limnology, 31(4): 796-802.
DOI:10.1007/s00343-013-2264-2 |
Yue T, Zhang D L, Hu C X. 2014. Comparative studies on phosphate utilization of two bloom-forming Microcystis spp. (Cyanobacteria) isolated from Lake Taihu (China). Journal of Applied Phycology, 26(1): 333-339.
DOI:10.1007/s10811-013-0067-7 |
Zhai C M, Song S, Zou S H, et al. 2013. The mechanism of competition between two bloom-forming Microcystis species. Freshwater Biology, 58(9): 1831-1839.
DOI:10.1111/fwb.12172 |