 2022, Vol. 40
Institute of Oceanology, Chinese Academy of Sciences
Article Information
- ZHENG Longxiao, WU Mengquan, ZHOU Min, ZHAO Lianjie
- Spatiotemporal distribution and influencing factors of Ulva prolifera and Sargassum and their coexistence in the South Yellow Sea, China
- Journal of Oceanology and Limnology, 40(3): 1070-1084
- http://dx.doi.org/10.1007/s00343-021-1040-y
Article History
- Received Feb. 5, 2021
- accepted in principle Apr. 6, 2021
- accepted for publication Jun. 4, 2021


The co-emergence of the green and golden tides at 35°N in the south Yellow Sea (SYS) of China during the spring and summer of 2017 raised great concerns about their temporal and spatial relationships (Kong et al., 2018). The green tide is a marine ecological disaster caused by the outbreak of Ulva prolifera, and such outbreaks have occurred frequently in the SYS since 2007 (Zhang et al., 2019). The SYS green tide is considered to be the world's largest one because of its huge biomass and wide geographic distribution (Keesing et al., 2011). The outbreak of U. prolifera had seriously affected the economic activities and ecological environments of coastal cities in the northern China (Hu and He, 2008). Sargassum is a common species found along the coasts of the SYS and Bohai Sea in China (Yuan et al., 2014). The mass of floating Sargassum is named as "golden tide" for its golden color (Smetacek and Zingone, 2013). At the end of 2016, a large amount of floating Sargassum algae gathered in the shallows near Subei (north Jiangsu Province) region in the SYS, destroying the racks of Porphyra aquaculture and causing huge economic losses (Chen et al., 2019).
In recent years, green and golden tides occurred frequently in the SYS, causing serious losses in tourism, aquaculture, and marine ecology (Liu et al., 2009; Gower et al., 2013). Extensive studies have been carried out about the causes and monitoring techniques aiming at the spatiotemporal dynamics of U. prolifera and Sargassum outbreaks. Wang et al. (2015) investigated the origin of U.prolifera by field sampling and aerial surveys and concluded that U. prolifera originated from mainly the shallow shoals of Porphyra culture raft frames in the northern Jiangsu Province. Xing et al. (2017) used high-resolution imagery of winter 2016 in the SYS and found the drifting trajectory and origination of Sargassum. Xiao et al. (2020a) analyzed the intermonthly and inter-annual variation patterns of U. prolifera and Sargassum in the SYS and located the area of origin of Sargassum; and they suggested that Sargassum found in the SYS was originated in other areas. In terms of the scale, Wu et al. (2014) studied the spatial and temporal distribution of U. prolifera in the Yellow Sea from 2008 to 2012 with MODIS images and explored the timing, impact range, and drifting trajectory of U. prolifera outbreaks. Sun et al. (2020) quantified the biomass of U. prolifera by developing a dynamic growth model to predict the influential environmental factors during algal growth and suggested that the size of U. prolifera outbreak could be determined by the initial biomass and amounts of the effective nutrients. Zhang et al. (2019) explored the biotic competition between U. prolifera and Sargassum and concluded that the sea surface temperature (SST), Sargassum outbreaks, and the harvesting of Porphyra were responsible for the decreased green tide area in 2017. From the perspective of monitoring techniques and methods, Hu (2009) proposed a floating alga index (FAI) to monitor the planktonic algae by the baseline difference technique. Xing and Hu (2016) improved the FAI by proposing the virtual-baseline floating macro algae height (VB-FAH) and employed red wavelength band in remote sensing instead of short-wave infrared band. The symbiotic relationship between the green and golden tides is also an issue of interest. For example, Xiao et al. (2020a) and Kong et al. (2018) studied the symbiotic relationship between the green and golden tides in SYS and explored their spatial and temporal distribution.
The archived remote sensing imageries have unique advantages in studying the spatiotemporal symbiotic relationships, including the influential environmental factors, between U. prolifera and Sargassum in large areas. In this study, we used the VB-FAH to study the dynamics of U. prolifera and Sargassum from April to July each year between 2016 and 2020 in the SYS by using multi-source remote sensing images. We also explored various influential environmental factors during the formation and growth of U. prolifera and Sargassum by comparing and analyzing their spatial and temporal differences. This information provides a theoretical basis for the early warning and forecasting of harmful algal blooms.
2 MATERIAL AND METHOD 2.1 Study areaThe SYS, located from the Shandong Peninsula to the offshore of the northern Jiangsu Province in China between 32°N–37°N and 119°E–123°E, is a semienclosed shallow sea (Fig. 1). The average seawater depth of the SYS is 44 m, influenced by the submarine continental shelf (Sun et al., 2018). The SYS is located in a maritime monsoon climate zone with an average annual temperature of 14–20 ℃. The average seawater temperature during the study period was 10–22 ℃. Due to the monsoon influence, sea surface wind (SSW) field of the SYS is mainly southeast from April to September, and northwest and northeast from October to March. Influenced by the marine geological formations, SSW, and other conditions, the hydrographic conditions of SYS are complex. The major currents in SYS include the Yellow Sea Warm Current, the Yellow Sea Coastal Current, and the Changjiang (Yangtze) River Intake Current (Zhou et al., 2015). These factors have profound impacts on the spatial and temporal distribution of macroalgae in the SYS. Major cities in the study area include Nantong, Yancheng, Lianyungang, Rizhao, and Qingdao from south to north. The algae outbreaks in the SYS seriously affected the economic activities and ecological environments of the coastal cities in this area.

|
| Fig.1 Location of the study area (a & b); the landing U. prolifera bloom near Qingdao (c), floating Sargassum (d); and the exemplified spectral curves of U. prolifera, Sargassum, and seawater (e) |
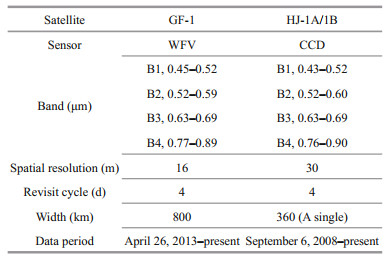
The hyperspectral, large-scale, and dynamic nature of remote-sensing technology makes it uniquely suited for long-term series monitoring of marine ecological disasters (Liu et al., 2015). To reduce the influence of cloud on information extraction, we selected remote sensing images with cloud cover less than 30%. To increase the temporal coverage frequency, we employed multisource remote sensing data, i.e., the GF-1 and HJ-1A/1B. GF-1 and HJ-1A/1B (Table 1) are high-resolution remote-sensing satellites. GF-1 and HJ-1A/1B are equipped with a 16-m WFV sensor and a 30-m CCD sensor, respectively, with a spectral range of visible (blue, green, and red) and near-infrared wavelengths. They both have a revisit cycle of four days. The GF-1 and HJ-1A/1B data were provided by the China Resources Satellite Application Center (http://www.cresda.com/CN/). The SST data and photosynthetically active radiation (PAR) data are from the National Oceanic and Atmospheric Administration (NOAA) (https://oceanwatch.pifsc.noaa.gov/doc.html) and the SSW is from the remote-sensing systems (RSS) Quick SCAT sea wind data.
The spectral characteristics of marine macroalgae are similar to those of terrestrial vegetation (Yuan et al., 2020). Therefore, we calculated the vegetation index to distinguish macroalgae from seawater. The indices currently used in the extraction of marine macroalgae include the ratio vegetation index (RVI), the differential vegetation index (DVI) (Xing et al., 2017), the normalized difference vegetation index (NDVI) (Cui et al., 2012), the FAI (Hu, 2009), and the VB-FAH (Xing and Hu, 2016). In the distinction between U. prolifera and Sargassum, there is mainly SUI (Sargassum and U. prolifera Index) (Jin et al., 2016; Sun et al., 2021). However, it is noted that the threshold of a specific vegetation index to differentiate the macroalgae and seawater is hard to determine due to the varied sea surface state. For example, Xing and Hu (2016) suggested that the threshold value of VB-FAH to extract U. prolifera should be 0.02–0.025.
In this study, we evaluated the accuracy of DVI, NDVI, and VB-FAH in differentiating U. prolifera and Sargassum from seawater, and the most accurate one was used in the following studies.
The DVI distinguishes algae from seawater by calculating the difference in reflectance between the near-infrared and red wavelength bands. It is more effective in eliminating the effects of the sun and thin clouds (Xing et al., 2017). The formula of DVI is as follows:
 (1)
(1)where NIR represents the near-infrared band and R represents the red band.
The NDVI distinguishes algae from seawater by normalizing the near-infrared and red bands. Theoretically, the NDVI values for U. prolifera and Sargassum should be positive. Dynamic adjustment of the thresholds is required due to atmospheric and water influences in real situations (Chen et al., 2019). The formula of NDVI is as follows:
 (2)
(2)where NIR represents the near-infrared band and R represents the red band in visible light.
The VB-FAH and FAI are based on the baseline difference method. Because the GF-1 and HJ-1A/1B data lack short-wave infrared, the VB-FAH forms a virtual baseline of green and red light, replacing the short-wave infrared with the red band (Xing and Hu, 2016). The formula of VB-FAH is as follows:
 (3)
(3)where R4, R3, and R2 represent the near-infrared band, red band, and green band, respectively; and λ4, λ3, and λ2 represent the wavelengths of near-infrared, red, and green light, respectively.
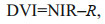
To compare the accuracy of the three indices, we selected 24 samples from 4 images (Fig. 2). The DVI, NDVI, and VB-FAH were calculated separately for each sample area. To evaluate the accuracy, we calculated the overall accuracy and KAPPA coefficients of the three indices (Table 2). The VB-FAH showed the highest overall accuracy and KAPPA coefficient. Therefore, we proposed to use the VB-FAH to extract U. prolifera and Sargassum in the SYS.

|
| Fig.2 Two GF-1 images and two HJ-1A/1B images in true color composite Six sample areas (a–f) were selected in each image. |
To study the spectral characteristics of U. prolifera and Sargassum, we measured the spectral reflectance of the two species as well as seawater (Fig. 1e). According to the spectral curves (Fig. 1e), the reflectance values of U. prolifera and Sargassum were generally higher than that of seawater. The reflectance of U. prolifera was generally higher than that of Sargassum. The species displayed a small reflectance peak at 560 nm and a small reflectance valley at 690 nm (Qi et al., 2017). The spectra show an increasing trend with increasing wavelength. There was a clear "red edge" phenomenon in the near-infrared band, which is consistent with the results of Hu et al. (2015). The reflectance of algae and seawater shows a large difference in red and near-infrared bands. Therefore, U. prolifera and Sargassum could be discriminated by a linear combination of different bands. Most of the algorithms are designed to detect a single type of macroalgae and are impotent in differentiating mixed blooms with concurrent Sargassum and U. prolifera (Sun et al., 2021). Here, we suggested that it is necessary to combine the threshold segmentation methods and visual interpretation of true color images to distinguish U. prolifera and Sargassum.
Ulva prolifera appears in late May to early July and is closer to the shore compared with Sargassum. Sargassum appears in late April to early June. The two algae coexist in the sea near 35°N in late May to early June.
When U. prolifera and Sargassum occurred together, it was difficult to distinguish them by threshold segmentation method alone. U. prolifera has a green light reflection peak near 550 nm, while the reflectance of Sargassum did not change significantly in this band. The reflectance of U. prolifera decreased near 640 nm, while the reflectance of Sargassum is on the contrary (Jin et al., 2016). In order to determine the threshold of U. prolifera and Sargassum, we calculated the VB-FAH value of GF-1 image on June 3, 2020 and randomly selected 100 samples of U. prolifera and Sargassum in the image. As shown in Fig. 3, the VB-FAH values of U. prolifera mainly concentrated between 0.02 and 0.03, and between 0.3 and 0.5 for Sargassum. We applied these two ranges to the other images and adjusted according to the actual situation by visual interpretation. Finally, we found that the thresholds of [0.02-0.025] for U. prolifera and [0.32-0.45] for Sargassum could distinguish U. prolifera from Sargassum in acceptable accuracy. To ensure the accuracy of algal extraction, we reclassified the misclassified areas by visual interpretation, and vectorized the missed areas by hand according to the shape of algal patches (Wang et al., 2019).

|
| Fig.3 Statistical distribution of VB-FAH values for U. prolifera and Sargassum |
In this study, we first pre-processed GF-1 and HJ-1A/1B images with radiometric calibration, atmospheric correction, and mosaic cropping. We then calculated the VB-FAH by waveband operation and segmented the corresponding images to distinguish algae from seawater. Finally, we analyzed the data in ArcGIS to study the spatial and temporal distribution of U. prolifera and Sargassum (Fig. 4). Because the spatial resolutions of GF-1 and HJ-1A/1B are different, we performed the statistics at pixel level. Assuming that a pixel value is greater than the threshold of VB-FAH and is a valid pixel for algae, we distinguished the coexistence of green and golden tides by threshold segmentation and visual interpretation.

|
| Fig.4 Flow chart of data processing |
We monitored the areas of U. prolifera in the SYS for the past five years. As shown in Figs. 5–7, the largest U. prolifera area was found in 2016, with two maxima of 1 486.47 km2 and 1 477.38 km2 on June 13 and June 25, respectively. In 2018, U. prolifera appeared on June 11 at 35°N with an initial area of 186.00 km2 and approached a maximum coverage of 1 151.81 km2 on June 24, and then disappeared near Qingdao after July 6. In 2019, U. prolifera was first monitored on May 9 near Nantong City, and the maximum area of 1 058.97 km2 was observed along 35°N on May 29 and it disappeared after July 2 near Qingdao City.

|
| Fig.5 Areas covered by Ulva prolifera from 2016 to 2020 |

|
| Fig.6 Spatiotemporal distribution of U. prolifera and Sargassum from 2016 to 2020 |

|
| Fig.7 Drifting paths of U. prolifera (a) and Sargassum (b) during 2016 to 2020 |
In the middle and late May, U. prolifera could be found near the shallows in northern Jiangsu. At the early stage, the biomass and the impact area of U. prolifera were small. In early June, the algae entered a period of rapid growth under the influence of light, SST, and nutrients. In late June, the algae drifted northward driven by the SSW and surface currents and reached near 35°N, and U. prolifera entered the outbreak stage. The algae entered the recession stage in July and drifted to Haiyang and Rongcheng in Shandong Province driven by the SSW and ocean currents, and then died out. The total area of U. prolifera showed an increasing and then decreasing trend during the whole drifting process. Therefore, the phase of U. prolifera bloom could be recognized as from appearance, development, outbreak, decline, to disappearance, which is consistent with the findings of Sun et al. (2018) and Qi et al. (2016).
3.2 Spatiotemporal distribution of SargassumAs shown in Figs. 6–8, Sargassum was first found on May 11, 2016, in the east of the shallows of the Subei region, with an area of 6.41 km2, and the maximum area was 29.48 km2 on May 17 and then disappeared near Qingdao on June 13. The largest area of Sargassum was found in 2017, with an initial area of 29.78 km2 and a maximum coverage of 612.60 km2 on May 18, and the algae disappeared near Qingdao after June 9. In 2018, the area covered by Sargassum was the smallest, with an initial area of 6.50 km2 and a maximum area of 7.11 km2 on May 10, and the algae finally disappeared near Rongcheng City. In 2019 and 2020, the areas of Sargassum showed a continuous decreasing trend; the algae were observed on May 3 and April 24 in the northeast of the mouth of the Changjiang River, and continuously drifted to the northwest; and the algae disappeared near 35°N–36°N in early June.

|
| Fig.8 Areas covered by Sargassum from 2016 to 2020 |
In general, Sargassum usually appeared in late April around 33°N, 123°30′E. It grew rapidly in middle to early May with increased coverage and drifted northwestward. In late May and early June, Sargassum entered the recession stage, growing along with U. prolifera near 35°N–36°N, and then disappeared. Its coverage tended to increase and then decrease during the drifting period. Similar with U. prolifera, the phase of Sargassum bloom could also be classified into three stages: appurtenance, outbreak, and disappearance. However, the phases of Sargassum bloom in 2019 and 2020 could be roughly reduced into two phases: outbreak and disappearance. We speculated that the source of the outbreaks may be in some other regions (Xiao et al., 2020b).
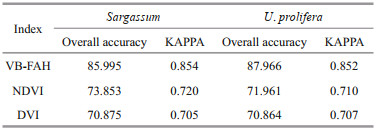
4 DISCUSSION 4.1 Spatiotemporal distribution characteristics of U. prolifera and SargassumUlva prolifera and Sargassum coexist to a certain extent in time and space, which leads to the concurrence of the "green" and "golden" tides in the SYS. In terms of time, U. prolifera generally appeared in the middle to late May and declined in July, and Sargassum typically appeared in late April and declined in late May and early June. The two algae species were not perfectly synchronized in time. Spatially, U. prolifera originated in the shallows of northern Jiangsu Province, drifted northwestward, and finally disappeared in the Haiyang and Rongcheng regions in Shandong Province (Fig. 7a). Sargassum generally appeared in the distant sea areas east of the shallows in northern Jiangsu, and drifted northwestward until disappeared near 35°N. The two species mixed near 35°N in late May–early June, causing the coexistence of green and golden tides. However, it is noted that Sargassum grows predominantly in the east and west part of 121°E, separately, which was also observed by Kong et al. (2018).
Sargassum appeared earlier than U. prolifera(Table 3), and had a relative shorter life cycle compared with U. prolifera. The area of U. prolifera far exceeded that of Sargassum (Figs. 5–8). We found that the area of U. prolifera showed a decreasing trend, while the area of Sargassum continuously increased, and this phenomenon might imply that it is likely to be another marine ecological disaster after the green tides. The reason for the coexistence of green and golden tides may be related to the biological characteristics of the two species. U. prolifera and Sargassum may differ in their sensitivity to SST and thus have different growth states.
The SST may affect the growth of algae, e.g., the germination and attachment of algae vegetative forms (Song et al., 2015). We introduced the concept of sea surface temperature anomaly (SSTA) to quantitatively study the response between SST and algae growth (Wu et al., 2011). For this purpose, we calculated the difference between the monthly SST and multi-year monthly mean SST and then analyzed its correlation with the monthly mean growth rate of the algae (Jin et al., 2018; Zhang et al., 2020).
Figure 9 shows the relationship between SSTA and the growth rate of U. prolifera from May to July in 2016–2020. The SSTA positively correlated with the growth rate of U. prolifera in May and June (Fig. 9a & b), whilst the correlation was negative in July (Fig. 9c). The growth rate of U. prolifera slowed and even became negative when the SST increased. The spores of U. prolifera have high adaptability to temperature changes; the spores can germinate at 10 ℃, and could reach a maximum reproduction rate at 15–25 ℃ (Song et al., 2015). U. prolifera enters the outbreak stage if the SST is between 23 ℃ and 26 ℃ (Li et al., 2016), and will reach its maximum growth rate at about 25 ℃ (Wang et al., 2007).

|
| Fig.9 Correlations between the SSTA and average growth rates of U. prolifera (a–c) and Sargassum (d–f) |
In May, the SST at SYS was 12–19 ℃, and the SST in the shallows of northern Jiangsu was 17–20 ℃. This temperature was suitable for the growth of U. prolifera spores, but the correlations between SST and growth rate were weak. We presumed that other environmental factors may also influenced the growth of U. prolifera in the early stages. For example, the shoals in northern Jiangsu received a large amount of land-based organic matter which might contributed to the proliferation of spores.
In June, the SST in the SYS was about 19–24 ℃, and the SST in the shallows of northern Jiangsu Province and Haizhou Bay reached 22–24 ℃, where a high correlation between SST and growth rate of U. prolifera was observed. At the same time, the sun shines directly on the northern hemisphere, and the abundant solar radiation could promote photosynthesis. In addition, the near-shore waters were nutrient rich, which also was conducive to algal growth.
In July, the SST in the SYS was about 24–28 ℃, and the temperatures in the near-shore areas, e.g. Rizhao, Qingdao, and Haiyang were about 26–28 ℃. The solar radiation reached its maximum at this time. Within a certain range, the photosynthetic intensity of algae was directly proportional to the radiation intensity; above this range, the photoinhibition may reduce the growth rate of the algae (Fu et al., 2018). When U. prolifera drifted to Qingdao in July, the local high SST and high solar radiation could limit algal growth to certain extent (Jin et al., 2018). At the same time, the nutrients in the seawater may become insufficient as its biomass reached its maximum (Kim et al., 2011a), so a declined growth rate might be observed, then U. prolifera entered the declining-disappearing stage.
As shown in Fig. 9, the SSTA and Sargassum growth rate was positively correlated in May (R2=0.53). The growth rate of Sargassum accelerated with increasing temperature. There were negative correlations between SSTA and Sargassum growth rate in April (R2=0.13) and June (R2=0.39). As the SST increased, the growth rate of Sargassum slowed or even became negative, and the algae began to decline. Changes in temperature had a significant effect on the growth of Sargassum. Moderate to high temperatures in the range of 10 ℃ to 30 ℃ could accelerate the growth of Sargassum (Wu et al., 2019), and the optimum temperature for growth is about 15 ℃ (Yuan et al., 2014).
In April, Sargassum mainly concentrated in the distant sea at northeast of the Changjiang River inlet, where the SST was about 11–14 ℃ and Sargassum could grow normally and entered the appearance stage. In this stage, the correlation between its growth rate and temperature was weak, and this indicated that the SST was still not a critical factor for the growth of Sargassum.
The algae could be observed between 33°N and 34°N in May, where the SST was about 15–17 ℃, the optimum temperature for growth of Sargassum. During this period, the SST and the growth rate of Sargassum were positively correlated. This indicated that the SST was a key factor affecting the growth of Sargassum during the outbreak stage.
In June, Sargassum drifted near 35°N, 121°E along with U. prolifera, where the SST was about 20–22 ℃. The high SST may have limited the growth of Sargassum (Graba-Landry et al., 2020), and entered the disappearance stage. The correlation between temperature change and growth rate, however, was weak at this time (R2=0.39), indicating that the temperature change was not a key factor during the disappearance of Sargassum. In June, U. prolifera was in the appearance–outbreak stage, with a fast growth rate and strong absorption of nutrients and radiation (Xing et al., 2015). In addition, the allelopathic chemicals produced by U. prolifera affected the physicochemical properties of water bodies and thus inhibited the growth of the other algae(Jin et al., 2005; Harvey et al., 2015; Miao et al., 2018). This may be an important reason for the decrease and even disappearance of Sargassum in June.
4.3 Effect of PAR on the growth of U. prolifera and SargassumThe irradiance and temperature are two major factors which influence algal growth, release of spores, germination and growth (Keesing et al., 2016; Zhang et al., 2016). The PAR is the spectral component of solar radiation that is effective for plant photosynthesis. Moderate light conditions could accelerate growth and reproduction by increasing enzyme activity and the ability of the algae to absorb nitrogen (Gao et al., 2017). To quantitatively study the response between PAR and algae, we analyzed the correlations between PAR and the growth rate of U. prolifera and Sargassum in SYS from April to June based on the PAR product data from MODIS (Fig. 10).

|
| Fig.10 Correlations between PAR and the average growth rates of U. prolifera (a–c) and Sargassum (d–f) |
There were positive correlations between PAR and U. prolifera growth rate in May (R2=0.23) and June (R2=0.72) (Fig. 10). The PAR (44 W/m2) did not exceed the optimal conditions for the growth of U. prolifera during this phase (Jin et al., 2018). The PAR positively correlated with the growth rate of Sargassum in April (R2=0.56) and May (R2=0.66), whilst the PAR was within the suitable growth range of U. prolifera and Sargassum (Jin et al., 2018). The PAR negatively correlated with the growth rate of Sargassum in June (R2=0.13) and negatively correlated with the growth rate of U. prolifera in July (R2=0.64), whilst U. prolifera drifted to the offshore of Qingdao City in July and the growth conditions were poor due to strong radiance (> 44 W/m2) (Jin et al., 2018). The photoinhibition, high SST, and strong radiance, including the ultraviolet radiation could inhibit the growth of algae and lead to the onset of the decline phase (Kim et al., 2011b).
4.4 Effect of SSW on the drift paths of U. prolifera and SargassumWe analyzed the RSS Quick SCAT SSW data to obtain the wind field of the SYS surface from April to July in 2016–2020 (Fig. 11). The overall southeasterly and northerly winds prevailed in the SYS in April. The wind was about 7 m/s in the distant sea at northeast of the mouth of the Changjiang River and was about 9 m/s in the shallow waters of northern Jiangsu Province. The SSWs in May were mainly from the southeast and northwest, and the wind speed was about 8 m/s in the shallow inshore area of northern Jiangsu Province, higher than that of the offshore area. The SYS was dominated by the southeast winds in June and July.

|
| Fig.11 SSW field of the SYS from April to July in 2016-2020 |
The drifting process of macroalgae in the SYS was mainly dominated by the surface currents driven by the SSW (Qiao et al., 2011). The drifting trajectory paths of U. prolifera and Sargassum from April to July in 2016–2020 (Fig. 7) showed that the drifting paths generally were from the southeast to the northwest and north. U. prolifera first appeared in May in the shallow waters of northern Jiangsu. At this time, the SSW was from the southeast, and the wind speed was about 7 m/s.The algae drifted northwestward and reached the east of Lianyungang in June. At this time, the SSW was southeasterly, the angle became smaller, and the south wind started. Influenced by the coastal topography and ocean currents, the algae drifted to Qingdao in July, and then it reached the Haiyang-Rongcheng area and disappeared. Sargassum was observed around 122°E in April at northeastern Changjiang River inlet, whilst the SSW was southeast and the wind speed was about 7 m/s. The algae drifted to the shallows around 34°30′N, 121°E in May, and drifted toward 35°N, 122°E, mixed with U. prolifera and then disappeared.
5 CONCLUSIONBy exploring the spatiotemporal characteristics of U. prolifera and Sargassum in SYS between April and July from 2016 to 2020 using multisource remote sensing imageries, we concluded that:
1. The bloom of U. prolifera could be classified into five stages: appearance, development, outbreak, decline, and disappearance. Similarly, for Sargassum, it could be classified into three stages: appearance, outbreak, and disappearance.
2. The symbiotic distribution of U. prolifera and Sargassum was in a certain period of time.U. prolifera usually appeared in late May and early July, while Sargassum normally appeared in late April and early June. In June, Sargassum grew in the sea near 35°N together with U. prolifera, producing a symbiosis of green and golden tides.
3. The SST, PAR, and SSW are the major factors affecting the coexistence of green and golden tides. Under the influence of SST and PAR, the two algae showed different growth states. The growth of the two algae overlapped in late May and early June, and drifted to the northwest under the influence of the southeast winds.
Ulva prolifera and Sargassum had certain similarities and differences in time and space. Both species were influenced by multiple factors during their growth processes. In the future, we will further explore the relationships between U. prolifera and Sargassum by using remote sensing technology to provide a theoretical basis for the prevention and control of marine ecological disasters.
6 DATA AVAILABILITY STATEMENTThe datasets generated during and/or analyzed during the current study are available from the corresponding author on reasonable request.
7 ACKNOWLEDGMENTWe gratefully acknowledge the help of the Geographic Information System Group of Ludong University in data collection and analysis.
Chen Y L, Wan J H, Zhang J, Ma Y J, Wang L, Zhao J H, Wang Z Z. 2019. Spatial-temporal distribution of golden tide based on high-resolution satellite remote sensing in the south Yellow Sea. Journal of Coastal Research, 90(S1): 221-227.
DOI:10.2112/SI90-027.1 |
Cui T W, Zhang J, Sun L E, Jia Y J, Zhao W J, Wang Z L, Meng J M. 2012. Satellite monitoring of massive green macroalgae bloom (GMB): imaging ability comparison of multi-source data and drifting velocity estimation. International Journal of Remote Sensing, 33(17): 5513-5527.
DOI:10.1080/01431161.2012.663112 |
Fu Q Q, Li H X, Wu H L, Xu J T. 2018. Effects of light intensity on photosynthetic physiology characteristic and short time temperature reaction of Ulva linza. Oceanologia et Limnologia Sinica, 49(5): 967-974.
(in Chinese with English abstract) DOI:10.11693/hyhz20180400074 |
Gao G, Clare A S., Rose C, Caldwell G S. 2017. Intrinsic and extrinsic control of reproduction in the green tide-forming alga, Ulva rigida. Environmental and Experimental Botany, 139: 14-22.
DOI:10.1016/j.envexpbot.2017.03.016 |
Gower J, Young E, King S. 2013. Satellite images suggest a new Sargassum source region in 2011. Remote Sensing Letters, 4(8): 764-773.
DOI:10.1080/2150704X.2013.796433 |
Graba-Landry A C, Loffler Z, McClure E C, Pratchett M S, Hoey A S. 2020. Impaired growth and survival of tropical macroalgae (Sargassum spp.) at elevated temperatures. Coral Reefs, 39(2): 475-486.
DOI:10.1007/s00338-020-01909-7 |
Harvey E T, Kratzer S, Philipson P. 2015. Satellite-based water quality monitoring for improved spatial and temporal retrieval of chlorophyll-a in coastal waters. Remote Sensing of Environment, 158: 417-430.
DOI:10.1016/j.rse.2014.11.017 |
Hu C M, Feng L, Hardy R F, Hochberg E J. 2015. Spectral and spatial requirements of remote measurements of pelagic Sargassum macroalgae. Remote Sensing of Environment, 167: 229-246.
DOI:10.1016/j.rse.2015.05.022 |
Hu C M, He M X. 2008. Origin and offshore extent of floating algae in Olympic sailing area. EOS, 89(33): 302-303.
DOI:10.1029/2008EO330002 |
Hu C M. 2009. A novel ocean color index to detect floating algae in the global oceans. Remote Sensing of Environment, 113(10): 2118-2129.
DOI:10.1016/j.rse.2009.05.012 |
Jin Q, Dong S L, Wang C Y. 2005. Allelopathic growth inhibition of Prorocentrum micans (Dinophyta) by Ulva pertusa and Ulva linza (Chlorophyta) in laboratory cultures. European Journal of Phycology, 40(1): 31-37.
DOI:10.1080/09670260400019741 |
Jin S, Han Z, Liu Y. 2016. A remote sensing method for discriminating Ulva prolifra and Sargassum. Remote Sensing Information, 31(2): 44-48.
(in Chinese with English abstract) |
Jin S, Liu Y X, Sun C, Wei X L, Li H T, Han Z. 2018. A study of the environmental factors influencing the growth phases of Ulva prolifera in the southern Yellow Sea, China. Marine Pollution Bulletin, 135: 1016-1025.
DOI:10.1016/j.marpolbul.2018.08.035 |
Keesing J K, Liu D Y, Fearns P, Garcia R. 2011. Inter- and intra-annual patterns of Ulva prolifera green tides in the Yellow Sea during 2007-2009, their origin and relationship to the expansion of coastal seaweed aquaculture in China. Marine Pollution Bulletin, 62(6): 1169-1182.
DOI:10.1016/j.marpolbul.2011.03.040 |
Keesing J K, Liu D Y, Shi Y J, Wang Y J. 2016. Abiotic factors influencing biomass accumulation of green tide causing Ulva spp. on Pyropia culture rafts in the Yellow Sea, China. Marine Pollution Bulletin, 105(1): 88-97.
DOI:10.1016/j.marpolbul.2016.02.051 |
Kim J H, Kang E J, Park M G, Lee B G, Kim K Y. 2011a. Effects of temperature and irradiance on photosynthesis and growth of a green-tide-forming species (Ulva linza) in the Yellow Sea. Journal of Applied Phycology, 23(3): 421-432.
DOI:10.1007/s10811-010-9590-y |
Kim J, Park J H, Lee T H. 2011b. Sensitivity analysis of steel buildings subjected to column loss. Engineering Structures, 33(2): 421-432.
DOI:10.1016/j.engstruct.2010.10.025 |
Kong F Z, Jiang P, Wei C J, Zhang Q C, Li J Y, Liu Y T, Yu R C, Yan T, Zhou M J. 2018. Co-occurence of green tide, golden tide and red tides along the 35°N transect in the Yellow Sea during spring and summer in 2017. Oceanologia et Limnologia Sinica, 49(5): 1021-1030.
(in Chinese with English abstract) DOI:10.11693/hyhz20180400082 |
Li X N, Han Z, Liu X B, Jin S, Liu Y. 2016. A study of the relationship between the processes of Enteromorpha and Sargassum and sea surface temperature. Transactions of Oceanology and Limnology, (5): 125-130.
(in Chinese with English abstract) DOI:10.13984/j.cnki.cn37-1141.2016.05.018 |
Liu D Y, Keesing J K, Xing Q G, Shi P. 2009. World's largest macroalgal bloom caused by expansion of seaweed aquaculture in China. Marine Pollution Bulletin, 58(6): 888-895.
DOI:10.1016/j.marpolbul.2009.01.013 |
Liu X Q, Li Y, Wang Z L, Zhang Q C, Cai X Q. 2015. Cruise observation of Ulva prolifera bloom in the southern Yellow Sea, China. Estuarine, Coastal and Shelf Science, 163: 17-22.
DOI:10.1016/j.ecss.2014.09.014 |
Miao X X, Xiao J, Pang M, Zhang X L, Wang Z L, Miao J W, Li Y. 2018. Effect of the large-scale green tide on the species succession of green macroalgal micro-propagules in the coastal waters of Qingdao, China. Marine Pollution Bulletin, 126: 549-556.
DOI:10.1016/j.marpolbul.2017.09.060 |
Qi L, Hu C M, Wang M Q, Shang S L, Wilson C. 2017. Floating algae blooms in the East China Sea. Geophysical Research Letters, 44(22): 11501-11509.
DOI:10.1002/2017GL075525 |
Qi L, Hu C M, Xing Q G, Shang S L. 2016. Long-term trend of Ulva prolifera blooms in the western Yellow Sea. Harmful Algae, 58: 35-44.
DOI:10.1016/j.hal.2016.07.004 |
Qiao F L, Wang G S, Lü X G, Dai D J. 2011. Drift characteristics of green macroalgae in the Yellow Sea in 2008 and 2010. Chinese Science Bulletin, 56(21): 2236-2242.
DOI:10.1007/s11434-011-4551-7 |
Smetacek V, Zingone A. 2013. Green and golden seaweed tides on the rise. Nature, 504(7478): 84-88.
DOI:10.1038/nature12860 |
Song W, Peng K Q, Xiao J, Li Y, Wang Z L, Liu X Q, Fu M Z, Fan S L, Zhu M Y, Li R X. 2015. Effects of temperature on the germination of green algae micro-propagules in coastal waters of the Subei Shoal, China. Estuarine, Coastal and Shelf Science, 163: 63-68.
DOI:10.1016/j.ecss.2014.08.007 |
Sun D Y, Chen Y, Wang S Q, Zhang H L, Qiu Z F, Mao Z H, He Y J. 2021. Using Landsat 8 OLI data to differentiate Sargassum and Ulva prolifera blooms in the South Yellow Sea. International Journal of Applied Earth Observation and Geoinformation, 98: 102302.
DOI:10.1016/j.jag.2021.102302 |
Sun K, Ren J S, Bai T, Zhang J H, Liu Q, Wu W G, Zhao Y X, Liu Y. 2020. A dynamic growth model of Ulva prolifera: application in quantifying the biomass of green tides in the Yellow Sea, China. Ecological Modelling, 428: 109072.
DOI:10.1016/j.ecolmodel.2020.109072 |
Sun X, Wu M Q, Xing Q G, Song X D, Zhao D H, Han Q Q, Zhang G Z. 2018. Spatio-temporal patterns of Ulva prolifera blooms and the corresponding influence on chlorophyll-a concentration in the Southern Yellow Sea, China. Science of the Total Environment, 640-641: 807-820.
DOI:10.1016/j.scitotenv.2018.05.378 |
Wang J W, Yan B L, Lin A P, Hu J P, Shen S D. 2007. Ecological factor research on the growth and induction of spores release in Enteromorpha prolifera (Chlorophyta). Marine Science Bulletin, 26(2): 60-65.
(in Chinese with English abstract) DOI:10.3969/j.issn.1001-6392.2007.02.009 |
Wang N, Cao C H, Huang J, Ding Y, Xin L, Song Y. 2019. Application research of Enteromorpha and Sargassum distinguishing method in operational monitoring. Marine Forecast, 36(4): 68-75.
(in Chinese with English abstract) DOI:10.11737/j.issn.1003-0239.2019.04.009 |
Wang Z L, Xiao J, Fan S L, Li Y, Liu X Q, Liu D Y. 2015. Who made the world's largest green tide in China?—an integrated study on the initiation and early development of the green tide in Yellow Sea. Limnology and Oceanography, 60(4): 1105-1117.
DOI:10.1002/lno.10083 |
Wu H L, Feng J C, Li X S, Zhao C Y, Liu Y H, Yu J T, Xu J T. 2019. Effects of increased CO2 and temperature on the physiological characteristics of the golden tide blooming macroalgae Sargassum horneri in the Yellow Sea, China. Marine Pollution Bulletin, 146: 639-644.
DOI:10.1016/j.marpolbul.2019.07.025 |
Wu M Q, Guo H, Zhang A D, Jia L L, Xiao L X, Wang J P. 2014. Research on the characteristics of Ulva. prolifera in Shandong Peninsula during 2008-2012 based on MODIS data. Spectroscopy and Spectral Analysis, 34(5): 1312-1318.
(in Chinese with English abstract) DOI:10.3964/j.issn.1000-0593(2014)05-1312-07 |
Wu Y M, Xu Z L, Fan W, Cui X S. 2011. Change of sea surface temperature in East China Sea during 1985-2005. Haiyang Xuebao, 33(6): 9-18.
(in Chinese with English abstract) |
Xiao J, Fan S L, Wang Z L, Fu M Z, Song H J, Wang X, Yuan C, Pang M, Miao X X, Zhang X L. 2020a. Decadal characteristics of the floating Ulva and Sargassum in the Subei Shoal, Yellow Sea. Acta Oceanologica Sinica, 39(10): 1-10.
DOI:10.1007/s13131-020-1655-4 |
Xiao J, Wang Z L, Song H J, Fan S L, Yuan C, Fu M Z, Miao X X, Zhang X L, Su R G, Hu C M. 2020b. An anomalous bi-macroalgal bloom caused by Ulva and Sargassum seaweeds during spring to summer of 2017 in the western Yellow Sea, China. Harmful Algae, 93: 101760.
DOI:10.1016/j.hal.2020.101760 |
Xing Q G, Guo R H, Wu L L, An D Y, Cong M, Qin S, Li X R. 2017. High-resolution satellite observations of a new hazard of golden tides caused by floating Sargassum in winter in the Yellow Sea. IEEE Geoscience and Remote Sensing Letters, 14(10): 1815-1819.
DOI:10.1109/LGRS.2017.2737079 |
Xing Q G, Hu C M, Tang D L, Tian L Q, Tang S L, Wang X H, Lou M J, Gao X L. 2015. World's largest macroalgal blooms altered phytoplankton biomass in summer in the Yellow Sea: satellite observations. Remote Sensing, 7(9): 12297-12313.
DOI:10.3390/rs70912297 |
Xing Q G, Hu C M. 2016. Mapping macroalgal blooms in the Yellow Sea and East China Sea using HJ-1 and Landsat data: application of a virtual baseline reflectance height technique. Remote Sensing of Environment, 178: 113-126.
DOI:10.1016/j.rse.2016.02.065 |
Yuan C Y, Yang S, Wang Y, Cui Q M. 2014. Effect of temperature on the growth and biochemical composition of Sargassum muticum. Advanced Materials Research, 989-994: 747-750.
DOI:10.4028/www.scientific.net/AMR.989-994.747 |
Yuan C, Zhang J Y, Xiao J, Fu M Z, Zhang X L, Cui T W, Wang Z L. 2020. The spatial and temporal distribution of floating green algae in the Subei Shoal in 2018 retrieved by Sentinel-2 images. Haiyang Xuebao, 42(8): 12-20.
(in Chinese with English abstract) DOI:10.3969/j.issn.0253-4193.2020.08.002 |
Zhang G Z, Wu M Q, Zhang A D, Xing Q G, Zhou M, Zhao D H, Song X D, Yu Z L. 2020. Influence of sea surface temperature on outbreak of Ulva prolifera in the southern Yellow Sea, China. Chinese Geographical Science, 30(4): 631-642.
DOI:10.1007/s11769-020-1129-9 |
Zhang J H, Kim J K, Yarish C, He P M. 2016. The expansion of Ulva prolifera O. F. Muller macroalgal blooms in the Yellow Sea, P R China, through asexual reproduction. Marine Pollution Bulletin, 104(1-2): 101-106.
DOI:10.1016/j.marpolbul.2016.01.056 |
Zhang J H, Shi J T, Gao S, Huo Y Z, Cui J J, Shen H, Liu G Y, He P M. 2019. Annual patterns of macroalgal blooms in the Yellow Sea during 2007-2017. PLoS One, 14(1): e0210460.
DOI:10.1371/journal.pone.0210460 |
Zhou Y P, Tan L J, Pang Q T, Li F, Wang J T. 2015. Influence of nutrients pollution on the growth and organic matter output of Ulva prolifera in the southern Yellow Sea, China. Marine Pollution Bulletin, 95(1): 107-114.
DOI:10.1016/j.marpolbul.2015.04.034 |