 2022, Vol. 40
Institute of Oceanology, Chinese Academy of Sciences
Article Information
- LI Meng, DU Baolu, GUO Jinjia, ZHANG Zhihao, LU Zeyu, ZHENG Rong'er
- A low-cost in-situ CO2 sensor based on a membrane and NDIR for long-term measurement in seawater
- Journal of Oceanology and Limnology, 40(3): 986-998
- http://dx.doi.org/10.1007/s00343-021-1133-7
Article History
- Received Apr. 17, 2021
- accepted in principle Jun. 14, 2021
- accepted for publication Jul. 19, 2021


2 R&D Center for Marine Instruments and Apparatuses, Pilot National Laboratory for Marine Science and Technology (Qingdao), Qingdao 266237, China
The ocean is a huge reservoir of carbon and have the capacity for absorbing and retaining CO2 (Yin et al., 2006). The oceanic uptake of anthropogenic CO2 causes pronounced changes to the marine carbonate system (Clarke et al., 2017). Since the 1980s, 20% to 30% of CO2 from human activity has been absorbed by the ocean, which has caused ocean acidification (Bindoff et al., 2019). High quality partial pressure of carbon dioxide (pCO2) measurements with good temporal and spatial coverage are required to monitor the oceanic uptake, identify regions with pronounced carbonate system changes, and observe the effectiveness of CO2 emission mitigation strategies (Clarke et al., 2017). Therefore, measuring dynamic changes of CO2 in seawater is of great significance to understanding the ocean carbon cycle and ocean acidification.
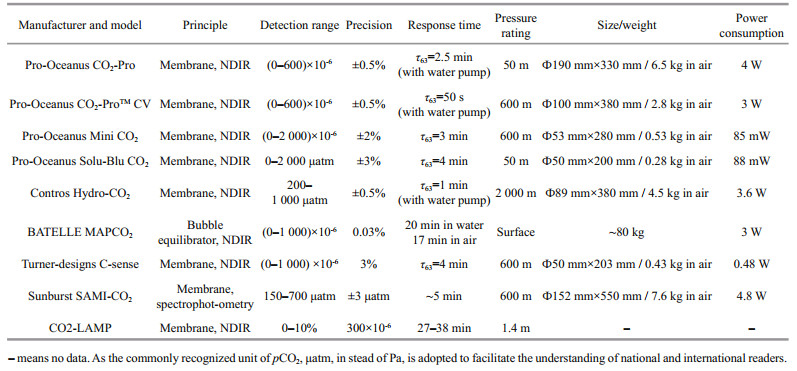
In the past few decades, underwater in-situ CO2 sensors have attracted more and more attention (Clarke et al., 2017). In 2009, the Coastal Technology Alliance (ACT) undertook detailed performance tests on commercial sensors in Hood Canal, Washington, and Kaneohe Bay, Hawaii, for a month, including Contros HydroCTM/CO2, PMEL MAPCO2/Battelle Seaology pCO2 monitoring system, Pro-Oceanus Systems Inc. PSI CO2-ProTM, and Sunburst Sensors SAMI-CO2 (Schar et al., 2009a, b, c, d). Meanwhile, water samples were collected to measure pCO2 in the laboratory by two traditional methods, and in-situ pCO2 measurements were compared to these references, and estimates of analytical and environmental variability were reported (Schar et al., 2009a, b, c, d). The extensive time-series data provided by these sensors at both test sites revealed patterns in pCO2, and captured a significantly greater dynamic range and temporal resolution than could be obtained from discrete reference samples. Aliasing of water sampling missed some of the extreme and rapid changes in pCO2 often observed in these environments (Schar et al., 2009a, b, c, d; Tamburri et al., 2011). The results indicate the feasibility of these sensors for underwater applications, and the importance of continuous in-situ measurements. In addition, some new pCO2 sensors have been produced and applied in recent years, including ProOceanus company's mini CO2 sensor (Pro Oceanus, 2021a), Solu-Blu CO2 probe (Pro Oceanus, 2021b), and Turner-Designs company's C-Sense probe (Turner Designs, 2021), among others.
Commercial CO2 sensors play an important role in in-situ measurements based on various underwater platforms. Take the Contros HydroCTM/CO2 sensor, for example. In 2011, Fietzek et al. (2011) improved the HydroCTM (CO2/CH4) sensors and successfully deployed them on a variety of fixed and mobile platforms, including water sampler rosette, surface drifter measuring platform, large research Autonomous Underwater Vehicle (AUV), small lander, profile float, ultra-heavy duty remote operated vehicle (ROV), and more, demonstrating the feasibility of the use of this series of sensors on underwater platforms. In 2013, Fiedler et al. (2013) fixed a HydroCTM/CO2 sensor equipped with an SBE 5M pump on an Argo-type profiling float, and carried out four consecutive deployments with regular pCO2 sensor zeroings near the Cape Verde Ocean Observatory (CVOO) in the eastern tropical North Atlantic. In 2015, Hu et al. (2015) measured in-situ CO2 concentrations dissolved in seawater near the hydrothermal vent (within ten meters from the seafloor) in the mid-Okinawa Trough using HydroCTM (CO2) sensors based on the ROV, and the results showed that the maximum values of CO2 as high as 12 000×10-6 occur near active hydrothermal vents in Iheya North area. In 2020, Totland et al. (2020) carried out submarine CO2 leakage detection using the HydroCTM/CO2 sensor deployed on an AUV, although the response of the sensor was too slow (about 2 min with the pump) to satisfy the fast-moving measurement requirements of the AUV through the plume (about 10–15 s), so no significant change of pCO2 was directly detected. Apart from the above mentioned, other commercial sensors have also been widely used in in-situ CO2 measurements. For example, in 2018, Park and Chung (2018) carried the Pro-Mini CO2 sensor on a buoy to study the pCO2 dynamics of a stratified reservoir in a temperate zone, and CO2 pulse emissions during turnover events.
In addition to commercial sensors, there are also some home-made sensors for use in specific environments. For example, Blackstock et al. (2019) developed a low-cost (US$250–300) Arduino monitoring platform (CO2-LAMP) for recording CO2 variability in electronically harsh conditions: humid air, soil, and aquatic environments. A relatively inexpensive CO2 gas analyzer was waterproofed using a semi-permeable, expanded polytetrafluoroethylene membrane without additional support and putted in a plastic case housing. The performance and parameters of the CO2-LAMP for detecting the dissolved CO2 are shown in Table 1. The CO2-LAMP was deployed at Blowing Springs Cave, and operated alongside a relatively greater-cost CO2 monitoring platform. Over the monitoring period, measured values between the two systems covaried linearly (R2=0.99 for cave stream dissolved CO2). Although the CO2-LAMP has a good performance in the field measurement, it can not withstand higher hydrostatic pressure due to its simple packaging, and can not accurately rapidly measure microvariations of the CO2 concentration due to its low precision and long response time (Blackstock et al., 2019).
With the development and wide application of new underwater vehicles, such as AUVs, gliders, Argo Floats, and so forth, the acquisition of CO2 data with spatial and temporal variability has become more convenient, and new requirements for in-situ CO2 sensors have emerged in response. In order to be suitable for these cable-less underwater vehicles, the sensor must fulfill several requirements: (1) low production cost; (2) low power consumption and long-term operation ability; (3) small size; (4) robust against pressure (Fritzsche et al., 2018). Among these requirements, the production cost of the CO2 sensor is an important consideration, especially for disposable floats or multi-point simultaneous measurement. The commercial sensors mentioned above have good performances for in-situ CO2 measurements, as shown as Table 1, however the price of these commercial sensors is expensive (much more than US$10 000); consequently, it is difficult to be used as disposable sensors or for multi-point simultaneous measurement. According to the Defense Advanced Research Program Agency (DARPA) Ocean of Things (OoT) program (Waterston et al., 2019), sensors with a small size, low power, and low cost will be the trend in near future. In order to fulfill these requirements for these new platforms and programs, realizing observations of large-scale, long-term measurements of dissolved CO2 in seawater, a CO2 sensor with low power consumption, a small size, acceptable measurement accuracy, and a price of less than US$1 000 would be a good choice. In this paper, a miniature, low power consumption, low cost in-situ CO2 sensor based on a membrane and non-dispersive infrared (NDIR) technology was developed. Both laboratory experiments and field experiments were undertaken for the CO2 sensor performance evaluation.
Due to the particularity of in-situ detection of dissolved CO2 in seawater, it is necessary to consider the sensor as a whole in order to improve its adaptability. The configuration of the newly developed CO2 sensor is shown in Fig. 1. The sensor includes three parts: gas-liquid separation, gas detection, and electronics. The CO2 detection part and electronic part are packaged in a pressure vessel. A permeable membrane for gas-liquid separation is installed in the front end cap of the vessel, and an 8-pin connecting port is installed in the rear end cap of the vessel.

|
| Fig.1 Structure diagram (a) and photograph (b) of the newly developed CO2 sensor |
In order to achieve the accuracy of the long-term measurement data, a high-precision CO2 detector and a temperature, humidity, and pressure sensor were selected. The CO2 detector (NE Sensor Technologies, Ltd, 7NE/CO2), based on NDIR technology with a 2 000×10-6 full scale detection range and 1×10⁻⁶ resolution, has good selectivity and no oxygen dependence. It has an inner optical cavity with multiple reflection structures and dual-channel detectors. This cavity can achieve spatial dual optical path reference compensation, leading to a stable performance and small fluctuations for CO2 detection. In addition, the CO2 detector is compensated by temperature (0–50 ℃). The temperature of seawater ranges from 0 to 30 ℃ approximately. In practical applications, the heat inside the in-situ CO2 sensor is constantly exchanged with the heat in the seawater surrounding the sensor. Considering the heat dissipation of the devices, the temperature inside the sensor is approximately 5–35 ℃, within the temperature compensation range, so the selected CO2 detector is suitable for our application requirement, and does not need extra temperature correction theoretically. In addition, the detector measures the CO2 absorption band at 4.3 μm, while water vapor has no absorption at 4.3 μm, so it is not affected by humidity theoretically. The high-precision temperature, humidity, and pressure sensor (BOSCH, BME680) was used to monitor the condition inside the in-situ sensor and correct the data from the CO2 detector. Its temperature measurement range is 0–65 ℃, with an accuracy of ±1 ℃ and a resolution of 0.01 ℃; the humidity measurement range is 20%–80% relative humidity (RH), with an accuracy of ±3%RH and a resolution of 0.008%RH; the pressure measurement range is 300 to 1 100 hPa, with an accuracy of 0.6 hPa and a resolution of 0.18 Pa. Furthermore, the compact structure and size of the CO2 detector and temperature, humidity, and pressure sensor are suitable for underwater sensor encapsulation, to maximize the utilization of space inside the sensor.
2.1.2 ElectronicsIn order to obtain data with a high spatial and temporal resolution, a high sampling frequency can be set as 1 Hz (1 s). However, for uncabled platforms such as buoys, it is difficult to send data in real time to a shore-based system, so a data storage module is essential. The connection of each module inside the sensor is shown in Fig. 2. The STM32 module, as the main controller of the sensor, records the time from the real time clock (RTC) module, environmental parameters (temperature, humidity, and pressure), and CO2 concentration into the trans flash (TF) card for storage through the serial peripheral interface (SPI) bus. The communication module converts transistor-transistor logic (TTL) to the RS232 to obtain more stable and reliable data. Each data will be recorded and saved as the format of "xxxx/xx/xx xx: xx: xx xx.xx degC xxxxxx.xx Pa xx.xx%RH xxxx ppm" with the capacity of 66 bytes. Thus, it can be calculated that if the sensor works continuously for 1 year with the sampling frequency of 1 s, the data will just take up 1.94 GB of storage space. The TF card selected here has a data reading speed of up to 100 Mb/s and a total capacity of 16 Gb, which fully meets the requirements of high-frequency continuous long-term observation. The power conversion module was used to avoid the situation where the sensor would not work normally due to an excessive cable pressure drop. As a result, the CO2 sensor has two working modes: interactive mode and automatic mode. When working in the interactive mode, the obtained data is directly stored and displayed in the deck computer via a waterproof cable, and the data is also stored inside as a backup. When working in the automatic mode, an additional pressure vessel with 12-V batteries inside was used for the power supply, and the CO2 sensor operates intermittently according to the initial setup. Considering the integration of these modules above, the electronic part with a 50-mm long by 50-mm diameter was developed.

|
| Fig.2 Connection diagram of each module inside the sensor RTC: real time clock; TF: trans flash; SPI: serial peripheral interface; TTL: transistor-transistor logic. |
The response time of the sensor is an important parameter for underwater in-situ measurement. Although the change of CO2 concentration is a slow process which will be no sudden change in a short time for fixed-point long-term measurement in seawater. In order to measure the CO2 concentration in real time and accurately, the response time should be as short as possible without affecting other parameters and performance. The response time of the sensor depends on several factors, including the gas-liquid separation efficiency of the membrane, the time for gas to fill the chamber, and the response time of the CO2 detector. In order to improve the efficiency of gas-liquid separation, the effective area of the permeable membrane should be enlarged as much as possible. To realize the measurement of dissolved CO2 in water, a 70-μm thickness Teflon AF2400 membrane with good permeability to CO2 was selected (Biogeneral, 2021). Its high mechanical strength and slight pressure effect make it very suitable for measuring dissolved CO2 in seawater. Teflon amorphous fluoropolymer (AF) membrane has good compressive resistance, the hydrostatic pressure on the outside of the membrane has little effect on the pressure on the inside (Chua et al., 2016), so the CO2 detector does not need pressure correction. However, the larger the effective area of the permeable membrane, it is the easier to rupture because of the influence of external liquid pressure underwater, so the effective area of the permeable membrane should be suitable, and a sintered stainless steel plate was included to support the membrane. Considering the size of the CO2 detector and a shorter response time, the effective diameter of the membrane is designed to be 34 mm, which is consistent with the diameter of the internal CO2 detector.
In addition, the aperture and thickness of the sintered metal plate will not only affect the time for gas penetration, but also affect its compression resistance. The aperture of the sintered metal plate is usually 0.22–100 μm. The larger the aperture is, the rougher the surface of the sintered metal plate is, and the more easily the membrane is damaged. The smaller the aperture is, the longer the time for the gas to pass through the metal plate, and the slower the overall sensor response. Therefore, a sintered stainless steel plate with a moderate diameter of 50 μm was selected.
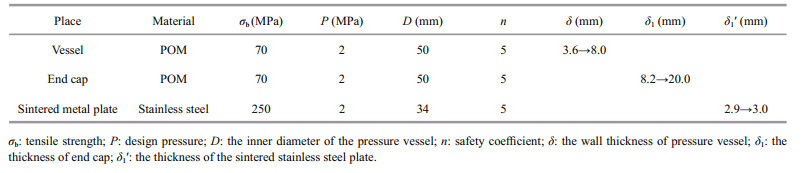
According to the parameters such as design pressure, inner diameter of the pressure vessel and tensile strength of the material, the size of the corresponding pressure vessel and the thickness of the sintered metal plate can be designed. The wall thickness δ of the pressure vessel can be calculated by Eq.1, and the thickness of the end cap δ1 and the thickness of the sintered metal plate δ1′ can be calculated by Eq.2 (Cheng, 2008).
 (1)
(1)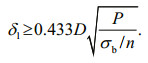 (2)
(2)In the equayion, δ is the wall thickness of the pressure vessel (mm), δ1 is the thickness of the end cap (mm), P is the design pressure (MPa), D is the inner diameter of the pressure vessel (mm), σb is the tensile strength (MPa), and n is the safety coefficient.
It should be noted that δ and δ1 depends on the size of the electronic module (D=50 mm), while δ1′ depends on the diameter of the CO2 detector (D=34 mm). As shown in Table 2, if the material is polyoxymethylene (POM) whose tensile strength is 70 MPa, and the stress resistance of pressure vessel is 2 MPa (water depth is ~200 m), the wall thickness δ should be no less than 3.6 mm, and the thickness of the end cap δ1 should be no less than 8.2 mm under 5 times the safety factor by formula calculation. To facilitate the fixing of the end cap and the pressure vessel, the thickness of the pressure vessel δ is thickened to 8.0 mm, thus the diameter of the pressure vessel is 66 mm. To fit the waterproof connector, the thickness of the end cap δ1 is thickened to 20.0 mm, as same as the screw thread length of the waterproof connector. Since the tensile strength of the permeable membrane which material is Teflon and sintered metal plate are unknown, it is impossible to accurately calculate the specific correspondence between the effective diameter of the membrane and the thickness of the sintered metal plate through the formula. As a result, we use half of the tensile strength of 316L stainless steel (500 MPa) to estimate the tensile strength of the sintered stainless steel plate (250 MPa). According to Eq.2, the thickness of the sintered stainless steel plate δ1′ should be no less than 2.9 mm under 5 times the safety factor, so it was designed as 3.0 mm. Considering the length of the inner devices, the total length of the pressure cabin is 124 mm. Then, a corresponding pressure cabin was made, and the success of the pressure test proved that it could withstand underwater pressure of 2 MPa.
The size and weight of each part are shown in Table 3. The total weight is 0.7 kg in air and 0.25 kg in water. The power consumption of the sensor is below 0.9 W. Although the membrane material with high permeability and the CO2 detector with high precision were chosen, the cost of the newly developed in-situ sensor was kept under US$1 000, about a twentieth to thirtieth of the price of similar commercial sensors shown in Table 1 (except MAPCO2).

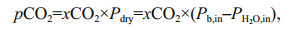
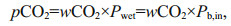
While measuring the concentration of dissolved CO2 in seawater, it is necessary that convert the concentration from the gas-phase to the aqueousphase. For the special case of this sensor, the gasphase concentration (xCO2, ×10-6) in the gas cell could be expressed in terms of partial pressure in the gas-phase (pCO2, μatm) whilst under equilibrium state using the Eq.3 or Eq.3′ (Weiss, 1974; Takahashi et al., 2009; Wu et al., 2021).
 (3)
(3) (3')
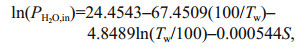
(3')where xCO2 is the CO2 mole fraction in dry gas that equilibrated with water sample and the barometric pressure (Pb, in, μatm) in gas cell after correcting for the vapor pressure (PH2O, in, μatm) at 100% relative humidity (Wu et al., 2021). wCO2 is the CO2 mole fraction in wet gas, can be obtained through the CO2 detector encapsulated in the sensor. In addition, the value of the vapor partial pressure is calculated by Eq.4 at in-situ temperature (Tw, K) and salinity (S) (Weiss and Price, 1980). Finally, the concentration of CO2 dissolved in the seawater (CO2(aq)) can be acquired by Eq.5 (Johnson, 1999; Pro Oceanus, 2019; Zhang et al., 2021).
 (4)
(4)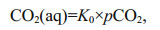 (5)
(5)where the solubility coefficient (K0, mol/(kg∙atm)) is the function of in-situ temperature (Tw, K) and the insitu salinity (S), and it can be obtained using the Eq.6 (Weiss, 1974).
 (6)
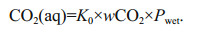
(6)In summary, to calculate the concentration of dissolved CO2 in seawater, the solubility and partial pressure of the gas are required to be known. The gas solubility can be calculated by Eq.6, seawater temperature Tw and S, and the partial pressure of CO2 can be calculated by Eq.3′, measured value of the CO2 detector wCO2 and measured value of the pressure sensor Pwet. The concentration of dissolved CO2 in seawater can be calculated by the Eq.7.
 (7)
(7)To test the long-term measuring ability of the newly developed in-situ CO2 sensor, in the first place the performances of the CO2 detector based on NDIR technology were evaluated in the laboratory, including the experiments of its accuracy, linearity, response time and precision by different concentration of CO2 standard gas, evaluation of its temperature compensation effect, and verification of the issue that if the changes in humidity will affect its measured values. Then the in-situ CO2 sensor and similar commercial instruments were placed in the pool for comparison to verify the overall measurement accuracy and precision of the sensor. Finally, a longterm nearshore experiment was carried out, and the data of the in-situ CO2 sensor were analyzed reasonably through the changes of seawater temperature and tide, so as to verify the actual long-term measurement ability of the newly developed in-situ CO2 sensor. The following content will introduce the experiment process and analyze the results one by one.
3.1 Calibration experimentThe newly developed CO2 sensor was calibrated in the laboratory with a series of different concentrations of dry and certified standard CO2 gases, including 0×10-6, 202.8×10⁻⁶, 398×10-6, 503×10-6, 601×10-6, 808×10-6, 1 006×10-6, and 2 019×10-6. As the CO2 sensor is passive diffusion type, a gas chamber with a sealing ring was installed on the front end cover of the sensor before the experiments. Each standard gas was flushed into the gas chamber with flow of 400 mL/min by a mass flow controller (Flows Instruments Co. Ltd., AIR-500sccm-b01) to keep the pressure in the gas chamber at about 1 atm. The time intervals between each gas concentration are 10 min or so, and each measured value of the sensor is recorded per second to evaluate the response time. Figure 3 is the results of the calibration experiments. The dynamic measurement results for different gas concentrations are shown in Fig. 3a, from which we can see that the dynamic responses for gas concentration changing are fast. For example, we can see the sensor took the same 15 s from air to reach 63% of the step change of 0×10-6 and from 503×10-6 to reach 63% of the step change of 601×10-6 (τ63=15 s by exponential function fitting). The calibration curve between the measured values and the actual values of different concentrations is shown in Fig. 3b, in which the actual values (abscissa) are the standard gas concentrations, the measured values (ordinate) are the measured mean values of each concentration, and the corresponding standard deviations are expressed as the light blue error bar. From Fig. 3b we can see that the measured values of the newly developed CO2 sensor and the actual values has a good linear correlation, with R2=0.99 over the range of (0–2 000)×10-6.

|
| Fig.3 Calibration results of the newly developed CO2 sensor with standard gases of different concentrations a. dynamic responses for different gas concentrations, τ63 is the time taken for the signal to reach 63% of the next concentration span; b. calibration curve between real values and measured values. The corresponding standard deviations are expressed as the light blue error bar. |
To evaluate the measurement precision of the CO2 sensor, one-hour continuous measurements were performed with a 528×10-6 CO2 standard gas. The standard gas was flushed into the gas chamber with flow of 400 mL/min by a mass flow controller for 5 min, and then two valves on the gas chamber were closed to keep the concentration of CO2 gas in chamber constantly. The precision experimental results are shown in Fig. 4. For clarity, the scatter plots have been converted into a frequency distribution histogram, which is fitted using a Gaussian function. From Fig. 4a, we can see that the concentration values are mainly distributed in the range of (528.28±5.16)×10-6. From Fig. 4b, we can see that the frequency distribution of concentration value shows a roughly normal distribution. Taking the ratio of the half width at half maximum (HWHM) to the average concentration value as the precision, we obtain a precision of 0.98% for the CO2 sensor at a sampling rate of 1 s.

|
| Fig.4 Continuous monitoring of 528.28×10⁻⁶ CO2 with a duration of 60 min a. measured concentration values with 1-s intervals; b. histogram and Gaussian distribution. |
As what mentioned before, although the adopted CO2 detector theoretically does not need temperature and humidity correction, some experiments were still carried out for evaluation and verification. The data from the CO2 detector with temperature change were measured firstly, to evaluate the temperature compensation effect. The CO2 detector was placed in the climate chamber (Vötschtechnik, VC3 7034). The humidity in the chamber was set at a constant value of 70%RH, and the temperature was set to decrease gradually from 40 ℃ to 10 ℃, to observe if the data from the CO2 detector change. The temperature and the data from CO2 detector in the chamber are shown in the Fig. 5. The blanks in the temperature and CO2 data were caused by an accidental power failure. It can be seen from Fig. 5 that with the increase of temperature, the data from the CO2 detector almost have no change. Therefore, it is proved that the adopted CO2 detector has excellent temperature compensation effect, and does not need extra temperature correction practically.

|
| Fig.5 The evaluation of the temperature compensation effect of the CO2 detector |
Since long-term measurements in seawater will inevitably lead to an increase in humidity inside the in-situ CO2 sensor, we conducted simulation tests in the laboratory. The in-situ CO2 sensor was placed in a sealed tank filled with water to test the humidity change inside the sensor. After determining the range of humidity variation, the influence of humidity on the data from the CO2 detector was evaluated. The CO2 detector was placed in the climate chamber mentioned above. The temperature in the chamber was set at a constant value, and the humidity was set according to the range of humidity variation in the last test, to observe the changes in the data from the CO2 detector. The test of the humidity change inside the sensor lasted for about 5 days with the sampling frequency of 1 s, and the results are shown in Fig. 6a from which we can see that the humidity inside the CO2 sensor shows an exponential growth trend, and it can be predicted that the humidity will stabilize at 68.17%RH through exponential fitting. Next, the temperature in the chamber was set at 10 ℃ constantly, and the humidity was set at 10%RH, 30%RH, 50%RH, and 70%RH, respectively, to observe the changes in the data from the CO2 detector. The humidity and the data from CO2 detector in the chamber are shown in the Fig. 6b. It can be seen that with the increase of humidity, the data from the CO2 detector fluctuated within the range of (517.55±4.02)×10-6, without significant change. Therefore, it can be considered that humidity has no effect on the CO2 detector.

|
| Fig.6 The humidity change inside the sensor for a long-term test (a) and the influence of humidity on the data from the CO2 detector (b) |
After evaluating the basic performances of our CO2 sensor with standard gases, a 7-day stability measurement was carried out in a pool. A commercial CO2 sensor (Pro Oceanus, Mini CO2) was used simultaneously for comparison. The data of the newly developed sensor were recorded per second, and the data of commercial sensor were recorded per two seconds. Because the newly developed sensor and the commercial sensor have different sampling frequencies, to facilitate the comparison, we averaged the raw data from two sensors to one value per minute. The 7-day comparison results of the commercial sensor and the newly developed CO2 sensor are shown in Fig. 7, from which we can see the two sensors' results have good consistency, with R2 of 0.87. With the same NDIR principle, our CO2 sensor shows better precision compared with the commercial sensor. The results indicate our CO2 sensor has good stability for dissolved CO2 measurements in water.

|
| Fig.7 The 7-day comparison results between the newly developed CO2 sensor and the commercial CO2 sensor in the pool a. the measuring concentration change of the two CO2 sensors over time; b. the relationship between the two CO2 sensors. |
Field experiments were carried out at a depth of ~1 m in Qingdao nearshore waters from May 17, 2019 to June 21, 2019. The continuously 35-day CO2 concentration measurement results were obtained. Meanwhile, in order to make a reasonable explanation for the CO2 measurement results, the seawater temperature was detected by a commercial multiparameter water quality Sonde (YSI, EXO2). The 35- day CO2 concentration measurement results are shown in Fig. 8, and the tidal heights and seawater temperature data are also given. The tidal heights data observed at the Qingdao Station were downloaded from the China Maritime Services Network. Several blanks in the CO2 and temperature data were caused by accidental power failures, and equipment maintenance, especially biofouling checking and cleaning regularly to ensure the accuracy of the CO2 measurement results.

|
| Fig.8 The 35-day measurement results of the newly developed CO2 sensor, tidal heights data from the website, and seawater temperature data from the commercial sensor The orange background represents sunny and cloudy weather, the gray background represents overcast weather, and the blue background represents rainy weather. |
From the 35-day data, we can see an interesting phenomenon: the CO2 concentration showed a "double peak" distribution within a day, like a halfday tide. There is an obvious negative correlation between the CO2 concentration and the tidal heights. Figure 9 shows zoomed data in the week from June 4 to 11. Due to the field experiment location being in a dock in Qingdao, which is close to the city, the measured concentration of dissolved CO2 in coastal seawater is affected by hydrological (Takahashi et al., 1993; Wanninkhof et al., 2019), biological (Millero, 1995), surface runoff, and terrestrial input factors (Zhai et al., 2005). Therefore, it is very difficult to comprehensively explain the CO2 concentration data obtained from fixed-point observations in the Qingdao nearshore. The obvious correlation between the CO2 concentration and the tides, and the seawater temperature, needs to be explored further.

|
| Fig.9 Changes of the CO2 concentration, tidal heights, and seawater temperature within a week |
We speculate that the correlation between the CO2 concentration and the tidal height may be related to submarine groundwater discharge (SGD) because in coastal zones, SGD is an important pathway for terrestrial materials to be delivered into the sea (Moore, 1996; Burnett et al., 2006; Zhang et al., 2020). Dissolved inorganic carbon concentrations in groundwater are often much higher than those in surface waters, leading groundwater seepage plays a significant role in carbon budgets in aquatic ecosystems (Charette, 2007; Santos et al., 2012, 2019). SGD fluxes usually show an inversely correlated pattern with the tides (Burnett and Dulaiova, 2003); we therefore speculate the semidiurnal pattern of CO2 we observed was possibly caused by the SGD process in the studied coastal zone. As to the relative correlation between the CO2 concentration and the seawater temperature, we speculate that this phenomenon is related to the solubility of CO2 in seawater. With the increase (or decrease) of the seawater temperature, the solubility of CO2 decreases (or increases), leading to a decrease (or increase) of the CO2 concentration in seawater. It also can be affected by the weather, because the sensors were located close to the sea surface. For example, on June 6, there was a heavy rain/shower accompanied by a southeast wind of magnitude 6–7. The rain brought CO2 in the air into the sea water. As the CO2 concentration in the air is usually lower than that in the sea water, and the strong wind accelerated the mixing of air and the sea surface, the intraday CO2 concentration on the sea surface showed an overall downward trend. In addition, rainfall will enrich the groundwater and promote the discharge of groundwater into the sea. However, this process takes a period of time, so the CO2 concentration on the sea surface showed an upward trend during the period after the rain stopped (June 7–8).
The 35-day field experiment proved the performance of the newly developed CO2 sensor. It can be seen that our sensor measured the dynamic changes of the CO2 concentration in seawater continuously, and had the potential to carry out longterm observations on an oceanic platform.
4 CONCLUSIONIn order to realize the miniaturization, low power consumption, and low cost of in-situ CO2 sensors in the ocean, we developed a CO2 sensor based on a permeable membrane and NDIR technology in this paper. The sensor has small dimensions (Ф66 mm× 124 mm), low power consumption (< 0.9 W), a light weight (0.7 kg in air and 0.25 kg in water), low cost (< US$1 000), and high pressure tolerance (< 200 m). It is suitable for a variety of offshore platforms and mobile platforms in the sea. After laboratory performance tests, the sensor showed a measurement range of (0–2 000)×10-6, and the gas linear correlation R2 was 0.99, with a precision of about 0.98%. To evaluate the performance of the newly developed sensor, a comparison measurement was carried out with a commercial sensor in a pool for seven days. The experimental results showed consistent trends, and our CO2 sensor showed better precision compared with the commercial sensor. The newly developed sensor was also deployed in seawater at a depth of ~1 m in the Qingdao nearshore for 35 days. Some interesting phenomena were found from the results of the field experiment, and some reasonable explanations for these were given. The experiment proved that the newly developed sensor could measure the dynamic changes of CO2 concentration in seawater continuously, and had the potential to carry out longterm observations on an oceanic platform. It is hoped that the sensor could be applied to field ocean observations in near future.
5 DATA AVAILABILITY STATEMENTThe datasets generated during and/or analyzed during the current study are available from the corresponding author on reasonable request.
6 ACKNOWLEDGMENTThe authors would like to thank Wangquan YE and Ning LI for their helpful discussion of the experiments, and thank the Institute of Oceanographic Institution, Shandong Academy of Sciences for providing the sea trial platform.
Bindoff N L, Cheung W W L, Kairo J G, Arístegui J, Guinder V A, Hallberg R, Hilmi N, Jiao N, Karim M S, Levin L, O'Donoghue S, Cuicapusa S R P, Rinkevich B, Suga T, Tagliabue A and Williamson P. 2019. Changing ocean, marine ecosystems, and dependent communities. In: IPCC Special Report on the Ocean and Cryosphere in a Changing Climate. IPCC. p. 477-587.
|
Biogeneral. 2021. Teflon™ AF 2400, https://www.biogeneral.com/teflon-af/.
|
Blackstock J M, Covington M D, Perne M, Myre J M. 2019. Monitoring atmospheric, soil, and dissolved CO2 using a low-cost, arduino monitoring platform (CO2-LAMP): theory, fabrication, and operation. Frontiers in Earth Science, 7: 313.
DOI:10.3389/feart.2019.00313 |
Burnett W C, Aggarwal P K, Aureli A, Bokuniewicz H, Cable J E, Charette M A, Kontar E, Krupa S, Kulkarni K M, Loveless A, Moore W S, Oberdorfer J A, Oliveira J, Ozyurt N, Povinec P, Privitera A M G, Rajar R, Ramessur R T, Scholten J, Stieglitz T, Taniguchi M, Turner J V. 2006. Quantifying submarine groundwater discharge in the coastal zone via multiple methods. Science of the Total Environment, 367(2-3): 498-543.
DOI:10.1016/j.scitotenv.2006.05.009 |
Burnett W C, Dulaiova H. 2003. Estimating the dynamics of groundwater input into the coastal zone via continuous radon-222 measurements. Journal of Environmental Radioactivity, 69(1-2): 21-35.
DOI:10.1016/S0265-931X(03)00084-5 |
Charette M A. 2007. Hydrologic forcing of submarine groundwater discharge: insight from a seasonal study of radium isotopes in a groundwater-dominated salt marsh estuary. Limnology and Oceanography, 52(1): 230-239.
DOI:10.4319/lo.2007.52.1.0230 |
Cheng D X. 2008. Handbook of Mechanical Design. 5th edn. Chemical Industry Press, Beijing, China. p. 310-311. (in Chinese)
|
Chua E J, Savidge W, Short R T, Cardenas-Valencia A M, Fulweiler R W. 2016. A review of the emerging field of underwater mass spectrometry. Frontiers in Marine Science, 3: 209.
DOI:10.3389/fmars.2016.00209 |
Clarke J S, Achterberg E P, Connelly D P, Schuster U, Mowlem M. 2017. Developments in marine pCO2 measurement technology; towards sustained in situ observations. TrAC Trends in Analytical Chemistry, 88: 53-61.
DOI:10.1016/j.trac.2016.12.008 |
Fiedler B, Fietzek P, Vieira N, Silva P, Bittig H C, Körtzinger A. 2013. In situ CO2 and O2 measurements on a profiling float. Journal of Atmospheric and Oceanic Technology, 30(1): 112-126.
DOI:10.1175/JTECH-D-12-00043.1 |
Fietzek P, Kramer S, Esser D. 2011. Deployments of the HydroCTM (CO2/CH4) on stationary and mobile platforms - Merging trends in the field of platform and sensor development. In: OCEANS'11 MTS/IEEE KONA. IEEE, Waikoloa, HI, USA. p. 1-9, https://doi.org/10.23919/OCEANS.2011.6107129.
|
Fritzsche E, Staudinger C, Fischer J P, Thar R, Jannasch H W, Plant J N, Blum M, Massion G, Thomas H, Hoech J, Johnson K S, Borisov S M, Klimant I. 2018. A validation and comparison study of new, compact, versatile optodes for oxygen, pH and carbon dioxide in marine environments. Marine Chemistry, 207: 63-76.
DOI:10.1016/j.marchem.2018.10.009 |
Hu Q N, Zhang X, Wang B, Wang C B, Luan Z D, Chen C, Yan J. 2015. In situ detection of CO2/CH4 dissolved in vent-associated seawater at the CLAM and Iheya North hydrothermal vents area, Okinawa Trough. In: OCEANS 2015-Genova. IEEE, Genova, Italy. p. 1-6, https://doi.org/10.1109/OCEANS-Genova.2015.7271436.
|
Johnson J E. 1999. Evaluation of a seawater equilibrator for shipboard analysis of dissolved oceanic trace gases. Analytica Chimica Acta, 395(1-2): 119-132.
DOI:10.1016/S0003-2670(99)00361-X |
Millero F J. 1995. Thermodynamics of the carbon dioxide system in the oceans. Geochimica et Cosmochimica Acta, 59(4): 661-677.
DOI:10.1016/0016-7037(94)00354-O |
Moore W S. 1996. Large groundwater inputs to coastal waters revealed by 226Ra enrichments. Nature, 380(6575): 612-614.
DOI:10.1038/380612a0 |
Park H, Chung S. 2018. pCO2 dynamics of stratified reservoir in temperate zone and CO2 pulse emissions during turnover events. Water, 10(10): 1347.
DOI:10.3390/w10101347 |
Pro Oceanus. 2019. Technical note 1.1: dissolved CO2 and units of measurement. https://pro-oceanus.com/images/pdf/PSITechnicalNote1.1-DissolvedCO2andUnitsofMeasurement2019.pdf. Accessed on 2021-02-08.
|
Pro Oceanus. 2021a. Mini CO2 Submersible pCO2 Sensor. https://pro-oceanus.com/products/mini-series/mini-co2. Accessed on 2021-02-08.
|
Pro Oceanus. 2021b. Solu-Blu™ Dissolved CO2 Probe. https://pro-oceanus.com/products/solu-blu-series/solu-blu-co2. Accessed on 2021-02-08.
|
Santos I R, Maher D T, Eyre B D. 2012. Coupling automated radon and carbon dioxide measurements in coastal waters. Environmental Science and Technology, 46(14): 7685-7691.
DOI:10.1021/es301961b |
Santos I R, Maher D T, Larkin R, Webb J R, Sanders C J. 2019. Carbon outwelling and outgassing vs. burial in an estuarine tidal creek surrounded by mangrove and saltmarsh wetlands. Limnology and Oceanography, 64(3): 996-1013.
DOI:10.1002/lno.11090 |
Schar D, Atkinson M, Johengen T, Pinchuk A, Purcell H, Robertson C, Smith G J and Tamburri M. 2009a. Performance Demonstration Statement Pro-Oceanus Systems Inc. PSI CO2-ProTM. Alliance for Coastal Technologies, Solomons, MD, https://doi.org/10.25607/OBP-343.
|
Schar D, Atkinson M, Johengen T, Pinchuk A, Purcell H, Robertson C, Smith G J and Tamburri M. 2009b. Performance Demonstration Statement Contros HydroCTM/CO2. Alliance for Coastal Technology, Solomons, MD, https://doi.org/10.25607/OBP-341.
|
Schar D, Atkinson M, Johengen T, PinchukA, Purcell H, Robertson C, Smith G J and Tamburri M. 2009c. Performance Demonstration Statement PMEL MAPCO2/Battelle Seaology pCO2 Monitoring System. Alliance for Coastal Technology, Solomons, MD, https://doi.org/10.25607/OBP-342.
|
Schar D, Atkinson M, Johengen T, Pinchuk A, Purcell H, Robertson C, Smith G J and Tamburri M. 2009d. Performance Demonstration Statement Sunburst Sensors SAMI-CO2. Alliance for Coastal Technology, Solomons, MD, https://doi.org/10.25607/OBP-344.
|
Takahashi T, Olafsson J, Goddard J G, Chipman D W, Sutherland S C. 1993. Seasonal variation of CO2 and nutrients in the high-latitude surface oceans: a comparative study. Global Biogeochemical Cycles, 7(4): 843-878.
DOI:10.1029/93GB02263 |
Takahashi T, Sutherland S C, Wanninkhof R, Sweeney C, Feely R A, Chipman D W, Hales B, Friederich G, Chavez F, Sabine C, Watson A, Bakker D C E, Schuster U, Metzl N, Yoshikawa-Inoue H, Ishii M, Midorikawa T, Nojiri Y, Körtzinger A, Steinhoff T, Hoppema M, Olafsson J, Arnarson T S, Tilbrook B, Johannessen T, Olsen A, Bellerby R, Wong C S, Delille B, Bates N R, De Baar H J W. 2009. Climatological mean and decadal change in surface ocean pCO2, and net sea-air CO2 flux over the global oceans. Deep Sea Research Part II: Topical Studies in Oceanography, 56(8-10): 554-577.
DOI:10.1016/j.dsr2.2008.12.009 |
Tamburri M N, Johengen T H, Atkinson M J, Schar D W H, Robertson C Y, Purcell H, Smith G J, Pinchuk A, Buckley E N. 2011. Alliance for coastal technologies: advancing moored pCO2 instruments in coastal waters. Marine Technology Society Journal, 45(1): 43-51.
DOI:10.4031/MTSJ.45.1.4 |
Totland C, Eek E, Blomberg A E A, Waarum I K, Fietzek P, Walta A. 2020. The correlation between pO2 and pCO2 as a chemical marker for detection of off shore CO2 leakage. International Journal of Greenhouse Gas Control, 99: 103085.
DOI:10.1016/j.ijggc.2020.103085 |
Turner Designs. 2021. C-sense in situ pCO2 Sensor. https://www.turnerdesigns.com/c-sense-in-situ-pco2-sensor. Accessed on 2021-02-08.
|
Wanninkhof R, Pickers P A, Omar A M, Sutton A, Murata A, Olsen A, Stephens B B, Tilbrook B, Munro D, Pierrot D, Rehder G, Santana-Casiano J M, Müller J D, Trinanes J, Tedesco K, O'brien K, Currie K, Barbero L, Telszewski M, Hoppema M, Ishii M, González-Dávila M, Bates N R, Metzl N, Suntharalingam P, Feely R A, Nakaoka S I, Lauvset S K, Takahashi T, Steinhoff T, Schuster U. 2019. A surface ocean CO2 reference network, SOCONET and associated marine boundary layer CO2 measurements. Frontiers in Marine Science, 6: 400.
DOI:10.3389/fmars.2019.00400 |
Waterston J, Rhea J, Peterson S, Bolick L, Ayers J, Ellen J. 2019. Ocean of things: aff ordable maritime sensors with scalable analysis. In: OCEANS 2019-Marseille. IEEE, Marseille, France. p. 1-6, https://doi.org/10.1109/OCEANSE.2019.8867398.
|
Weiss R F, Price B A. 1980. Nitrous oxide solubility in water and seawater. Marine Chemistry, 8(4): 347-359.
DOI:10.1016/0304-4203(80)90024-9 |
Weiss R F. 1974. Carbon dioxide in water and seawater: the solubility of a non-ideal gas. Marine Chemistry, 2(3): 203-215.
DOI:10.1016/0304-4203(74)90015-2 |
Wu Y X, Dai M H, Guo X H, Chen J S, Xu Y, Dong X, Dai J W, Zhang Z R. 2021. High-frequency time-series autonomous observations of sea surface pCO2 and pH. Limnology and Oceanography, 66(3): 588-606.
DOI:10.1002/lno.11625 |
Yin J P, Wang Y S, Xu J R, Sun S. 2006. Adavances of studies on marine carbon cycle. Acta Ecologica Sinica, 26(2): 566-575.
(in Chinese with English abstract) |
Zhai W D, Dai M H, Cai W J, Wang Y C, Wang Z H. 2005. High partial pressure of CO2 and its maintaining mechanism in a subtropical estuary: the Pearl River estuary, China. Marine Chemistry, 93(1): 21-32.
DOI:10.1016/j.marchem.2004.07.003 |
Zhang Y, Santos I R, Li H L, Wang Q Q, Xiao K, Guo H M, Wang X J. 2020. Submarine groundwater discharge drives coastal water quality and nutrient budgets at small and large scales. Geochimica et Cosmochimica Acta, 290: 201-215.
DOI:10.1016/j.gca.2020.08.026 |
Zhang Z H, Li M, Guo J J, Du B L, Zheng R E. 2021. A portable tunable diode laser absorption spectroscopy system for dissolved CO2 detection using a high-efficiency headspace equilibrator. Sensors, 21(5): 1723.
DOI:10.3390/s21051723 |