 2022, Vol. 40
Institute of Oceanology, Chinese Academy of Sciences
Article Information
- YOU Jia, XU Zhenhua, ROBERTSON Robin, LI Qun, YIN Baoshu
- Geographical inhomogeneity and temporal variability of mixing property and driving mechanism in the Arctic Ocean
- Journal of Oceanology and Limnology, 40(3): 846-869
- http://dx.doi.org/10.1007/s00343-021-1037-6
Article History
- Received Jan. 28, 2021
- accepted in principle May. 12, 2021
- accepted for publication Jul. 28, 2021


2 Pilot National Laboratory for Marine Science and Technology (Qingdao), Qingdao 266237, China;
3 Center for Ocean Mega-Science, Chinese Academy of Sciences, Qingdao 266071, China;
4 College of Earth and Planetary Sciences, University of Chinese Academy of Sciences, Beijing 100049, China;
5 CAS Engineering Laboratory for Marine Ranching, Institute of Oceanology, Chinese Academy of Sciences, Qingdao 266071, China;
6 China-Asean College of Marine Science, Xiamen University Malaysia, Sepang 43900, Malaysia;
7 MNR Key Laboratory for Polar Science, Polar Research Institute of China, Shanghai 200120, China
Breaking internal waves can alter temperature and salinity gradients, both horizontally and vertically. In doing so, they drive water-mass exchange and contribute significantly to the diapycnal mixing required to maintain the global ocean circulation (Garrett and Munk, 1979; Wolanski et al., 2004; Xu et al., 2013, 2021). Coverage of mixing estimates either from direct microstructure observations or from parameterization is now becoming sufficient to provide global patterns of turbulent mixing with both spatial and temporal variability (parameterization: e.g., Whalen et al., 2012; observations: e.g., Waterman et al., 2013; Rippeth et al., 2015; Kunze, 2017). Nevertheless, there are gaps in the coverage, with one of the biggest gaps in the Arctic Ocean. This is due to the patchy, episodic, and scarce observations of mixing in the Arctic Ocean (e.g., Sundfjord et al., 2007; Kunze, 2017; Whalen et al., 2018). Consequently, the important role that mixing plays in water mass structure and circulation in the Arctic Ocean is not well known. Addressing this shortcoming and understanding mixing properties of the Arctic regions are clearly necessary for advancing both Arctic Ocean and global climate research. Therefore, our work will focus on two specific issues: the spatial pattern and temporal variability of mixing in the Arctic Ocean and the main driving mechanisms on these mixing properties.
The water column of Arctic Ocean is typically divided into three primary layers, including a near-surface layer with temperatures near freezing most of the year, a cold halocline, Atlantic Water, and a deeper layer (Rudels et al., 1996).The Pacific sector could have more layers due to the intrusion of the Pacific Water. The warm and salty Atlantic Water (AW, 200–900 m) is separated from the freezing near-surface layer by halocline (HL, often occurs in 50–200 m), resulting in strong stratification (e.g., Aagaard et al., 1981; Steel et al., 1995; Shimada et al., 2005; McLaughlin et al., 2009). This makes the Arctic Ocean different to the temperate and tropical ones. However, the stratification of the Arctic Ocean is highly variable, both temporally and horizontally (Rudels and Quadfasel, 1991; Pemberton et al., 2015). The relationship between such variable stratifications and the variability of mixing is still unclear.
The Arctic climate and environment have changed significantly in recent decades, especially sea ice, which has declined in extent, thickness (e.g., Rothrock et al., 2008; Stroeve et al., 2012; Lindsay and Schweiger, 2015), and the percentage of multiyear ice (e.g., Comiso, 2002; Lei et al., 2016; Bi et al., 2020). Simultaneously, sea ice drifted speeds have increased (Hakkinen et al., 2008). This points out that the Arctic Ocean entered a new state (Carmack et al., 2015; Polyakov et al., 2017). However, it is unclear how mixing will be influenced and modulated in this lower sea ice state.
The primary mixing mechanisms in the Arctic are wind, internal tides (e.g., Halle and Pinkel, 2003; Guthrie et al., 2013; Wang et al., 2021; Zhao et al., 2021), and double diffusion (e.g., Robertson, 1995; Ruddick and Gargett, 2003; Timmermans et al., 2008; Shibley et al., 2017; Fer et al., 2020). In the lower latitudes, internal tides can propagate a long-distance with low-mode and redistribute the mixing (e.g., Liu et al., 2017; Guo et al., 2018). Much of the Arctic is poleward of the critical latitude for the generation of a freely propagating internal tide, but there are two main kinds of internal waves that dissipate and drive the mixing in the Arctic: tidal lee-waves (e.g., Rippeth et al., 2017; Fer et al., 2020; Schulz et al., 2021a) and bottom-trapped internal waves (e.g., Falahat and Nycander, 2015; Hughes and Klymak, 2019). Although the tidal mixing is found over a much more limited area of the Arctic Ocean, the averaged heat flux from areas with tidal mixing is comparable to that supported by double diffusion (Fer et al., 2009, Fer et al., 2020). Near-inertial internal waves can be generated by the wind forcing at the atmosphere-ocean interface and can transfer wind energy downward until the breaking depth of internal wave (e.g., Hebert and Moum, 1994; Cole et al., 2014; Fer, 2014; Wang et al., 2014). Some works have provided the evidence of the enhancing near-inertial internal waves with decreasing sea ice (e.g., Lenn et al., 2011; Dosser and Rainville, 2016; Polyakov et al., 2020b). On the other hand, double diffusion and intrusions could play a bigger role in some regions with weak tide- and wind-induced mixing. Compared with other oceans, the Arctic Ocean is always viewed as a quiescent, weakly mixed ocean due to low turbulent energy levels (Rainville and Winsor, 2008). Mixing of the Arctic Ocean has been observed in some previous studies, and showed a highly variable pattern, reflecting the dominance of various mechanisms. For example, diapycnal diffusivities were found to be O(10-5–10-4) m2/s in Yermak Plateau (Fer et al., 2010), O(10-6–10-4) m2/s in Canadian Basin (Guthrie et al., 2013), and O(10-6–10-4) m2/s in the Amundsen Gulf (Chanona et al., 2018), indicating relatively weak mixing and high variability.
In the Arctic Ocean, near-inertial waves can also be generated by the motion of drifting sea ice or icebergs. The absence or presence of sea ice can profoundly affect the capability of the kinetic energy of nearinertial waves in driving vertical mixing (Lenn et al., 2011). As the sea ice extent declines, direct interaction between sea surface and wind is increasing (Manucharyan et al., 2016; Armitage et al., 2020). This is exacerbated by the recent enhancement of windstorms and sea ice drift speeds. Evidence underscores the growth of near-inertial motions in early winter after freezing (Merrifield and Pinkel, 1996; Halle and Pinkel, 2003). Dosser and Rainville (2016) suggested the increase in near-inertial waves through estimates of the near-inertial wave amplitudes in the Canadian Basin, the most significant decline region of sea ice extent. Thus, it is reasonable to anticipate a future enhancement of turbulent mixing in the upper ocean. However, some prior, direct microstructure observations portray continued quiescence in the Arctic Ocean interior (Lincoln et al., 2016). Whether the increasing internal wave generate stronger turbulence or not, and what their impacts on the changes of turbulent mixing and turbulent heat flux in the Arctic remain to be answered.
Stratification is also a critical factor in turbulent mixing. The sea ice will be melted when the heat is transferred from the warm AW to the typically cooler surface mixed layer (SML) by mixing. However, the mixing is usually suppressed by strong stratification. The impediment to this mixing is the cold halocline layer (CHL, Lenn et al., 2009). The recent reductions in sea ice coverage and a thinner CHL with weaker stratification will enhance the transfer of AW heat into the upper layer and significantly decrease the rate of sea ice formation in winter. This was found in the Eurasian Basin (Polyakov et al., 2017; 2020a). On one hand, a viewpoint suggested that this represents an essential step towards a new Arctic climate state (Carmack et al., 2015; Polyakov et al., 2017). On the other hand, McLaughlin et al. (2004) suggested that a strengthened stratification resulting from relatively fresh water from the Pacific Ocean at mid-depth (60–220 m) would limit the exchange between SML and AW. This view mainly focused on the Pacific sector. Chanona et al. (2018) suggested that turbulent mixing might still be restrained by strong stratification. They found that the strong stratification over the slope of Canadian Basin played an important role in mixing. It is still unknown that whether the mixing properties in the Atlantic sector and the Pacific sector are similar or not.
In recent decades, some studies focused on the mixing trend in the Arctic Ocean interior due to climatic variability of internal waves and stratification and the implications of these trends on the heat budget and sea ice predictions (e.g., Lique et al., 2014; Chanona et al., 2018). However, it was not clear whether internal waves significantly contribute to the mixing in the Arctic Ocean. A possibility to address this issue and discuss the mixing and its modulations in the Arctic Ocean are provided by Ice-Tethered Profiler (ITP)'s data set.
The spatial pattern and temporal variability of diapycnal diffusivities and dissipation rate in the Arctic were examined in this paper, and we reviewed some possible modulating factors for turbulent mixing, including wind, sea ice, stratification, and near-inertial waves. This paper is organized as follows. In Section 2, we described the ITP data set and our method of inferring the associated wave-driven turbulent diffusivity and kinetic energy dissipation rate. Our results, including horizontal maps, vertical structure, and seasonal and long-term variability of turbulent mixing of the Arctic, are shown in Section 3. In Section 4, we discussed the apparent roles of wind, sea ice, stratification, and near-inertial waves, which underpin the observed spatial and temporal patterns. In Section 5, the spatial pattern and temporal variability of heat flux are discussed. In addition, in Section 6, we summarized our works and conclusions.
2 DATA AND METHOD 2.1 Ice-tethered profiler (ITP)The primary dataset in this study was ice-tethered profiler (ITPs). The ITP data set was used to examine diapycnal diffusivities and dissipation rates over several main regions of the Arctic, including the Nansen, Amundsen, and Canadian Basin along with other seas. The data set covered 15 years from winter of 2004 to fall of 2019 (Fig. 1). ITPs are anchored in perennial ice floes by a surface buoy, and report potential temperature and conductivity at 1 Hz, as they profile from 7–750-m depth. The dataset we used in this paper is ITP level 3 product, which is provided by the ITP group and the Woods Hole Oceanographic Institution (www.whoi.edu/itp; Krishfield et al., 2008). Processing steps include identification and removal of unphysical data, corrections for pressure and sensor response behavior. The vertical sampling interval of the ITPs after averaging is 1 m. Typically ITPs measure the water column twice a day, with profiles beginning at 00:00 and 06:00 UTC.

|
| Fig.1 Location of profiles of Ice-Tethered Profiler (colored symbols) Gray symbols indicate discarded profiles due to double-diffusive staircases. The division of the Arctic Ocean into the Atlantic and Pacific sectors is indicated. |
We examined 79 798 ITP potential temperature and salinity profiles, discarding 18 078 invalid profiles (data missing or incomplete) and 34 276 profiles due to the existence of double-diffusive staircases (Fig. 1). Double-diffusive staircases are a widespread phenomenon, and generally common in the central Canadian Basin, Amundsen Basin, and Fram Strait (Timmermans et al., 2008; Bebieva and Timmermans, 2017; Shibley et al., 2017; Polyakov et al., 2019). In this paper, we focus on the region where the fine scale parameterization method is robust—most of the Eurasian basin and the low latitude region of the Canadian Basin. These available profiles were used to estimate diaypcnal diffusivities and dissipation rates in the Arctic Ocean. The temporal coverage of these data spans 15 years, with over 1 000 usable number of profiles in each year, with the exceptions of 2005 (105 profiles), 2006 (182 profiles), and 2018 (609 profiles).
2.2 Fine-scale parameterizationTo estimate diapycnal diffusivity kz and turbulent kinetic energy dissipation rate ε, a fine-scale parameterization was implemented. This method has been widely applied to measure turbulent mixing in global ocean, and applied to the Arctic in recent years (e.g., Fer et al., 2010; Guthrie et al., 2013; Lique et al., 2014; Kawaguchi et al., 2016; Chanona et al., 2018). Chanona et al. (2018) have verified the applicability of the strain-based fine-scale parameterization method based on the CTD dataset in the sub-region of Arctic Ocean, which motivated us to reveal a more comprehensive view of mixing properties in the whole Arctic Ocean, using the ITP data with a broader spatial coverage. This method is based on the hypothesis that energy can be transported from large scales to small scales, at which waves break due to shear or convective instabilities through weakly nonlinear interactions between internal waves (Kunze et al., 2006).
The dissipation rate ε can be expressed as
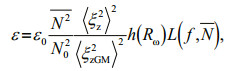 (1)
(1)where N0=5.24×10⁻³/s and ε0=6.73×10⁻¹⁰ W/kg, according to the Garrett-Munk (GM) spectrum (Garrett and Munk, 1979). 
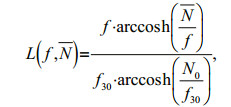
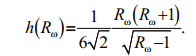 (2)
(2)The function L(f, N) corrects for a latitudinal dependence, where f is the local Coriolis frequency, f30 is the Coriolis frequency at 30°, and N is the vertically averaged buoyancy frequency for the segment.
 (3)
(3)where 〈ξzGM2〉 and 〈ξz2〉 are the strain variance from the Garrett-Munk (GM) spectrum (Gregg and Kunze, 1991) and observed strain variance, respectively. The 〈〉 indicated integration over specified vertical wavenumbers of internal wave fields on each profile. Strain ξz was calculated from each segment as
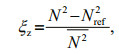 (4)
(4)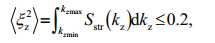 (5)
(5)where N2 was derived from 1 dbar observed potential temperature, salinity, and pressure, Nref2 was fitted to the observed N2 profile using a smooth piece-wise quadratic fitting with a window of 20 m. By applying a fast Fourier transform (FFT) on 75% overlapping 128-m segments along each vertical ξz profile, we computed the spectra Sstr(kz) and integrated to determine the strain variance. According to the strain spectrum of the Arctic, kzmax and kzmin corresponded to 0.1 and 0.02 cpm, respectively (Chanona et al., 2018). Substituting 〈ξ2z〉 into Eq.1 ultimately yields 24-m resolved vertical profiles of ε. Here the integrated constant 0.2 was used to estimate the mixing based on the Argo data (Whalen et al., 2015). Some research found that changing this constant only has a minor effect on mixing amplitudes and does not affect our conclusions (Wu et al., 2011).
The turbulent dissipation rate ε has been compared with direct observations, and the error of estimated ε has been discussed in Appendix. The diapycnal diffusivity kz was estimated from the dissipation rate ε using the Osborn relation (Osborn, 1980) in the regimes of turbulent mixing (Dosser et al., 2021). The mixing efficiency Γ is set as 0.2 in this study (Gregg et al., 2018), which is generally used in this method
 (6)
(6)Double-diffusive staircases with O(1–10)-m vertical length scales are widespread in deep basins of the Arctic Ocean. The presence of double-diffusive staircases in the profiles will pollute the strain rate estimates from this fine-scale parameterization method. However, the double-diffusive intrusion scale is generally smaller than 5-m scale of the strain calculation (Guthrie et al., 2013). Double-diffusive staircases will interfere with some results of estimated mixing and vertical heat fluxes. Thus, we checked the temperature profiles and discarded profiles with obvious double-diffusive staircases (e.g., Fig. 2a & d) to minimize this effect. Here, we defined doublediffusive staircases as the dθ/dz much less than 

|
| Fig.2 Representative potential temperature profiles from four samples a. 139.9°W, 76.0°N, Sep. 15, 2006; b. 140.9°W, 75.1°N, Aug. 30, 2013; c. 122.9°E, 80.9°N, Sep. 12, 2013; d. 106.7°W, 87.6°N, Nov. 13, 2007, showing the feature about double-diffusive staircases. |
Two representative potential temperature and salinity profiles taken from the Canadian Basin and Eurasian Basin, representing the Pacific (Fig. 3a) and Atlantic (Fig. 3b) sectors, respectively, show clear differences for the two sectors. In the Pacific sector, fresher Pacific water intruded at 50–100 m, strengthening the stratification of the HL and deepening the maximum heat core. Moreover, in the Atlantic sector, water column was mainly composed by a cold and fresh near-freezing surface water, a HL at ~20–150 m and a warm and salty Atlantic Water (AW) at ~300 m with a potential temperature maximum. In the Pacific sector, the averaged HL depth was 20–200 m and averaged AW depth was 200–650 m, whereas, in the Atlantic sector, the averaged CHL depth was thinner 20–150 m and averaged AW shallower 150–550 m.

|
| Fig.3 Potential temperature (red) and salinity (blue) structures in the Pacific sector (Canadian Basin) (a) and the Atlantic sector (Eurasian Basin) (b) from two representative sample casts Based on potential temperature and salinity criteria described in Jones (2001), we defined three typical layers: HL (halocline), AW (Atlantic Water) thermocline, and AW heat core, on potential temperature and salinity profiles. |
The mixing varies spatially and temporally all over the world. First, the basin-wide statistics of two mixing parameters, diapycnal diffusivity (kz) and dissipation (ε), and their vertical profiles are presented. Subsequently, the spatial and temporal distributions of these parameters are investigated, both for the entire Arctic Ocean and for the Atlantic and Pacific sectors. Finally, the two parameters are compared between the two sectors.
Statistical distributions of the diapycnal diffusivities and dissipation rates in the entire domain were considered as the primary important feature of mixing for the entire Arctic Ocean, including both the Atlantic and Pacific sectors (Fig. 4). Since the Fram Strait differs from most of the rest of the Arctic Ocean, with extremely strong turbulent mixing by internal tides, it was not included here. The averaged diffusivity and dissipation rate for the entire Arctic were approximately O(10-5) m2/s and O(10-9) W/kg (geometric mean), corresponding to standard deviations of O(10-4) m2/s and O(10-7) W/kg, respectively. Here, the geometric mean was chosen to avoid the error caused by several extremely large or small values. These diffusivities and dissipation rates indicated a significant high inhomogeneity, both spatially and temporally. Moreover, mixing in the Arctic Ocean, except for the Fram Strait, is weaker than in mid- and lower latitudes. As the depth-averaged results at the whole estimated depth (~100–650 m), diapycnal diffusivities in the Atlantic sector and Pacific sector were 4×10⁻⁵m2/s and 8×10⁻⁶ m2/s, respectively. These differ by more than 0.5 order of magnitude, showing an obvious disparity in mixing properties. The differences of dissipation rate ε were relatively smaller, 1×10⁻⁹ W/kg in the Atlantic sector and 7×10⁻¹⁰ W/kg in the Pacific sector. Compared with middle or lower latitude diapycnal diffusivities and dissipation rates, the diapycnal diffusivities and dissipation rates of Atlantic sector were on par with them and only the Pacific sector was significantly lower (e.g., Kunze, 2017; Whalen et al., 2018), some details of the spatial pattern and mechanisms will be discussed later. Differences in diffusivities and dissipation rates were hypothesized to result from the different stratification and water masses conditions in the two sectors. In the mid-2010s, the stratification of the upper layer in the Atlantic sector, especially in Eurasian Basin, has been found to keep the weakening trend (Polyakov et al., 2017; Polyakov et al., 2020; Schulz et al., 2021b). In the Pacific sector, the stratification was strong with thick CHL (Toole et al., 2010; Jackson et al., 2012) in early 2010s, and then it was decreasing slightly. The declining sea ice trend was significant in the summer for the Pacific sector, but in winter for the Atlantic sector. The depth of AW in the Pacific sector was deeper than that in the Atlantic sector (Fig. 3). These differences indicated some potential factors leading to the mixing discrepancy between the two Arctic Ocean sectors.

|
| Fig.4 Histograms of log-scale diapycnal diffusivities kz (a) and turbulent dissipation rates ε (b) for the entire Arctic (blue) and the Atlantic (gold) and Pacific (brown) sectors, respectively The geometric mean values are shown by blue, red, and yellow solid lines, corresponding to the entire Arctic, the Pacific sector, and the Atlantic sector, respectively. |
The horizontal maps of diapycnal diffusivities and dissipation rates in the Arctic Ocean (Fig. 5) were bin averaged into 1° latitude × 3° longitude grid cells of water columns in an upper layer and a deeper layer. Here the upper layer was from 100 (minimum depth estimated) to 200 m, and the deeper layer is 200–600 m, which was fixed according to the averaged profile in entire region (Section 3.1).

|
| Fig.5 Horizontal spatial variability of diapycnal diffusivities kz (m2/s) in 100–200 m (a), 200–600 m (b), and turbulent dissipation rates ε (W/kg) in 100–200 m (c), 200–600 m (d) All values are bin-averaged into 1° latitude × 3° longitude grid cells. |
A significant difference between the Pacific and the Atlantic sectors for kz and ε was found at the depths of both two layers. kz and ε in the depth range 100–200 m (Fig. 5a & c) in the Atlantic sector were higher than these in the Pacific sector by roughly an order of magnitude. kz and ε at these depths were highest in Fram Strait, second highest in the Amundsen Basin and lowest in the Canadian Basin. Moreover, kz in some areas always covered by ice were smaller than summer ice free areas, which was consistent with previous research (e.g., Rippeth et al., 2015; Zhong et al., 2018). In the deeper layer, the horizontal maps of kz and ε were similar to that for the depth of 100–200 m, but with smaller differences between both sectors. kz and ε strengthened significantly in a portion of the Canadian Basin that was always covered by sea ice. Meanwhile, the topography of this region is rough due to the presence of Canadian Basin slope, which might be able to generate the bottom-trapped waves and trigger mixing in a deeper layer. The magnitude of kz and ε even climbed to the averaged level of the Atlantic sector (Fig. 5b & d), indicating that the existence of multiyear sea ice is a possible factor modulating mixing in the deeper ocean.
Further discrepancies between the two main layers in same regions were seen in Fig. 5. In the Atlantic sector of the Arctic, the maximum of kz and ε were found in the upper layer. While in the Pacific sector, the maxima occur in AW and were more than 1 order of magnitude larger than in the upper layer for several regions. This shows different vertical structures of kz and ε between the two sectors of the Arctic Ocean. The specifics of the vertical structure are discussed in the next section.
3.4 Vertical structure of kz and ε in different basinsThe averaged vertical structures and corresponding standard deviations of kz, ε, and stratification N also differed between the two sectors (Fig. 6). In the Pacific sector (mainly the Canadian Basin), it was found that kz at the depth of HL was very small, increasing with depth and peaked at 300–400 m, which coincided with the bottom of thermocline (Fig. 6a). Below the thermocline, it decreased with depth (Fig. 6a). The vertical structure of ε was similar to kz, but its decline was more rapid, particularly in deeper depths (Fig. 6b). Its maximum of kz occurred at the bottom of the HL, which was attributed to the strong HL stratification (Fig. 6c) suppressing turbulent mixing in the upper layer.

|
| Fig.6 Regional average vertical profiles of diapycnal diffusivities kz (a and d), dissipation rate ε (b and e), and stratification N (c and f) The top row depicts regional average values in the Pacific sector; bottom row depicts it in the Atlantic sector. The solid lines are averages along fixed depths by computing geometric means in the left and middle panels, and arithmetic means are in the right panel. Shadings indicate corresponding geometric and arithmetic standard deviations. These values at each depth are computed from at least 5 000 casts. |
The difference between the vertical structures of kz and ε on the Atlantic sector (mainly Eurasian Basin) compared to the Pacific sector were that the maxima of kz and ε in the Eurasian Basin were both found in upper layer. The upper layer stratification in the Atlantic sector is about a half of that in the Pacific sector. A weaker stratification enables the turbulent mixing to overcome the stratification and drive ocean mixing. Below that, they decreased with depth, with the fastest decline between 300–500 m. Such features were probably due to the weaker stratification in HL in the Atlantic sector. In the Pacific sector, the N was stronger and enhanced at ~250 m due to the Pacific Water Intrusion and thicker HL. While in the Atlantic sector, N was obviously weaker than that in the Pacific sector. In addition, N decreased rapidly with depth in the upper ocean, enabling the internal waves to easily drive the mixing. This is one possible reason for different mixing mechanisms between the two sectors.
3.5 Long-term variability and seasonal cycleThe thickness and extent of Arctic sea ice declined rapidly from 2005 to 2019 (e.g., Rothrock et al., 2008; Lindsay and Schweiger, 2015). This can affect the ocean circulation, internal tides, mixing, and water properties. We focus on the temporal variability of kz and ε in two sectors (Atlantic and Pacific) and two layers. The long-term change of kz and ε are provided in Figs. 7–8.

|
| Fig.7 Temporal variability of 100–200 m (a and c) and 200–600 m (b and d) averaged diffusivities kz The top row shows averaged values for the Pacific sector (Canadian Basin) and the bottom row shows the Atlantic sector (Eurasian Basin). Yearly geometric means (black symbols) are shown along with corresponding standard deviations (gray lines). Red lines and blue lines indicate the monthly geometric means of two layers, respectively. Gray dots indicate the observed values for each profiles. |

|
| Fig.8 As in Fig. 7, but for corresponding values of turbulence dissipation rate ε |
In the Pacific sector, there is no significant trend of mixing in the entire period (Dosser et al., 2021), whereas the kz (Fig. 7a–b) decreased from 2005 to 2011, with rates for the upper and deeper layers of 6.4×10⁻⁷ m2/(s·a) and 6.3×10⁻⁶ m2/(s·a), respectively. The downtrend of the deeper layer was stronger and more obvious. The annual decreasing rates of ε (Fig. 8a–b) for the two layers were 4.4×10⁻¹⁰ W/(kg·a) and 3.8×10⁻¹⁰ W/(kg·a), with the upper layer downtrend more obvious. After 2011, the yearly mean values of kz and ε in the upper layer were relatively stable until 2016, and slightly increased during 2017–2018. Meanwhile, the yearly mean values of kz and ε in AW were not stable, but gradually increased after 2012, with rates of 3.0×10⁻⁶ m2/(s·a) and 3.2× 10⁻¹⁰ W/(kg·a), respectively. These recent magnitudes nearly reached the pre-2005 levels of kz and ε. In addition, more significant monthly fluctuations of kz and ε were found in monthly averages (Figs. 7–8), indicating a more obvious seasonal signal.
The annual averaged kz and ε in the Atlantic sector increased significantly during all the periods we focused on (Figs. 6c–d, 7c–d), which is consistent with Dosser et al. (2021). In spite of missing data for some months and some years due to relatively scarce observations in the Atlantic sector, the available data was sufficient to support our analysis of annual and seasonal variations. The annual increasing rates of kz in the upper and deeper layers were 2.1×10⁻⁶ m2/(s·a) and 1.2×10⁻⁵ m2/(s·a), respectively. The rates of ε were 5.8×10⁻⁹ W/(kg·a) and 2.7×10⁻¹⁰ W/(kg·a), respectively.
To analyze the change of seasonal feature of wave-driven mixing, we partitioned the time series into before and after 2011 (Fig. 9). The monthly averaged kz in the Pacific sector before 2011 were larger than after 2011. The seasonal feature of kz in the Pacific sector was insignificant before 2011 in the deeper layer, but slightly increased in summer in the upper layer. After 2011, the kz in the Pacific sector was larger in winter in both two layers, and also slightly enhanced in summer in AW (Fig. 9a). The seasonal characteristic of kz in the Atlantic sector (Fig. 9b) was enhanced significantly in summer after 2011. Compared to that before 2011, the enhanced kz in summer is obvious in the upper layer. Note that shifting the time series partition one year each way will not significantly alter the results (not shown).

|
| Fig.9 Seasonal variability of diapycnal diffusivities kz in the Pacific sector (Canadian Basin) (a) and the Atlantic sector (Eurasian Basin) (b) The dashed lines indicate monthly geometric averages in 100-200 m (blue dashed lines) and 200-600 m (read dashed lines) before 2011, the solid dots lines indicate the corresponding values after 2011. |
Mixing is generated by a wide variety of processes, each at its own scale. Here we investigate the roles of two major factors: near-inertial internal waves and stratification.
4.1 Geographical inhomogeneityThe near surface 10-m wind speeds (ERA-5 10-m winds from European Centre for Medium-Range Weather Forecasts reanalysis) were used to determine the 15-year averaged wind pattern in the Arctic (Fig. 10a). Histogram of estimated kz corresponding to the regions of weak and strong winds is shown in Fig. 10b, which shows that the kz over the region of strong winds are ~1 order of magnitude greater than it over the region of weak winds. This indicates that the wind drives the mixing significantly in the Arctic. According to the wind speed, the region corresponding to the lowest 40% (< 5.9 m/s) wind speed is defined as weak winds, and it corresponding to the top 40% (> 6.1 m/s) wind speed is defined as strong winds.

|
| Fig.10 Spatial map of 10 year averaged 10-m wind speeds in the Arctic (a) and minimum September ice concentration in 2005–2019 (c); histogram of kz for calm/stormy wind speeds (b) and ice melted/covered region (d) In (a), 5.9 and 6.1 m/s are marked in black line and red line, respectively. In (c), black line indicates winter (January) minimum ice extent and yellow line indicates summer (September) extent. Dashed lines in (b) and (d) indicate the geometric mean. |
The minimum sea ice boundaries for summer and winter are marked in Fig. 10c according to the lowest sea ice concentration (https://psl.noaa.gov/data/gridded/data.noaa.oisst.v2.html) in each season. It can be noted that the extent of sea ice declined most significantly in the west of the Pacific sector, while the concentration declined most in the Atlantic sector. The statistics of estimated kz in both regions suggested that kz in the region always covered by ice were higher 0.5-1 order of magnitude than regions of summer melting ice (Fig. 10d). This clearly indicates that sea ice impacts ocean mixing.
Breaking of Internal tides and near-inertial waves are considered as two dominant factors of mixing in mid-latitude (e.g., Xu et al., 2014, 2016, 2021; Wang et al., 2018; Chang et al., 2019). Due to the weak internal tides in the Arctic deep basins, here we consider only the contributions at near-inertial frequencies. The amplitudes of near-inertial waves were estimated from isopycnal displacements taken from the ITP dataset (Dosser et al., 2014; Method). This resultant estimation from each profile (Fig. 11a) illustrated that stronger near-inertial waves were found in the Atlantic sector, with amplitudes about twice as large as those in the Pacific sector. Stronger near-inertial waves were mainly found in ice-free areas during summer, indicating ice-free surfaces were more productive for the generation of winddriven near-inertial waves. The Arctic Ocean was divided into a weak near-inertial wave field and a strong near-inertial wave field according to amplitudes in the lowest 40% (< 1 m) and top 40% (> 1.5 m, black line, Fig. 11a). These results suggest that kz in the area with strong near-inertial waves was stronger by 0.5–1 orders of magnitude than with the weak near-inertial waves, indicating an important impact of the nearinertial waves on turbulent mixing in the Arctic Ocean.

|
| Fig.11 Spatial map of vertical mean near-inertial wave amplitude (40–180 m) following the ITP stations from 2005 to 2019 (black line indicates amplitude is 1.5 m) (a); log-scale histograms of domain-wide diapycnal diffusivities kz of weak/ strong near-inertial wave (b); (c) and (d) as in (b) but of the Pacific sector (mainly Canadian Basin) and the Atlantic sector (mainly Eurasian Basin), respectively Dashed lines in (b–d) indicate the geometric mean. |
However, the different results in the sectors were interesting. The Atlantic sector was typical for the entire region. kz in the region of strong near-inertial waves was larger. However, in Pacific sector, kz in the region of strong near-inertial waves was smaller, which contradicts the idea that internal waves drive turbulent mixing. One possible explanation is that other factors drive mixing in this region, such as lee waves and bottom-trapped waves. It is because the region with larger diapycnal mixing corresponds to the slope of Canadian Basin.
Stratification also influences turbulent mixing. The buoyancy frequency N is a measure of the stratification. The maximum N for each profile Nmax was generally found in the near-freezing surface layer (Fig. 12). This layer was influenced by sea ice formation and decay. The Pacific sector (mainly Canadian Basin) had relatively stronger stratification compared to the center and Atlantic sector. This stratification difference affected turbulence. The inhibition of stratification on the Arctic Ocean mixing was proved in Fig. 12b. The mean value of kz under the weaker stratification is larger by 1 order of magnitude than that under the stronger stratification.

|
| Fig.12 Stratification maxima Nmax for each profile (a); log-scale histograms of domain-wide diapycnal diffusivities kz of weak/ strong stratification (dashed lines indicate the geometric mean) (b); spatial map of max dimensionless buoyancy Reynolds number for each profile (c), and the depths corresponding to max dimensionless buoyancy Reynolds number (d) |
To determine where the turbulence dominates ocean mixing, we computed the dimensionless buoyancy Reynolds number Reb. When the Reb is too small, the Osborn relation might need to be modified (Bouffard and Boegman, 2013). The maximum of each profile is shown in Fig. 12c. Reb was used to judge whether the turbulence was sufficiently energetic to overcome the strong stratification and generate turbulent mixing (Ivey et al., 2008). Turbulent mixing is generally considered to be suppressed when Reb < 20. Profile locations with Reb > 20 are marked in red in Fig. 12c, and profile locations with Reb < 20 are marked in blue, indicating the turbulence was suppressed. It can be noted that most of the Atlantic sector was dominated by turbulent mixing with significant red dots, while only a few profiles with Reb > 20 were found in the Pacific sector, showing weaker turbulent mixing in that region. The depth of Reb maximum for Reb > 20 are provided in Fig. 12d. This shows the depth dominated by turbulent mixing and is consistent with maps of stratification. The turbulent mixing generally occurred above 200 m in the Atlantic sector, but deeper in the Pacific sector, suggesting that most turbulent mixing in the Pacific sector was suppressed due to strong stratification.
4.2 Contribution of time-varying kzThe effects of the aforementioned influence factors on the temporal variability of turbulent mixing during nearly 15 years are discussed here (Fig. 13). The variation of diapycnal diffusivities shows a difference between both two sectors of the Arctic (see Section 2.5). The corresponding sea ice concentration in the Pacific sector and the Atlantic sector (Fig. 13c–d) both decreased markedly. The decline rates of the Pacific sector were 0.82%/a in summer and 0.09%/a in winter. Compared to the Pacific sector, the Atlantic sector decreased more rapidly, especially in winter, with decline rates of 0.60%/a in summer and 0.39%/a in winter. This winter decline rate in the Atlantic sector is much larger than that in the Pacific sector.

|
| Fig.13 Temporal variability of averaged diffusivities kz (a and b), ice concentration (c and d), inertial wave amplitude (e and f) (arithmetic means in 50–200 m), and stratification N (g and h) (arithmetic means in maximum of each profile) In (a and b), blue line and orange line indicate the geometric means of 100-200 m and 200-600 m, respectively. Here the left indicate the Pacific sector (Canadian Basin) and the right indicate the Atlantic sector (Eurasian Basin), respectively. NIW: near inertial wave. |
The amplitude of near-inertial waves increased in both the two main Basins during the last 15 years (Fig. 13e & f). The averaged amplitude in the Atlantic sector was larger than in the Pacific sector. There are two obvious growth spikes in 2010 and 2014 on the Atlantic sector, which by 2017 increased by 1 m compared with 2006. Moreover, a significant seasonal cycle of near-inertial waves with stronger in summer and weaker in winter was found in the Atlantic sector. The amplitude of near-inertial waves of the Pacific sector remained at ~1 m prior to 2014, with the exception of a growth spurt in 2013. After 2014, it increased significantly, reaching about 2 m in 2019. This is consistent with the increase of kz in the upper layer, which indicates that the increasing amplitude of near-inertial waves will enhance turbulent mixing in the upper layer, but it still controlled by stratification. While during this period, the trend of kz in the Atlantic sector increased with the significant enhancement of near-inertial wave amplitudes and constantly weakening stratification. The increases of kz in 200–600 m is also consistent with the changing nearinertial waves, despite the fact that the near-inertial waves mainly trigger mixing in the upper layer. One possible reason is that the weakened stratification might provide conditions that the near-inertial internal waves are able to reach deeper layers.
It can be reasonably inferred that the control factors of two basins in both sides of the Arctic Ocean differed. The kz of the Atlantic sector (mainly Eurasian Basin) is controlled by internal-waves, because of the weak stratification (Figs. 12a & 13h). The significant increase of kz was consistent with the increasing internal waves (Fig. 13f), even though we only considered near-inertial waves. The kz of the Pacific sector (mainly Canadian Basin) is controlled by both strong stratification and increasing near inertial internal waves. Strong stratification in this area suppressed wave-driven mixing in previous period, but such limitation of stratification on mixing began to change due to the weakening stratification (after 2011) and growing near-inertial waves. In later period, the kz is gradually increasing after 2012 as shown in Fig. 13a.
Moreover, it can be noted that the decline of sea ice extent and sea ice free range in summer (Fig. 10c) were significant in the Pacific sector. But the decline of sea ice concentration is more significant in the Atlantic sector (Fig. 13c–d). Such faster decline of sea ice provides conditions for the increase of nearinertial waves, and the "Atlantification" weakens the stratification (Polyakov et al., 2017). This may be a reasonable explanation for why mixing in the Atlantic sector tends to be dominated by turbulent mixing.
The scatter plots and the linear fitting results show the distinct modulation effects on mixing between the two sectors (Fig. 14). The linear fitting slopes of the diffusivities and near-inertial waves amplitude are 0.036 in the Atlantic sector and 0.096 in the Pacific sector. It can be seen that the response of mixing to the near inertial waves is more significant in the Atlantic sector than in the Pacific sector. The linear fitting slopes of diffusivities and stratification are -0.379 (the Atlantic sector) and -0.392 (the Pacific sector). The mixing responses to the stratification in the two sectors are about the same magnitude, despite the much weaker stratification in the Atlantic sector.

|
| Fig.14 Scatter of log-scale kz versus near-inertial wave amplitude (a) and log-scale stratification (b) in the Pacific sector (blue) and the Atlantic sector (red) The best-fit slopes are denoted by the solid line and marked with 95% confidence bounds. |
From our results, it can be found that the mixing in the Atlantic sector is increasing in the last decade, which is corresponding to the increasing near-inertial waves and decreasing stratification. And the most part of the Atlantic sector is Reb > 20, indicating a wave driven mixing regime (Dosser et al., 2021). Whereas in the Pacific sector, kz first decreased and then increase, with a large part of the Pacific sector is Reb < 20, indicating the strong stratification suppressed the turbulent mixing. However, in recent years, the increased kz and near internal waves might weaken the inhibition effect of stratification.
5 TURBULENT HEAT FLUXUtilizing the estimated kz, we further calculate the vertical turbulent heat flux, which will influence the upper ocean heat content and impact sea ice and climate.
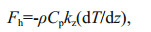 (7)
(7)where ρ, Cp, kz, and dT/dz are density, specific heat, diffusivity, and the potential temperature gradient, respectively. The heat exchange between the warmer AW and the colder, fresher, upper ocean is of major concern. The averaged thermocline depth of 1° latitude × 3° longitude grid cells were examined (Fig. 15b).

|
| Fig.15 Spatial map of thermocline vertical averaged heat flux (a) and depth of maximum heat flux (b) in the Arctic Ocean; annual averaged vertical heat flux (c) and potential temperature gradient (d) in the Pacific sector; (e) and (f) as in (c) and (d) but for the Atlantic sector |
The vertical heat fluxes at the depth corresponding to the thermocline (Fig. 15b) are given in Fig. 15a. The boundary between AW and the surface water occur at the thermocline, so it was the depth of major interest for this process. The maxima of vertical heat flux are generally found in this depth. The largest vertical heat fluxes were found in the Atlantic sector. The AW heat was constantly released upward after it entered the central Arctic Ocean through the Fram Strait. The AW heat core constantly deepened from the Atlantic sector to the Pacific sector, which decreased the available heat for further upward transfer. This result indicated that in the Atlantic sector the heat transfer from AW to the surface occurred more easily and resulted in more sea ice melting. However, other factors might be more important for the heat to melt sea ice in the Pacific sector, such as a stronger stratification, limiting the heat transport to the surface, and double-diffusion, contributing a considerable part of heat flux in the Canada Basin (e.g., Smith et al., 2018; Timmermans et al., 2018), and the heat reservoir in the Pacific Summer Water and Near Surface Temperature Maximum layer. Some other potential factors are the intrusion of the Pacific Water or the increasing of sea ice albedo. In the Pacific sector, it appears to be more difficult for the AW to transfer heat to the surface and directly affect the upper ocean.
Temporal and spatial averaged vertical structures of Fh and potential temperature gradients in the two main basins are provided in Fig. 15c–f (here results are shown for 2006, 2008, 2010, 2012, 2014, 2016, and 2018). In the Pacific sector, both the depth of maximum potential temperature gradient and the depth of maximum of corresponding heat flux deepened with time. A sub-peak in the upward heat flux was found at ~150 m after 2010. We cannot determine whether such peaks will overcome the strong stratification in the upper ocean and transfer heat to sea surface. In addition, the heat flux in the Pacific sector decreased in post 2010, which might due to the decreasing of temperature gradient. In the Atlantic sector, our results showed that the maxima potential temperature gradients were found in the upper ocean (the minimum depth of estimated kz restrains our focus depth). The AW heat probably affected the sea surface and sea ice, because the maxima always occurred in the upper ocean. The decreasing sea ice in the Atlantic sector will become more significant, and the strong stratification at the upper layer will gradually weaken due to the increasing diapycnal heat (Polyakov et al., 2020a). Such amplification of upward heat flux will enhance the rate of warming in the Arctic region and contribute to polar amplification (Beer et al., 2020).
6 CONCLUSIONIn this study, we estimate diffusivity kz, and dissipation rate ε, in the Pan-Arctic Ocean for water depths between ~100–700 m from high resolution observations of ITP using a strain-based finescale parameterization method. A 3-dimensional wavedriven mixing structure and temporal variability of diffusivity and dissipation rate are given in this paper (Figs. 5–9). It can be noted that the mixing properties for both sides of the Arctic Ocean are apparently different. The diapycnal diffusivity kz and dissipation rate ε in Atlantic sector were 3.5×10⁻⁵ m2/s and 1.2× 10⁻⁹ W/kg, respectively; while those in the Pacific sector were lower, 9.2×10⁻⁶ m2/s and 7.4×10⁻¹⁰ W/kg, respectively. The interannual variability of kz and ε is different in the two sectors. A constantly increasing trend of kz was found in the Atlantic sector, whereas kz in the Pacific sector weakened first and then increased (see Section 3.5).
Potential influence factors for mixing in the Arctic Ocean include wind, sea ice, near-inertial waves and stratification. Their roles were discussed (Figs. 10–12, Section 4.1). The estimated amplitude of near-inertial waves and stratification in the Arctic Ocean show two modulations of turbulent mixing in both sides of the Arctic Ocean. The Atlantic sector shows a mixing mechanism dominated by internal waves. However, the mixing in the Pacific sector is limited by stratification and not controlled by internal waves. This difference resulted from the different stratification in the sectors. This viewpoint was supported by the pattern of the buoyancy Reynolds number, Reb (Fig. 12a).
Based on the above-mentioned viewpoint, we analyzed the temporal variability of kz, Fh, and relative influence factors (Figs. 13 & 14, Section 5). The mixing in the Atlantic sector was always controlled by internal waves, and kz and Fh constantly increased with the increasing near-inertial waves. The mixing in the Pacific sector may be in a period of change from being limited by stratification to being dominated by internal waves. However, we cannot predict whether turbulent mixing will dominate in this sector in the near future. The temporal variability of kz increased after 2011, which may because near-inertial waves gradually overcame strong stratification and drove turbulence after 2011. The heat flux in Pacific sector is decreasing. In addition, the depths of heat flux maxima gradually descending. Thus, it is more difficult for the AW heat to be rapidly released to the upper ocean. Moreover, a sub peak of heat flux was found in the HL during the last 10 years. How such peak will affect the upper ocean is still uncertain.
Due to the limitations of parameterization method, these results and conclusions mainly focused on wave-driven mixing in the Arctic Ocean. The diffusivities and heat flux caused by double diffusion were out of the scope of present work. Our result shows that double-diffusive staircases are generally found in the central Canada Basin (Fig. 1), which probably contributes to mixing here, although recent research have shown that the contribution of doublediffusive mixing is small (Boog et al., 2021) on the global ocean. In addition, other types of internal waves can also cause mixing in some rough topography and ice environment (e.g., Schulz et al., 2021b; Zhang et al., 2021). Further question remains as to the mixing properties of the Pan Arctic. Future work will take double diffusion and other internal waves into account and focus on the transition of mixing properties.
7 DATA AVAILABILITY STATEMENTThe Ice-Tethered Profiler data sets were made available by the Ice-Tethered Profiler Program (Krishfield et al., 2008; Toole et al., 2011) at the Woods Hole Oceanographic Institution (http://www.whoi.edu/itp). ERA-5 10-m winds speed data are from European Centre for Medium-Range Weather Forecasts reanalysis (https://www.ecmwf.int/en/forecasts/datasets). The sea ice concentration are available at https://psl.noaa.gov/data/gridded/data.noaa.oisst.v2.html.
Aagaard K, Coachman L K, Carmack E. 1981. On the halocline of the Arctic Ocean. Deep Sea Research Part A. Oceanographic Research Papers, 28(6): 529-545.
DOI:10.1016/0198-0149(81)90115-1 |
Armitage T W K, Manucharyan G E, Petty A A, Kwok R, Thompson A F. 2020. Enhanced eddy activity in the Beaufort Gyre in response to sea ice loss. Nature Communications, 11(1): 761.
DOI:10.1038/s41467-020-14449-z |
Bebieva Y, Timmermans M L. 2017. The relationship between double-diffusive intrusions and staircases in the Arctic Ocean. Journal of Physical Oceanography, 47(4): 867-878.
DOI:10.1175/JPO-D-16-0265.1 |
Beer E, Eisenman I, Wagner T J W. 2020. Polar amplification due to enhanced heat flux across the halocline. Geophysical Research Letters, 47(4): e2019GL086706.
DOI:10.1029/2019GL086706 |
Bi H B, Liang Y, Wang Y H, Liang X, Zhang Z H, Du T Q, Yu Q L, Huang J, Kong M, Huang H J. 2020. Arctic multiyear sea ice variability observed from satellites: a review. Journal of Oceanology and Limnology, 38(4): 962-984.
DOI:10.1007/s00343-020-0093-7 |
Bouffard D, Boegman L. 2013. A diapycnal diffusivity model for stratified environmental flows. Dynamics of Atmospheres and Oceans, 61-62: 14-34.
DOI:10.1016/j.dynatmoce.2013.02.002 |
Boog C, Dijkstra H, Pietrzak J, Katsman, C. 2021. Double-diffusive mixing makes a small contribution to the global ocean circulation. Communications Earth & Environment, 2: 46.
DOI:10.1038/s43247-021-00113-x |
Carmack E, Polyakov I, Padman L, Fer I, Hunke E, Hutchings J, Jackson J, Kelley D, Kwok R, Layton C, Melling H, Perovich D, Persson O, Ruddick B, Timmermans M L, Toole J, Ross T, Vavrus S, Winsor P. 2015. Toward quantifying the increasing role of oceanic heat in sea ice loss in the new Arctic. Bulletin of the American Meteorological Society, 96(12): 2079-2105.
DOI:10.1175/BAMS-D-13-00177.1 |
Chang H, Xu Z H, Yin B S, Hou Y J, Liu Y H, Li D L, Wang Y, Cao S S, Liu A K. 2019. Generation and propagation of M2 internal tides modulated by the Kuroshio northeast of Taiwan. Journal of Geophysical Research: Oceans, 124(4): 2728-2749.
DOI:10.1029/2018JC014228 |
Chanona M, Waterman S, Gratton Y. 2018. Variability of internal wave-driven mixing and stratification in Canadian Arctic shelf and shelf-slope waters. Journal of Geophysical Research: Oceans, 123(12): 9178-9195.
DOI:10.1029/2018JC014342 |
Cole S T, Timmermans M L, Toole J M, Krishfield R A, Thwaites F T. 2014. Ekman veering, internal waves, and turbulence observed under Arctic sea ice. Journal of Physical Oceanography, 44(5): 1306-1328.
DOI:10.1175/JPO-D-12-0191.1 |
Comiso J C. 2002. A rapidly declining perennial sea ice cover in the Arctic. Geophysical Research Letters, 29(20): 1956.
DOI:10.1029/2002GL015650 |
Dosser H V, Chanona M, Waterman S, Shibley N C, Timmermans M L. 2021. Changes in internal wave-driven mixing across the Arctic Ocean: finescale estimates from an 18-year pan-Arctic record. Geophysical Research Letters, 48(8): e2020GL091747.
DOI:10.1029/2020GL091747 |
Dosser H V, Rainville L. 2016. Dynamics of the changing near-inertial internal wave field in the Arctic Ocean. Journal of Physical Oceanography, 46(2): 395-415.
DOI:10.1175/JPO-D-15-0056.1 |
Dosser H V, Rainville L, Toole J M. 2014. Near-inertial internal wave field in the Canada basin from ice-tethered profilers. Journal of Physical Oceanography, 44(2): 413-426.
DOI:10.1175/JPO-D-13-0117.1 |
Falahat S, Nycander J. 2015. On the generation of bottom-trapped internal tides. Journal of Physical Oceanography, 45(2): 526-545.
DOI:10.1175/JPO-D-14-0081.1 |
Fer I. 2009. Weak vertical diffusion allows maintenance of cold halocline in the central Arctic. Atmospheric and Oceanic Science Letters, 2(3): 148-152.
DOI:10.1080/16742834.2009.11446789 |
Fer I. 2014. Near-inertial mixing in the central Arctic Ocean. Journal of Physical Oceanography, 44(8): 2031-2049.
DOI:10.1175/JPO-D-13-0133.1 |
Fer I, Koenig Z, Kozlov I E, Ostrowski M, Rippeth T P, Padman L, Bosse A, Kolås E. 2020. Tidally forced lee waves drive turbulent mixing along the Arctic Ocean margins. Geophysical Research Letters, 47(16): e2020GL088083.
DOI:10.1029/2020GL088083 |
Fer I, Skogseth R, Geyer F. 2010. Internal waves and mixing in the marginal ice zone near the Yermak Plateau. Journal of Physical Oceanography, 40(7): 1613-1630.
DOI:10.1175/2010JPO4371.1 |
Fine E C, Alford M H, MacKinnon J A, Mickett J B. 2021. Microstructure mixing observations and finescale parameterizations in the Beaufort Sea. Journal of Physical Oceanography, 51(1): 19-35.
DOI:10.1175/JPO-D-19-0233.1 |
Garrett C, Munk W. 1979. Internal waves in the ocean. Annual Review of Fluid Mechanics, 11: 339-369.
DOI:10.1146/annurev.fl.11.010179.002011 |
Gregg M C, Kunze E. 1991. Shear and strain in Santa Monica Basin. J. Geophys. Res., 96(C9): 16709-16719.
DOI:10.1029/91JC01385 |
Gregg M C, D'Asaro E A, Riley J J, Kunze E. 2018. Mixing efficiency in the ocean. Annual Review of Marine Science, 10: 443-473.
DOI:10.1146/annurev-marine-121916-063643 |
Guo Z, Cao A Z, Lü X Q. 2018. Seasonal variation and modal content of internal tides in the northern South China Sea. Journal of Oceanology and Limnology, 36(3): 651-662.
DOI:10.1007/s00343-018-6352-1 |
Guthrie J D, Morison J H, Fer I. 2013. Revisiting internal waves and mixing in the Arctic Ocean. Journal of Geophysical Research: Oceans, 118(8): 3966-3977.
DOI:10.1002/jgrc.20294 |
Hakkinen S, Proshutinsky A, Ashik I. 2008. Sea ice drift in the Arctic since the 1950s. Geophysical Research Letters, 35(19): L19704.
DOI:10.1029/2008GL034791 |
Halle C, Pinkel R. 2003. Internal wave variability in the Beaufort Sea during the winter of 1993/1994. Journal of Geophysical Research, 108(C7): 3210.
DOI:10.1029/2000JC000703 |
Hebert D, Moum J N. 1994. Decay of a near-inertial wave. Journal of Physical Oceanography, 24(11): 2334-2351.
DOI:10.1175/1520-0485(1994)024<2334:DOANIW>2.0.CO;2 |
Hughes K G, Klymak J M. 2019. Tidal conversion and dissipation at steep topography in a channel poleward of the critical latitude. Journal of Physical Oceanography, 49(5): 1269-1291.
DOI:10.1175/JPO-D-18-0132.1 |
Ivey G N, Winters K B, Koseff J R. 2008. Density stratification, turbulence, but how much mixing?. Annual Review of Fluid Mechanics, 40: 169-184.
DOI:10.1146/annurev.fluid.39.050905.110314 |
Jackson J M, Williams W J, Carmack E C. 2012. Winter sea-ice melt in the Canada Basin, Arctic Ocean. Geophysical Research Letters, 39(3): L03603.
DOI:10.1029/2011GL050219 |
Kawaguchi Y, Nishino S, Inoue J, Maeno K, Takeda H, Oshima K. 2016. Enhanced diapycnal mixing due to near-inertial internal waves propagating through an anticyclonic eddy in the ice-free Chukchi Plateau. Journal of Physical Oceanography, 46(8): 2457-2481.
DOI:10.1175/JPO-D-15-0150.1 |
Krishfield R, Toole J, Proshutinsky A, Timmermans M L. 2008. Automated ice-tethered profilers for seawater observations under pack ice in all seasons. Journal of Atmospheric and Oceanic Technology, 25(11): 2091-2105.
DOI:10.1175/2008JTECHO587.1 |
Kunze E. 2017. Internal-wave-driven mixing: global geography and budgets. Journal of Physical Oceanography, 47(6): 1325-1345.
DOI:10.1175/JPO-D-16-0141.1 |
Kunze E, Firing E, Hummon J M, Chereskin T K, Thurnherr A M. 2006. Global abyssal mixing inferred from lowered ADCP shear and CTD strain profiles. Journal of Physical Oceanography, 36(8): 1553-1576.
DOI:10.1175/JPO2926.1 |
Lei R B, Tian-Kunze X S, Leppäranta M, Wang J, Kaleschke L, Zhang Z H. 2016. Changes in summer sea ice, albedo, and portioning of surface solar radiation in the Pacific sector of Arctic Ocean during 1982-2009. Journal of Geophysical Research: Oceans, 121(8): 5470-5486.
DOI:10.1002/2016JC011831 |
Lenn Y D, Rippeth T P, Old C P, Bacon S, Polyakov I, Ivanov V, Hölemann J. 2011. Intermittent intense turbulent mixing under ice in the Laptev Sea continental shelf. Journal of Physical Oceanography, 41(3): 531-547.
DOI:10.1175/2010JPO4425.1 |
Lenn Y D, Wiles P J, Torres-Valdes S, Abrahamsen E P, Rippeth T P, Simpson J H, Bacon S, Laxon S W, Polyakov I, Ivanov V, Kirillov S. 2009. Vertical mixing at intermediate depths in the Arctic boundary current. Geophysical Research Letters, 36(5): L05601.
DOI:10.1029/2008GL036792 |
Lincoln B J, Rippeth T P, Lenn Y D, Timmermans M L, Williams W J, Bacon S. 2016. Wind-driven mixing at intermediate depths in an ice-free Arctic Ocean. Geophysical Research Letters, 43(18): 9749-9756.
DOI:10.1002/2016GL070454 |
Lindsay R, Schweiger A. 2015. Arctic sea ice thickness loss determined using subsurface, aircraft, and satellite observations. The Cryosphere, 9(1): 269-283.
DOI:10.5194/tc-9-269-2015 |
Lique C, Guthrie J D, Steele M, Proshutinsky A, Morison J H, Krishfield R. 2014. Diffusive vertical heat flux in the Canada Basin of the Arctic Ocean inferred from moored instruments. Journal of Geophysical Research: Oceans, 119(1): 496-508.
DOI:10.1002/2013JC009346 |
Liu Z, Lian Q, Zhang F, Wang L, Li M, Bai X, Wang J N, Wang F. 2017. Weak thermocline mixing in the North Pacific low-latitude western boundary current system. Geophysical Research Letters, 44: 10530-10539.
DOI:10.1002/2017GL075210 |
Manucharyan G E, Spall M A, Thompson A F. 2016. A theory of the wind-driven Beaufort Gyre variability. Journal of Physical Oceanography, 46(11): 3263-3278.
DOI:10.1175/JPO-D-16-0091.1 |
McLaughlin F A, Carmack E C, Macdonald R W, Melling H, Swift J H, Wheeler P A, Sherr B F, Sherr E B. 2004. The joint roles of pacific and Atlantic-origin waters in the Canada Basin, 1997-1998. Deep Sea Research Part I: Oceanographic Research Papers, 51(1): 107-128.
DOI:10.1016/j.dsr.2003.09.010 |
McLaughlin F A, Carmack E C, Williams W J, Zimmermann S, Shimada K, Itoh M. 2009. Joint effects of boundary currents and thermohaline intrusions on the warming of Atlantic water in the Canada Basin, 1993-2007. Journal of Geophysical Research: Oceans, 114(C1): C00A12.
DOI:10.1029/2008JC005001 |
Merrifield M A, Pinkel R. 1996. Inertial currents in the Beaufort Sea: observations of response to wind and shear. Journal of Geophysical Research: Oceans, 101(C3): 6577-6590.
DOI:10.1029/95JC03625 |
Osborn T R. 1980. Estimates of the local rate of vertical diffusion from dissipation measurements. Journal of Physical Oceanography, 10(1): 83-89.
DOI:10.1175/1520-0485(1980)010<0083:EOTLRO>2.0.CO;2 |
Pemberton P, Nilsson J, Hieronymus M, Meier H E M. 2015. Arctic Ocean water mass transformation in S-T coordinates. Journal of Physical Oceanography, 45(4): 1025-1050.
DOI:10.1175/JPO-D-14-0197.1 |
Polyakov I V, Padman L, Lenn Y D, Pnyushkov A, Rember R, Ivanov V V. 2019. Eastern Arctic Ocean diapycnal heat fluxes through large double-diffusive steps. Journal of Physical Oceanography, 49(1): 227-246.
DOI:10.1175/JPO-D-18-0080.1 |
Polyakov I V, Pnyushkov A V, Alkire M B, Ashik I M, Baumann T M, Carmack E C, Goszczko I, Guthrie J, Ivanov V V, Kanzow T, Krishfield R, Kwok R, Sundfjord A, Morison J, Rember R, Yulin A. 2017. Greater role for Atlantic inflows on sea-ice loss in the Eurasian basin of the Arctic Ocean. Science, 356(6335): 285-291.
DOI:10.1126/science.aai8204 |
Polyakov I V, Rippeth T P, Fer I, Alkire M B, Baumann T M, Carmack E C, Ingvaldsen R, Ivanov V V, Janout M, Lind S, Padman L, Pnyushkov A V, Rember R. 2020a. Weakening of cold halocline layer exposes sea ice to oceanic heat in the eastern Arctic Ocean. Journal of Climate, 33(18): 8107-8123.
DOI:10.1175/JCLI-D-19-0976.1 |
Polyakov I V, Rippeth T P, Fer I, Baumann T M, Carmack E C, Ivanov V V, Janout M, Padman L, Pnyushkov A V, Rember R. 2020b. Intensification of near-surface currents and shear in the eastern Arctic Ocean. Geophysical Research Letters, 47(16): e2020GL089469.
DOI:10.1029/2020GL089469 |
Rainville L, Winsor P. 2008. Mixing across the Arctic Ocean: microstructure observations during the Beringia 2005 expedition. Geophysical Research Letters, 35(8): L08606.
DOI:10.1029/2008GL033532 |
Rippeth T P, Lincoln B J, Lenn Y D, Green J A M, Sundfjord A, Bacon S. 2015. Tide-mediated warming of arctic halocline by Atlantic heat fluxes over rough topography. Nature Geoscience, 8(3): 191-194.
DOI:10.1038/ngeo2350 |
Rippeth T P, Vlasenko V, Stashchuk N, Scannell B D, Green J A M, Lincoln B J, Bacon S. 2017. Tidal conversion and mixing poleward of the critical latitude (an Arctic case study). Geophysical Research Letters, 44(24): 12349-12357.
DOI:10.1002/2017GL075310 |
Robertson R, Padman L, Levine M D. 1995. Fine structure, microstructure, and vertical mixing processes in the upper ocean in the western Weddell Sea. Journal of Geophysical Research: Oceans, 100(C9): 18517-18535.
DOI:10.1029/95JC01742 |
Rothrock D A, Percival D B, Wensnahan M. 2008. The decline in arctic sea-ice thickness: separating the spatial, annual, and interannual variability in a quarter century of submarine data. Journal of Geophysical Research: Oceans, 113(C5): C05003.
DOI:10.1029/2007JC004252 |
Ruddick B, Gargett A E. 2003. Oceanic double-infusion: introduction. Progress in Oceanography, 56(3-4): 381-393.
DOI:10.1016/S0079-6611(03)00024-7 |
Rudels B, Anderson L G, Jones E P. 1996. Formation and evolution of the surface mixed layer and halocline of the Arctic Ocean. Journal of Geophysical Research: Oceans, 101(C4): 8807-8821.
DOI:10.1029/96JC00143 |
Rudels B, Quadfasel D. 1991. Convection and deep water formation in the arctic ocean-Greenland Sea system. Journal of Marine Systems, 2(3-4): 435-450.
DOI:10.1016/0924-7963(91)90045-V |
Schulz K, Büttner S, Rogge A, Janout M, Hölemann J, Rippeth T P. 2021a. Turbulent mixing and the formation of an intermediate nepheloid layer above the Siberian continental shelf break. Geophysical Research Letters, 48(9): e2021GL092988.
DOI:10.1029/2021GL092988 |
Schulz K, Janout M, Lenn Y D, Ruiz-Castillo E, Polyakov I, Mohrholz V, Tippenhauer S, Reeve K A, Hölemann J, Rabe B, Vredenborg M. 2021b. On the along-slope heat loss of the boundary current in the Eastern Arctic Ocean. Journal of Geophysical Research: Oceans, 126(2): e2020JC016375.
DOI:10.1029/2020JC016375 |
Shibley N C, Timmermans M L, Carpenter J R, Toole J M. 2017. Spatial variability of the Arctic Ocean's double-diffusive staircase. Journal of Geophysical Research: Oceans, 122(2): 980-994.
DOI:10.1002/2016JC012419 |
Shimada K, Itoh M, Nishino S, Mclaughlin F, Carmack E, Proshutinsky A. 2005. Halocline structure in the Canada basin of the Arctic Ocean. Geophysical Research Letters, 32(3): L03605.
DOI:10.1029/2004GL021358 |
Smith M, Stammerjohn S, Persson O, Rainville L, Liu G Q, Perrie W, Robertson R, Jackson J, Thomson J. 2018. Episodic reversal of autumn ice advance caused by release of ocean heat in the Beaufort Sea. Journal of Geophysical Research: Oceans, 123(5): 3164-3185.
DOI:10.1002/2018JC013764 |
Steele M, Morison J H, Curtin T B. 1995. Halocline water formation in the Barents Sea. Journal of Geophysical Research: Oceans, 100(C1): 881-894.
DOI:10.1029/94JC02310 |
Stroeve J C, Kattsov V, Barrett A, Serreze M, Pavlova T, Holland M, Meier W N. 2012. Trends in Arctic sea ice extent from CMIP5, CMIP3 and observations. Geophysical Research Letters, 39(16): L16502.
DOI:10.1029/2012GL052676 |
Sundfjord A, Fer I, Kasajima Y, Svendsen H. 2007. Observations of turbulent mixing and hydrography in the marginal ice zone of the Barents Sea. Journal of Geophysical Research: Oceans, 112(C5): C05008.
DOI:10.1029/2006JC003524 |
Takahashi A, Hibiya T. 2019. Assessment of finescale parameterizations of deep ocean mixing in the presence of geostrophic current shear: results of microstructure measurements in the Antarctic Circumpolar Current region. Journal of Geophysical Research: Oceans, 124(1): 135-153.
DOI:10.1029/2018JC014030 |
Timmermans M L, Toole J, Krishfield R. 2018. Warming of the interior Arctic Ocean linked to sea ice losses at the basin margins. Science Advances, 4(8): eaat6773.
DOI:10.1126/sciadv.aat6773 |
Timmermans M L, Toole J, Krishfield R, Winsor P. 2008. Ice-tethered profiler observations of the double-diffusive staircase in the Canada Basin thermocline. Journal of Geophysical Research: Oceans, 113(C1): C00A02.
DOI:10.1029/2008JC004829 |
Toole J M, Krishfield R A, Timmermans M L, Proshutinsky A. 2011. The ice-tethered profiler: Argo of the Arctic. Oceanography, 24(3): 126-135.
DOI:10.5670/oceanog.2011.64 |
Toole J M, Timmerman M L, Perovich D K, Krishfield R A, Proshutinsky A, Richter-Menge J A. 2010. Influences of the ocean surface mixed layer and thermohaline stratification on Arctic Sea ice in the central Canada Basin. Journal of Geophysical Research: Oceans, 115(C10): C10018.
DOI:10.1029/2009JC005660 |
Wang J, Mizobata K, Bai X Z, Hu H G, Jin M B, Yu Y L, Ikeda M, Johnson W, Perie W, Fujisaki A. 2014. A modeling study of coastal circulation and landfast ice in the nearshore Beaufort and Chukchi seas using CIOM. Journal of Geophysical Research: Oceans, 119(6): 3285-3312.
DOI:10.1002/2013JC009258 |
Wang Y, Xu Z H, Yin B S, Hou Y J, Chang H. 2018. Long-range radiation and interference pattern of multisource M2 internal tides in the Philippine Sea. Journal of Geophysical Research: Oceans, 123(8): 5091-5112.
DOI:10.1029/2018JC013910 |
Wa ng, Y, Xu Z, Hibiya T, Yin B, Wang F. 2021. Radiation Path of Diurnal Internal Tides in the Northwestern Pacific Controlled by Refraction and Interference. Journal of Geophysical Research: Oceans, 126.
DOI:10.1029/2020JC016972 |
Waterman S, Garabato A C N, Polzin K L. 2013. Internal waves and turbulence in the Antarctic circumpolar current. Journal of Physical Oceanography, 43(2): 259-282.
DOI:10.1175/JPO-D-11-0194.1 |
Waterhouse A F, MacKinnon J A, Nash J D, Alford M H, Kunze E, Simmons H L, Polzin K L, St. Laurent L C, Sun O M, Pinkel R, Talley L D, Whalen C B, Huussen T N, Carter G S, Fer I, Waterman S, Naveira Garabato A C, Sanford T B, Lee C M. 2014. Global patterns of diapycnal mixing from measurements of the turbulent dissipation rate. Journal of Physical Oceanography, 44: 1854-1872.
DOI:10.1175/JPO-D-13-0104.1 |
Whalen C B, MacKinnon J A, Talley L D. 2018. Large-scale impacts of the mesoscale environment on mixing from wind-driven internal waves. Nature Geoscience, 11(11): 842-847.
DOI:10.1038/s41561-018-0213-6 |
Whalen C B, MacKinnon J A, Talley L D, Waterhouse A F. 2015. Estimating the mean diapycnal mixing using a finescale strain parameterization. Journal of Physical Oceanography, 45(4): 1174-1188, https://journals.ametsoc.org/view/journals/phoc/45/4/jpo-d-14-0167.1.xml.
|
Whalen C B, Talley L D, MacKinnon J A. 2012. Spatial and temporal variability of global ocean mixing inferred from Argo profiles. Geophysical Research Letters, 39(18): L18612.
DOI:10.1029/2012GL053196 |
Wolanski E, Colin P, Naithani J, Deleersnijder E, Golbuu Y. 2004. Large amplitude, leaky, island-generated, internal waves around Palau, Micronesia. Estuarine, Coastal and Shelf Science, 60(4): 705-716.
DOI:10.1016/j.ecss.2004.03.009 |
Wu L X, Jing Z, Riser S, Visbeck M. 2011. Seasonal and spatial variations of Southern Ocean diapycnal mixing from Argo profiling floats. Nature Geoscience, 4: 363-366.
DOI:10.1038/ngeo1156 |
Xu Z H, Liu K, Yin B S, Zhao Z X, Wang Y, Li Q. 2016. Long-range propagation and associated variability of internal tides in the South China Sea. Journal of Geophysical Research: Oceans, 121(11): 8268-8286.
DOI:10.1002/2016JC012105 |
Xu Z H, Wang Y, Liu Z Q, McWilliams J C, Gan J P. 2021. Insight into the dynamics of the radiating internal tide associated with the Kuroshio Current. Journal of Geophysical Research: Oceans, 126(6): e2020JC017018.
DOI:10.1029/2020JC017018 |
Xu Z H, Yin B S, Hou Y J, Liu A K. 2014. Seasonal variability and north-south asymmetry of internal tides in the deep basin west of the Luzon Strait. Journal of Marine Systems, 134: 101-112.
DOI:10.1016/j.jmarsys.2014.03.002 |
Xu Z H, Yin B S, Hou Y J, Xu Y S. 2013. Variability of internal tides and near-inertial waves on the continental slope of the northwestern South China Sea. Journal of Geophysical Research: Oceans, 118(1): 197-211.
DOI:10.1029/2012JC008212 |
You J, Xu Z H, Li Q, Robertson R, Zhang P W, Yin B S. 2021. Enhanced internal tidal mixing in the Philippine Sea mesoscale environment. Nonlinear Processes in Geophysics, 28(2): 271-284.
DOI:10.5194/npg-28-271-2021 |
Zhang P, Li Q, Xu Z, Yin B. 2021. Internal solitary wave generation by the tidal flows beneath the ice keel in the Arctic Ocean. Journal of Oceanology and Limnology.
DOI:10.1007/s00343-021-1052-7 |
Zhao C, Xu Z, Robertson R, Li Q, Wang Y, Yin B. 2021. The three dimensional internal tide radiation and dissipation in the Mariana Arc-Trench system. Journal of Geophysical Research: Oceans, 126(5).
DOI:10.1029/2020JC016502 |
Zhong W L, Guo G J, Zhao J P, Li T, Wang X Y, Mu L J. 2018. Turbulent mixing above the Atlantic Water around the Chukchi Borderland in 2014. Acta Oceanologica Sinica, 37(3): 31-41.
DOI:10.1007/s13131-018-1198-0 |