 2021, Vol. 39
Institute of Oceanology, Chinese Academy of Sciences
Article Information
- GAO Fan, NAN Fangru, FENG Jia, LÜ Junping, LIU Qi, LIU Xudong, XIE Shulian
- Transcriptome profile of Dunaliella salina in Yuncheng Salt Lake reveals salt-stress-related genes under different salinity stresses
- Journal of Oceanology and Limnology, 39(6): 2336-2362
- http://dx.doi.org/10.1007/s00343-021-0164-4
Article History
- Received Apr. 18, 2020
- accepted in principle Jun. 8, 2020
- accepted for publication Dec. 28, 2020


As the primary saltwater lake in Shanxi, China, Yuncheng Salt Lake, with an area of 132 km2 (Wang et al., 2014), is well known for its rich mineral resources and unique halophilic algae (approximately 222 species) (Xie et al., 1998). Considering that no living aquatic animals have been found at present in the salt lake, whose salinity ranges 0.002–4.2 mol/L (sodium chloride concentration is defined as salinity in this study) (Xie et al., 1998), the lake is commonly known as the "Dead Sea of China". The nonmodel unicellular green microalga Dunaliella salina, a Dunaliella species that can survive in saline environments, was first found in the salt lake in the 1980s (He et al., 1993; Xie et al., 1998). Research has demonstrated that this green alga can grow rapidly, accumulate lipids, and expand its cellular capacity under different concentrations of NaCl stress (Cheng et al., 2019). Due to its unique lipid-producing feature, D. salina may represent a potential new target for biofuel feedstock (Ahmed et al., 2017). Moreover, this green microalga has been widely exploited in the medical and food industries due to its unique intracellular metabolite beta-carotene, which can be enriched through the regulation of algal culture conditions (BenMoussa-Dahmen et al., 2016).
NaCl not only constitutes a necessary nutrient for the normal growth of D. salina but also serves as a natural and complex abiotic stress factor influencing the expression of genes involved in various biological processes including metabolic, physical, and chemical processes. We postulated that diverse salt-stress-related genes and the biological processes in which they are involved might be responsible for the above-described features of Dunaliella. By reviewing numerous studies, we found that some essential metabolic pathways, for example, photosynthesis (Wei et al., 2017), lipid metabolism (Azachi et al., 2002) and carotenoid metabolism (Wichuk et al., 2014; Solovchenko et al., 2015), might be influenced by salt tolerance in Dunaliella cells. The key factors influencing these metabolic processes primarily include salt stress genes (Li et al., 2010), halotolerant proteins (Wang et al., 2019), and metabolic enzymes (Wu et al., 2019). The genes encoding photosystem Ⅱ protein D1 (PsbA) in photosystem Ⅱ (PSII) (Vasilikiotis and Melis, 1994) and photosystem Ⅰ P700 chlorophyll a apoprotein A2 (PsaB) in photosystem Ⅰ (PSI) (Liang et al., 2008) of D. salina have been cloned successfully, and the former's expression has been confirmed negatively correlated with the environmental salt concentration of this green microalga. Lipid metabolism-related enzymes (Davidi et al., 2012), such as triglyceride lipase, glycerol kinase, and glycerol dehydrogenase, have been proposed to be involved in controlling different types of resistance of D. salina to salinity stress through self-regulation of algal cellular osmotic pressure. As an enzyme involved in carotenoid metabolism, lycopene β-cyclase was reported to accumulate in Dunaliella sp. in a high-salinity water environment, with the expression of its coding gene (LCYb) attributed to the salt-responsive element GT-1 motif in soybean CaM isoform-4 (GT1GMSCAM4) (Liang et al., 2017). Similarly, specific antioxidant enzymes and stress proteins involved in environmental adaptation, such as peroxiredoxins (Gong et al., 2017) and heat shock protein 90 (Chen et al., 2015), have been shown positively correlated with the response of D. salina to salt stress. However, the genes encoding many key metabolic enzymes involved in the response to salt stress have not yet been characterized in D. salina. Thus, novel salt-stress-related genes may be discovered based on transcript data from D. salina under different salinity stresses.
Dunaliella is facing a potential survival crisis due to habitat threats, such as environmental pollution, which has been increased in Yuncheng Salt Lake and salt lakes in other areas in recent years (Yuan et al., 2015). To date, only 143 known functional genes have been reported in GenBank (July 2020). To explore new and more genes, particularly those essential for the regulation of salt tolerance in D. salina, transcriptomic profiling of this unique microalga is urgently required. Due to the rapid development of molecular biology and bioinformatics in the 21st century, high-throughput RNA sequencing (RNA-seq) has become an effective approach for obtaining transcriptomic information of organisms (Zhou et al., 2019), which is essential for discovering key genes encoding regulators, enzymes or proteins involved in diverse biological processes in algae, such as D. salina. The functions of these genes and their relevant metabolic pathways in this microalga could be further examined using bioinformatic analysis (Rodríguez-García et al., 2017), setting a foundation for research on the regulatory mechanisms of salt tolerance or the survival response of D. salina in different saline environments. However, such transcriptome analyses with different concentrations of NaCl treatments have not been conducted to date for any wild high-salt-tolerant Dunaliella species. Therefore, the key salt-stress related genes and their expression patterns, potential functions, and associated biological processes in D. salina under different salinity stresses need to be characterized.
High-throughput sequencing technologies, such as Ion Torrent, Roche 454, Thermo Fisher, SOLiD, HiSeq and, most notably, RNA-seq (Gierahn et al., 2017), have become effective approaches for uncovering new functional genes, which may inform the development of further studies on the molecular mechanisms underlying adaptation to abiotic stress in algae. Moreover, algal cell morphology, gene expression, and physiological and biochemical characteristics will be influenced by different NaCl concentrations, as reported in various algal species, such as Spirogyra pratensis (Van De Poel et al., 2016), Shewanella algae (Fu et al., 2014), Chlorella sp. (Mansfeldt et al., 2016), Pyropia tenera (Im et al., 2017), and Chromochloris zofingiensis (Mao et al., 2020). Furthermore, transcriptomic analysis of a mutant D. tertiolecta under low-light stress based on the Illumina MiSeq system revealed 10 185 genes and a fatty acid biosynthesis pathway involved in inositol phosphate metabolism (Yao et al., 2015). Subsequent transcriptomic analysis of D. tertiolecta under nitrogen deficiency stress using the Illumina MiSeq and HiSeq 4000 systems identified 17 845 proteincoding transcripts (Yao et al., 2017). Moreover, some key genes and related metabolic pathways in D. tertiolecta under nitrogen and NaCl stresses were identified via Roche 454 sequencing (Rismani-Yazdi et al., 2011). Finally, comparative transcriptomic analysis of Dunaliella acidophila under cadmium and natural metal-rich stresses using Illumina sequencing revealed specific key genes responsive to the heavy metal stress response (Puente-Sánchez et al., 2016).
In addition to transcriptomic studies on other Dunaliella species under different stresses, only two transcriptome sequencing analyses of D. salina have been reported to date. For one of the studies, the sequencing platform and abiotic stress conditions imposed during D. salina's entire growth cycle were not clarified (Hong et al., 2017). For the other, a short stress cycle (0–2 h) and single high-salinity stress (2.5-mol/L NaCl) condition for D. salina and transcriptome sequencing with the Illumina HiSeq 2000 system were reported (He et al., 2020). Additionally, transcriptome sequencing of D. salina from Yuncheng Salt Lake has not been performed to date. Hence, numerous unknown salt tolerance- or stress-related genes have yet to be identified. Our study sought to perform transcriptome sequencing of the wild halophytic alga D. salina, which can tolerate high salinity, collected from the natural salt lake in Yuncheng. To identify the regulated or responsive key genes that may be associated with the salt tolerance of D. salina in this environment, 9 RNA-seq libraries under three different salinity stress conditions were constructed and deep sequenced for this microalga on the new next-generation sequencing platform BGISEQ-500, which has been successfully used in the RNA-seq of many species (Mak et al., 2017). Based on the results of de novo transcriptome sequencing, morphological, physiological, and biochemical analyses of this alga, we characterized its salt-stress-related genes, screened for enriched differentially expressed genes (DEGs), predicted the functions and related biological processes of the DEGs, and conducted gene expression validation and molecular cloning, which will prove helpful for further demonstrating the salt tolerance or response mechanism of this alga. Key gene information will provide insight for improving the quality of D. salina at the molecular level.
2 MATERIAL AND METHOD 2.1 Collection and cultivation of microalgal samplesSamples of D. salina (referred to here as D. salina_YC) were collected from Yuncheng Salt Lake in Shanxi, China (approximately 110°10'30″E, 35°1'10″N), with an environment salinity of ~3.66-mol/L sodium chloride as detected by a BSD-200 salinometer (BELL Analytical Instruments, Co., Ltd., Dalian, Liaoning, China). Following isolation of one pure D. salina_YC strain from these wild samples using capillary and microscopy techniques, the strain was first identified and cultured on BG11 medium with 0.05-mol/L NaCl, 0.017-mol/L NaNO3, 2.0×10⁻⁴-mol/L K2HPO4, 3.0×10⁻⁴-mol/L MgSO4·7H2O, 2.0×10⁻⁴-mol/L CaCl2·7H2O, 2.0×10⁻⁴-mol/L Na2CO3, 3.12-mol/L C6H8O7, 2.14-mol/L C6H10FeNO8, and ultrapure water added to 2.0 L in a pH 7.2 environment. Next, we extracted 1.5-L fresh liquid algae cultured under 10 000-lx irradiance provided by day-light fluorescent tubes for 12 h/d at 20 ℃ in an indoor algal cultivation room. Finally, 150-mL liquid algal solutions from the same strain were exposed to four different salinities (0.05-, 0.51-, 1.03-, and 3.42-mol/L NaCl) by adding the corresponding weight of sodium chloride to the medium. We named these groups as DS_CO, DS_LS, DS_MS, and DS_HS, respectively. DS_CO cultured in raw BG11 medium with 0.05-mol/L NaCl was used as the control group in this study. Moreover, to ensure normal algal growth and avoid microbiological contamination, the D. salina_YC cultures were microscopically examined every 8 d, with necessary nutritional supplements added. The cell densities of DS_CO, DS_LS, DS_MS, and DS_HS during different growth stages were calculated by measuring the optical density (OD) value of liquid algae at 685 nm with a significant optical absorption peak on a UV2600 system (Shimadzu Co., Ltd., Shanghai, China) and drawing a standard curve between cell density and corresponding OD. A flowchart of the entire experiment for D. salina_YC in this study is shown in Supplementary Fig.S1.
2.2 RNA isolation, cDNA library construction and transcriptome sequencingTo ensure the accuracy of sequencing, three biosample replicates of DS_CO, DS_LS, DS_MS, and DS_HS from the above algal strain on the 51st day were selected for RNA isolation (Supplementary Fig.S1). Each sample was enriched by centrifugation (2 500×g) at 4 ℃ and quick-frozen in liquid nitrogen. Next, the pools of total RNA of D. salina_YC were extracted and purified using TRIzol reagent (Invitrogen Life Technologies Inc., Carlsbad, CA, USA). The quality and quantity of the extracted total RNA were estimated using an Agilent 2100 Bioanalyzer (Agilent, Palo Alto, CA, USA). Subsequently, paired-end cDNA libraries were constructed using a SMART cDNA Library Construction Kit (TaKaRa, China) according to the manufacturer's instructions. Sequencing of the transcriptome was conducted using the BGISEQ-500 platform developed in 2015 by Beijing Genomics Institute (BGI), a new convenient high-throughput sequencing platform combined with probe-anchored polymerization and improved DNA nanosphere technology (Mak et al., 2017). Raw sequencing data were deposited in NCBI Short Read Archive (SRA) in 2019 and 2020. The SRA accession numbers can be seen in Data Availability Statement.
2.3 Sequence analysis and de novo transcriptome assemblyThe preliminary transcriptomic library data were filtered and checked using SOAPnuke (https://github.com/BGI-flexlab/SOAPnuke) (Chen et al., 2018). Briefly, reads containing adapters and poly-N (N>5%) on the 5' and 3' ends were removed, and low-quality reads were trimmed. Next, the clean reads meeting quality 20 (Q20) and quality 30 (Q30) criteria (Q20 > 95%, Q30 > 85%) were screened. Further, the lengths of all unigenes containing clusters and singletons were obtained using TGICL (Pertea et al., 2003). Finally, the quality of the D. salina_YC transcriptome assembly was evaluated with BUSCO software (https://busco.ezlab.org/) using default parameters (Seppey et al., 2019).
2.4 Annotation of the transcriptomeBased on the best sequence similarity alignment (E-value≤1 E-10, length percentage of the query sequence≥85%, and nonredundant contigs), functional annotation of the transcriptome was obtained by comparing the assemblies against the Gene Ontology (GO), RefSeq nonredundant protein (NR), nucleotide sequence (NT), Swiss-Prot, Pfam, Kyoto Encyclopedia of Genes and Genomes (KEGG), and euKaryotic Orthologous Group (KOG) databases. GO terms were described using Blast2GO v2.5.0 (Götz et al., 2008). Unigenes assigned a corresponding protein function were annotated in the Swiss-Prot, Pfam, and KEGG pathways with different KEGG orthologies (KOs). All unigenes were aligned to the KOG database and given corresponding protein IDs to obtain annotation results. Categorized information for the screened unigenes with coding sequence (CDS) regions for protein synthesis in eukaryotes (including plants and fungi), bacteria, viruses, and protozoans were predicted according to the NR database (Han et al., 2018). Moreover, poential transcription factors (TFs) were predicted by aligning the open reading frames (ORFs) of unigenes against the sequences stored in the Pfam and PlantTFDB databases with the HMMER program (Jin et al., 2017). All output results for gene annotation were further processed and cleaned to remove duplicates and select the best-matching annotation.
2.5 Gene expression analysesPotential genes were obtained through the alignment of clean reads for each D. salina_YC sample against the corresponding de novo transcriptome reference using Bowtie2 software (http://bowtie-bio.sourceforge.net/Bowtie2/index.shtml) (Langdon, 2015). Next, the gene expression for each algal sample based on RNA-seq was calculated using fragments per kilobase of transcript per million fragments mapped (FPKM) data (Tian et al., 2019). All samples were clustered via principal component analysis (PCA) based on their global gene expression levels. Subsequently, the DEGs for each sample were calculated using the RSEM v1.2.12 package with default parameters (http://deweylab.biostat.wisc.edu/rsem/rsem-calculate-expression.html) (Djebali et al., 2017). The number and distribution of DEGs in the algal samples were screened using DESeq2 software with a fold change ≥|2.00| and adjusted p-value (false discovery rate, FDR) ≤0.05 (Maza, 2016), while significant DEGs were screened with a fold change > |32| and FDR < 0.03. Furthermore, a clustering heat map of DEGs from the three algal comparison groups, the salt-stress groups relative to the control group (DS_LS vs. DS_CO, DS_MS vs. DS_CO, and DS_HS vs. DS_CO) with different FPKM values was constructed by running the heatmap function in R (Hu et al., 2019). Similarly, the expression patterns of DEGs with similar expression trends were predicted by running Mfuzz v2.34.0 (http://mfuzz.sysbiolab.eu) (Kumar and Futschik, 2007).
2.6 Enrichment of GO and KEGG pathwaysBlast2GO software was used to determine the enriched GO terms of the common DEGs among the different D. salina_YC experimental comparison groups and further categorize them into 3 GO functional groups, biological process (BP), molecular function (MF), or cellular component (CC), with Q-values less than 0.01 (Miura et al., 2019). Similarly, the common DEG data-assigned KO IDs were submitted to the KEGG Automatic Annotation Server (KAAS) and mapped to KEGG pathways categorized into different KEGG functional groups, including cellular process, environmental information processing, genetic information processing, metabolism, and organismal system (Moriya et al., 2007). The KEGG pathway enrichment results were further analyzed by using the phyper function of R software with a Q-value less than 0.01 (Lee et al., 2019).
2.7 Quantitative PCRFifteen common significantly enriched DEGs among the 3 D. salina_YC experimental groups as detected by GO and KEGG pathway analyses were selected for real-time quantitative PCR (qPCR) validation in this study. Total RNA was extracted from each experimental group using the RNAsimple Total RNA Kit (DP419) according to the manufacturer's instructions (Tiangen, China). Next, total RNA was used to synthesize cDNA using the PrimeScriptTM RT reagent kit according to the manufacturer's instructions (TaKaRa, China). Subsequently, each qPCR was performed in a final 20-μL reaction volume containing 2-μL cDNA template, 8-μL SYBR Premix Ex Taq (TaKaRa), 2-μL primers at a 2.5-μmol/L concentration, and 8-μL distilled water. Primers were designed based on the transcripts and synthesized by Invitrogen Biotech Co., Ltd. (Shanghai, China). Finally, qPCR was performed using the Applied Biosystems StepOnePlusTM Real-Time System (Thermo Scientific, Waltham, MA, USA) with the following cycle conditions: 95 ℃ for 1 min, followed by 40 cycles of 95 ℃ for 15 s, 50–58 ℃ for 20 s (depending on the optimal melting temperature for each primer pair), and 72 ℃ for 20 s, with a final 72 ℃ step for 5 min.
We used the Cq value of RPL2, a housekeeping gene encoding ribosomal protein L2 in D. salina (Smith et al., 2010), for normalization in qPCR analysis due to Cq values with a relatively small standard deviation (SD) range (0.51–0.54) based on BestKeeper 3.0 and stability value range (0.014–0.019) based on NormFinder among the different D. salina_YC experimental groups. Biological replication was performed in triplicate. The expression of common DEGs was calculated using the 2-ΔΔCt method (Ruijter et al., 2015) and quantified relative to the expression of RPL2. Statistical analysis of the fold change in gene relative expression based on qPCR was performed by calculating the ratio of 2(DS_LS, DS_MS, or DS_HS)-ΔΔCt to 2(DS_CO)-ΔΔCt with SPSS software and Student's t-tests. Similarly, the fold change in gene relative expression based on RNA-seq data was obtained by calculating the ratio of FPKM(DS_LS, DS_MS, or DS_HS) to FPKM(DS_CO).
2.8 Cloning and sequence analysis of GGPS and DGAT from D. salina_YCThe average fold changes of the common DEGs based on RNA-seq and qPCR data showed that ggps (unigene 47314, geranylgeranyl diphosphate synthase gene) and dgat (unigene 16111, diacylglycerol O-acyltransferase gene) were the relatively significant. We first selected them for cDNA full-length cloning in D. salina_YC. Based on the two genes' transcripts, we designed corresponding nested primer pairs to clone the full-length cDNAs using a SMART RACE Kit (TaKaRa). According to the manufacturer's instructions, the PCR systems were prepared for a minimum of three PCR rounds with the cDNA of D. salina_YC samples mixture under 4 salinity conditions as the template. The first PCR was conducted with the following program: 95 ℃ for 3 min, followed by 5 cycles of 94 ℃ for 30 s and 72 ℃ for 3 min; another 5 cycles of 94 ℃ for 30 s, 70 ℃ for 30 s, and 72 ℃ for 3 min; a final 20 cycles of 94 ℃ for 30 s, 60 ℃ for 30 s, and 72 ℃ for 3 min; and finally, 72 ℃ for 5 min. Next, nested PCR was conducted with the following PCR program: 94 ℃ for 3 min, followed by 25 cycles of 94 ℃ for 30 s, 55 ℃ for 30 s, and 72 ℃ for 3 min, and finally, 72 ℃ for 5 min. The cDNA sequences and amino acids of the genes were analyzed using the following bioinformatic tools: BLASTn and BLASTp for sequences alignment analysis, ORFfinder (https://www.ncbi.nlm.nih.gov/orffinder/) for ORF detection (Wheeler et al., 2004), DNAMAN v.4.0 for prediction of amino acids (Song et al., 2009), ExPASy (http://cn.expasy.org) for prediction of protein pI and calculation of molecular weight (MW) (Gasteiger et al., 2003), ProtScale (https://web.expasy.org/protscale/) for detection of protein hydrophobicity (Seddigh and Darabi, 2018), SWISS-MODEL (https://www.swissmodel.expasy.org/) for prediction of protein 3D model structure (Biasini et al., 2014), Clustal v.2.0 for multiple amino acid sequence alignment, G-blocks for redundant data removal, and MEGA v.6.0 software (Jin et al., 2015) for construction of a protein phylogenetic tree with the maximum-likelihood (ML) algorithm. The GTR substitution model was used for ML tree construction, with a discrete gamma distribution among amino acid sites and a gamma-distributed with invariant sites (G+I) rate among sites. The bootstrap consensus ML tree was inferred from 1 000 replicates.
2.9 Analysis of physiological and biochemical characteristicsThe total lipid content (TLC) (mg/cell) of each D. salina_YC experimental group at different growth periods (1, 6, 11, 16, 21, 26, 31, 36, 41, 46, and 51 d) was measured using the ratio of total lipids detected with the chloroform-methanol method to algal cell quantity (Huang and Kim, 2017). The photochemical (PC) efficiency of PSII was determined for the 4 D. salina_YC experimental groups during the same growth periods above by measuring the ratios of variable fluorescence (Fv)/maximum fluorescence (Fm) and Fv/minimum florescence (Fo) (Wang et al., 2017) on a CCM-300 chlorophyll fluorescence monitor (Opti-Sciences Inc., Boston, OH, USA). The superoxide dismutase (SOD) specific activity (SSA) (U/mg) of each D. salina_YC experimental group at 51 d at different stress times (1, 10, 20, 30, 40, 50, and 60 min) was detected by calculating the ratio of total SOD activity (Zhang et al., 2014) detected with a SOD Assay Kit (BioVision Inc., San Francisco, CA, USA) to algal total protein content detected with the trichloroacetic acid-acetone precipitation method (Wu et al., 2014). The beta-carotene content (BCC) (mg/cell) of each D. salina_YC experimental group at different growth phases was evaluated by calculating the ratio of beta-carotene quality to algal cell quantity. Beta-carotene quality was calculated by detecting the OD values of algal beta-carotene extracts at 450 nm (a prominent peak appears at this wavelength) combined with the beta-carotene concentration standard curve of D. salina_YC (Fazeli et al., 2006). All physiological and biochemical indexes for the D. salina_YC experimental groups were calculated with three replicates for each sample. Student's t-tests were used for statistical analyses. Significance was annotated using different types of letters or different numbers of asterisks.
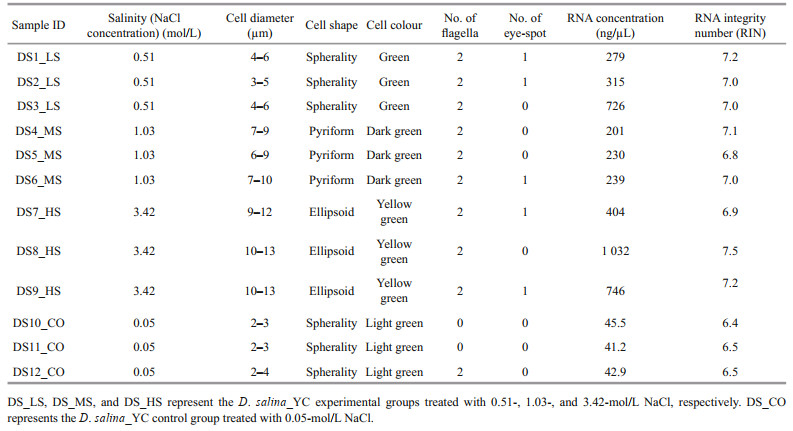
3 RESULT 3.1 Morphology and growth characteristicsMorphological observation combined with growth kinetics of the D. salina_YC cells showed that ~51 d was the stationary phase (Fig. 1a & b). Accordingly, this was the optimum time for microscopic observation of the algae, as well as for RNA extraction and sequencing (Table 1). Markedly smaller spherical algal cells (2–4 μm) with lighter pigmentation were observed in DS_CO during the growth stages (mean cell density, 5.337×10⁴ cells/mL) compared to the other experimental groups (mean cell density, 9.350×10⁵ cells/mL) (Supplementary Table S1a), which indicated that NaCl is a necessary nutrient for algal cell development and that a very low concentration of NaCl in the medium was insufficient for substantial D. salina_YC indoor growth. Unlike the DS_HS cells with more yellow or yellow-orange pigment (9–13-μm size), which had more lipids and larger cells and pyrenoids, DS_LS and DS_MS cells (3–10-μm size) contained green or yellow-green pigmented cells, fewer lipids, and smaller pyrenoids. In addition, the majority of D. salina_YC cells had two flagella, which facilitated their movement and capture of nutrients in the salt water; however, no noticeable eyespots were observed (Fig. 1a; Table 1). Furthermore, the order of maximum cell density during the algal stationary phase was DS_LS (2.805×10⁶ cells/mL) > DS_MS (2.102×10⁶ cells/mL) > DS_HS (8.527×10⁵ cells/mL) > DS_CO (1.334×10⁵ cells/mL) (Fig. 1b, Supplementary Table S1), indicating that low and moderate concentrations of NaCl were beneficial for indoor culture of D. salina_YC.

|
| Fig.1 Morphology and growth of D. salina_YC cells under 4 different salinity treatments a. single-cell morphology of DS_CO, DS_LS, DS_MS, and DS_HS on days 11, 31, and 51 as observed by microscopy at the 2-10-μm scale; b. cell density and growth trend of DS_CO, DS_LS, DS_MS, and DS_HS within 61 d with their standard growth curve at OD685 nm. DS_LS, DS_MS, and DS_HS represent the D. salina_YC experimental groups treated with 0.51-, 1.03-, and 3.42-mol/L NaCl, respectively. DS_CO represents the D. salina_YC control group treated with 0.05-mol/L NaCl. Significant is shown with an asterisk (*) indicating P < 0.05 according to Student's t-test. |
Although genome annotations of D. salina were reported in 2017 (Polle et al., 2017), they were not suitable for the transcriptomic analysis performed in this study, as considerably few effective gene annotations (merely 143 effective functional genes in D. salina) and a low RNA-seq data percentage (merely approximately 44.06%) mapped to the reference genome Dsal_v1.0 (NSFN00000000.1). Thus, the de novo assembly approach was applied for the Yuncheng D. salina transcriptomic analysis in this study.
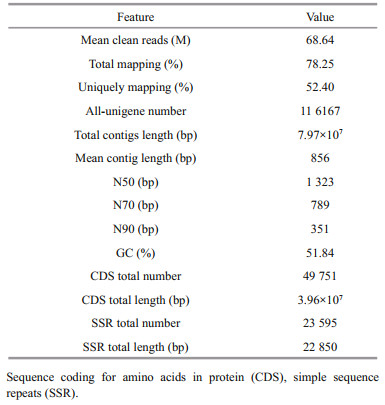
A total of 886.64 M raw reads was obtained through RNA-seq based on the 12 cDNA libraries for the 4 D. salina_YC experimental samples (Supplementary Table S2). An average of 68.64 M clean reads per algal sample (accounting for 92.36% of the total reads) was obtained, with an average contig length of 856 bp after filtering adapters, sequences with unknown bases (N > 5%), and low-quality reads (Table 2). Supplementary Table S2a shows the nucleotide quality of the clean reads (average percentages of Q20 and Q30 were 97.49% and 89.78%). In addition, 78.25% of the total clean reads were mapped onto the genome of D. salina (52.40% of the unique clean reads mapped). The salt-response-related de novo transcriptome of D. salina_YC was assembled, yielding 116 167 unigenes with a total length of 7.97×10⁷ bp (unigene numbers among all 12 algal samples are shown in Supplementary Fig.S2a), and after the removal of redundant data, an N50 of 1 323 bp and a GC percentage of 51.84% were obtained (Table 2). Completeness of the de novo assembly was investigated using BUSCO assessment, which identified 179 complete single copies and 142 complete duplications among all unigenes, yielding an integrity over 90% (Supplementary Fig.S2b). A total of 4 9751 CDSs (total length of 3.96×10⁷ bp) were predicted with an N50=978 bp and a GC%=52.95% (Supplementary Table S2b & Fig.S2c). Moreover, 23 595 simple sequence repeat (SSR) markers (total length of 2.285×10⁴ bp; Table 2) were detected among 13 621 unigenes with 1–6 nucleotide repeats (Supplementary Table S2c).
Of the 116 167 unigenes (Supplementary Table S3a), 71 932 (79.67%) were annotated using the following databases: NR, NT, Swiss-Prot, KEGG, KOG, Pfam, and GO (Table 3). A total of 4 593 (5.05%) unigenes were annotated using all seven databases. Details regarding the quantity of intersecting genes are shown in five-dimensional Venn diagrams (Supplementary Fig.S3a–c). Taxonomic analysis demonstrated that 15.62% of the 48 502 screened unigenes with CDS regions were found in three algae, namely, Chlamydomonas eustigma, Gonium pectorale, and Volvox carteri, while another 11.70% matched the genes of land plants, namely, Dorcoceras hygrometricum and Ricinus communis (Fig. 2a; Supplementary Table S3b). In addition, 46.56% of the D. salina_YC unigenes with CDSs were shared with bacteria, 12.94% with protozoans, 0.56% with viruses, and 4.07% with fungi. Last, 4 147 (8.55%) unigenes were shown unique to D. salina_YC (Fig. 2a). Moreover, 358 putative genes were predicted in 33 plant TF families, with the highest number of genes (52) predicted in the v-myb avian myeloblastosis viral oncogene homolog (MYB) (Kawase et al., 2017) (Fig. 2b).


|
| Fig.2 Unigene annotation, expression, and PCA of D. salina_YC under 4 salinity treatments based on transcriptomic data a. top-hit species distribution of BLAST matches of D. salina_YC transcribed unigenes to coding sequences annotated in the NR database; b. number of D. salina_YC unigenes annotated as members of the transcription factor (TF) families in plants based on the results of TF prediction and classification; c. percentage of unigenes based on FPKM data among 12 D. salina_YC samples (FPKM≥10 for high expression, 1 < FPKM < 10 for moderate expression, and FPKM≤1 for low expression); d. PCA of 12 D. salina_YC samples under different salinity stresses based on unigene expression levels. DS_LS, DS_MS, and DS_HS represent the D. salina_YC experimental groups treated with 0.51-, 1.03-, and 3.42-mol/L NaCl, respectively. DS_CO represents the D. salina_YC control group treated with 0.05-mol/L NaCl. The expression of unigenes in D. salina_YC is shown using reads per kilobase of exon model per million mapped reads (FPKM). The light blue boxes represent different sample groups based on PCA analysis. |
The gene expression densities of the 12 algal samples were different, with two main expression peaks detected (Supplementary Fig.S3d). Furthermore, 8 763 on average of highly expressed unigenes (FPKM≥10) were detected in the 12 algal samples (Fig. 2c; Supplementary Table S3c). Most of the remaining unigenes (overall coverage of 87.69%) were expressed at low levels in the algal samples, with an FPKM < 10 (Fig. 2c; Supplementary Table S3c). Moreover, based on the gene expression information presented above, the three parallel biosamples of each D. salina_YC experimental or control group clustered together in PCA (Fig. 2d; Supplementary Table S3d).
3.4 DEG analysis and clusteringA total of 46 585 upregulated and 47 805 downregulated genes were identified without removing the redundant data by comparing the FPKM values of DS_LS to DS_CO, DS_MS to DS_CO, and DS_HS to DS_CO (Supplementary Fig.S4). In addition, some significant DEGs (a fold change > |32|, FDR < 0.03) were detected by comparing the FPKM values of DS_LS vs. DS_CO (54 upregulated and 41 downregulated DEGs) and DS_MS vs. DS_CO (34 upregulated and 48 downregulated DEGs) (Fig. 3a & b; Supplementary Table S4a). Moreover, a few significant DEGs could be detected between DS_HS and DS_CO (18 upregulated and 25 downregulated DEGs) (Fig. 3c).

|
| Fig.3 Volcano plot and Venn diagram of differentially expressed genes (DEGs) in D. salina_YC under 4 salinity stresses based on transcriptomic data a. DEGs between DS_LS and DS_CO; b. DEGs between DS_MS and DS_CO; c. DEGs between DS_HS with DS_CO; d. Venn diagram of DEGs among the 3 comparison groups: DS_LS vs DS_CO, DS_MS vs DS_CO, and DS_HS vs DS_CO. The DEGs were generated by comparing the gene expression values of the D. salina_YC experimental groups under 0.51-mol/L NaCl (DS_LS), 1.03-mol/L NaCl (DS_MS), and 3.42-mol/L NaCl (DS_HS) stresses with that of DS_CO as a control (0.05-mol/L NaCl). Significant DEGs shown as scatter points in the volcano plot were screened with the 2 blue threshold lines (a fold change < |32| and an adjusted P-value (FDR) < 0.03). |
In total, 188 common DEGs were obtained by analyzing the intergroup unigenes of D. salina_YC comparison groups (DS_LS vs. DS_CO, DS_MS vs. DS_CO, and DS_HS vs. DS_CO) (Fig. 3d). Additionally, based on the expression levels of these common DEGs, their comparison groups, DS_LS vs. DS_CO and DS_MS vs. DS_CO, grouped together, with more common DEGs upregulated (FPKM≥8.0) than downregulated (Fig. 4). More downregulated common DEGs (FPKM≤6.0) were detected in the comparison group of DS_HS vs. DS_CO. Furthermore, we divided them into 4 main clusters (clusters Ⅰ, Ⅱ, Ⅲ, and Ⅳ) from 12 cluster blocks based on their relative expression levels (Supplementary Table S4b). Moreover, four different genes relative expression patterns were predicted based on the expression change trend of these genes (Fig. 4).

|
| Fig.4 Heat map and potential expression pattern of the common DEGs among the 3 comparison groups: DS_LS vs. DS_CO, DS_MS vs. DS_CO, and DS_HS vs. DS_CO DS_LS, DS_MS, and DS_HS represent the D. salina_YC experimental groups treated with 0.51-, 1.03-, and 3.42-mol/L NaCl, respectively. DS_CO represents the D. salina_YC control group treated with 0.05-mol/L NaCl. The scale represents gene expression values generated from reads per kilobase of exon model per million mapped reads (FPKM) values. The 3 columns represent the three comparison groups above, with gene expression values of DS_CO as the control. Four clusters are divided based on these genes' FPKM values, with 4 potential expression patterns shown on the right. |
The DEGs in D. salina_YC were grouped into diverse functions and pathways according to their assigned GO terms and KO IDs (Supplementary Table S5a & b). The number of DEGs in DS_LS vs. DS_CO was higher than that observed in DS_MS vs. DS_CO and in DS_HS vs. DS_CO (Supplementary Fig.S5a & b). According to the GO classification criteria (Han et al., 2018), the majority of the DEGs were assigned to cellular components and biological processes (Supplementary Fig.S5a). Additionally, most of the DEGs were assigned to metabolism pathways according to the KEGG pathway classification criteria (Supplementary Fig.S5b) (Lee et al., 2019).
Furthermore, among the top 20 GO enriched terms of the common set of DEGs in the 4 clusters, the terms acetyl-CoA carboxylase activity (Qvalue=1.00E-10, term number=120), photosystem Ⅱ (Q-value=1.00E-50, term number=3 500), defense response to reactive oxygen species (ROS) and salt stress (Q-value=1.00E-06, term number=28), and carotenoid biosynthesis (Q-value=3.16E-09, term number=2 500) were the most significant enriched GO terms in clusters Ⅰ, Ⅱ, Ⅲ, and Ⅳ, respectively (Fig. 5a–d). Similarly, the top 20 KEGG pathways that were enriched based on the common set of DEGs in the 4 clusters included fatty acid biosynthesis (Q-value=1.00E-44, pathway number=40), photosynthesis-antenna protein (Q-value=1.00E-75, pathway number=1 500), active oxygen metabolism (Q-value=1.00E-37, pathway number=8), and carotenoid metabolism (Q-value=1.00E-62, pathway number=550) as the most significant pathways in clusters Ⅰ, Ⅱ, Ⅲ, and Ⅳ, respectively (Fig. 6a–d).

|
| Fig.5 GO functional enrichment of the common DEGs divided into 4 clusters among the 3 comparison groups: DS_LS vs. DS_CO, DS_MS vs. DS_CO, and DS_HS vs. DS_CO Categories were filtered by Fisher's exact test with a Q-value less than 0.01. The top 20 GO terms assigned to the DEGs are shown on the right. DS_LS, DS_MS, and DS_HS represent the D. salina_YC experimental groups treated with 0.51-, 1.03-, and 3.42-mol/L NaCl, respectively. DS_CO represents the D. salina_YC control group treated with 0.05-mol/L NaCl. The complete information omitted on the y-axis in (b) is defense response to fungus, incompatibe interaction, in (c) are dimethylpropiothetin dethlomethylase activity, 3-deoxy-manno-octulosonate cytidylytransferase activity, respectively, and in (d) are defense response to fungus, incompatibe interaction, photosynthetic electron transport in photosystem Ⅱ, ATP synthesis coupled electron transport, electron transporter, transferring electron within CoQH2-cytochrome c reductase complex activity, succinate-semialdehyde dehydrogenase (NAD+) activity, respectively. |

|
| Fig.6 KEGG pathway functional enrichment of the common DEGs divided into 4 clusters in the 3 comparison groups: DS_LS vs. DS_CO, DS_MS vs. DS_CO, and DS_HS vs. DS_CO Categories were filtered by Fisher's exact test with a Q-value less than 0.01. The top 20 KEGG pathways assigned to the DEGs are shown on the right. DS_LS, DS_MS, and DS_HS represent the D. salina_YC experimental groups treated with 0.51-, 1.03-, and 3.42-mol/L NaCl, respectively. DS_CO represents the D. salina_YC control group treated with 0.05-mol/L NaCl. The complete information omitted on the y-axis in (a) is ubiquinone and other terpenoid-quinone biosynthesis, in (b) are protein processing in endoplasmic reticulum, pentose and glucuronate interconversions, respectively, in (c) are glycosphingolipid biosynthesis-globo and isoglobo series, glycosphingolipid biosynthesis-ganglio series, respectively, and in (d) are protein processing in endoplasmic reticulum, pentose and glucuronate intercon-versions, respectively. |
The expression levels of the common DEGs in the 3 D. salina_YC comparison groups involved in the significantly enriched biological processes or metabolic pathways were compared via calculating their FPKM expression ratios of salt-stress group to control group (Fig. 7a–d). FPKM mean values of the common DEGs in DS_CO classed into cluster Ⅰ, Ⅱ, Ⅲ, and Ⅳ were 2.02, 7.23, 2.61, and 1.64, respectively. Downregulated DEGs that globally repressed acetylCoA carboxylase activity or fatty acid biosynthesis obtained from GO and KEGG pathway in cluster Ⅰ were detected in DS_HS vs. DS_CO (FPKM mean ratio of 2.23) relative to DS_LS vs. DS_CO (FPKM mean ratio of 6.26) and DS_MS vs. DS_CO (FPKM mean ratio of 10.28) (Fig. 7a). Upregulated expression trends of the DEGs encoding the components of photosystem Ⅱ or photosynthesis-antenna protein obtained from GO and KEGG pathway in cluster Ⅱ were overall similar between DS_LS vs. DS_CO (FPKM mean ratio of 15.54) and DS_MS vs. DS_CO (FPKM mean ratio of 16.66) (Fig. 7b). Global upregulated DEGs that mediated algal cells defense responses to ROS or salt stresses, or involved in active oxygen metabolism in this alga obtained from GO and KEGG pathway in cluster Ⅲ were detected in DS_MS vs. DS_CO (FPKM mean ratio of 10.26) and DS_HS vs. DS_CO (FPKM mean ratio of 13.74) (Fig. 7c). Overall expression trend of DEGs involved in carotenoid biosynthesis or metabolism obtained from GO and KEGG pathway in cluster Ⅳ were upregulated in DS_HS vs. DS_CO (FPKM mean ratio of 7.67) relative to DS LS vs. DS_CO (FPKM mean ratio of 4.98) and DS_MS vs. DS_CO (FPKM mean ratio of 2.88) (Fig. 7d).

|
| Fig.7 Expression proflies of the common DEGs in the 3 comparison groups: DS_LS vs. DS_CO, DS_MS vs. DS_CO, and DS_HS vs. DS_CO in the significantly enriched GO and KEGG pathways with 4 clusters, measured by the reads per kilobase of exon model per million mapped reads (FPKM) ratio of the experimental group to the the control DS_LS, DS_MS, and DS_HS represent the D. salina_YC experimental groups treated with 0.51-, 1.03-, and 3.42-mol/L NaCl, respectively. DS_CO represents the D. salina_YC control group treated with 0.05-mol/L NaCl. |
Fifteen genes were randomly selected from the common DEGs in the most significant enriched GO terms and KEGG pathways for qPCR validation. Detailed gene annotation, potential function, and PCR primer information are shown in Supplementary Table S6a & b. The qPCR results showed that all genes were differentially expressed among the 4 D. salina_YC experimental groups. The differential expression trend detected by qPCR was relative identical to that identified by RNA-seq (Fig. 8a–d; Table 4). Relative to the DEGs of DS_CO, the significant differential expression of lacs, nadb, dagt, lhcb5, lhcbm8, cpld35, and ggps in other D. salina_YC experimental groups with higher salinity stress (more than 0.05-mol/L NaCl) could be clearly observed not only in RNA-seq, but also in qPCR analysis (Fig. 8a–d). Among these genes, fsd1 obtained from the enriched common DEGs in cluster Ⅲ was markedly upregulated between DS_LS and DS_HS relative to DS_CO based on qPCR analysis (Δ fold change=5.7, P-value < 0.01) (Fig. 8c). Four genes obtained from clusters Ⅰ and Ⅱ, namely, lacs, nadb, lhcb5, and lhcbm8, were upregulated between DS_LS and DS_MS relative to DS_CO based on qPCR analysis (Δ fold change > 0.3, P-value < 0.05) (Fig. 7a & b). Additionally, among these significant genes (fold change > 10), the ggps obtained from cluster Ⅵ was a markedly linearly downregulated gene among the 3 D. salina_YC comparison groups with increasing salinity relative to DS_CO (Δ fold change < -1.2, P-value < 0.01) (Fig. 8d). Furthermore, the gene dgat obtained from cluster Ⅰ markedly upregulated between DS_LS and DS_MS relative to DS_CO (Δ fold change=3.3, P-value < 0.001), but markedly downregulated between DS_LS and DS_HS relative to DS_CO (Δ fold change=-24.2, P-value < 0.001) (Fig. 8a).

|
| Fig.8 Comparative analyses of relative expression levels of the 15 common DEGs significantly enriched in GO and KEGG pathways a. 4 common DEGs (lacs, nadb, dagt, and acat1) in cluster Ⅰ; b. 4 common DEGs (lhcbm5, cab-8, lhcb5, and lhcbm8) in cluster Ⅱ; c. 3 common DEGs (cpld, fsd1, and prxq) in cluster Ⅲ; d. 4 common DEGs (ggps, riba2, cartiso, and crtr) in cluster Ⅳ. The fold change for RNA-seq was obtained via the FPKM of DS_LS, DS_MS, or DS_HS over the FPKM of DS_CO. The fold change for qPCR was obtained via the 2-ΔΔCt of DS_LS, DS_MS, or DS_HS over the 2-ΔΔCt of DS_CO. DS_LS, DS_MS, and DS_HS represent the D. salina_YC experimental groups treated with 0.51-, 1.03-, and 3.42-mol/L NaCl, respectively. DS_CO represents the D. salina_YC control group treated with 0.05-mol/L NaCl. Student's t-test was used to check for significant differences. *: significant difference (P < 0.05); **: very significant difference (P < 0.01); ***: indicates an extremely significant difference P < 0.001). A fold change (FC) of 10 is the relative expression threshold. The fold change variation (ΔFC) of the significant DEGs based on qPCR analysis among different comparison groups are showed. |

|
As shown in Table 4, the functions of the 4 validated genes, lacs, nadb, dgat, and acat1, are related to some key enzymes regulating the processes of fatty acid biosynthesis and degradation. Among the genes, dgat was the best candidate gene for its full cDNA clone based on its relative significant expression change in the 3 comparison groups (P-value at least less than 0.01) measured by qPCR (Table 4; Fig. 8a). The functions of lhcbm5, cab-8, lhcb5, and lhcbm8 are related to the biosynthesis of some component proteins in PSII. The functions of cpld35, fsd1, and prxq are related to the biosynthesis of enzymes involved in active oxygen metabolism. The functions of ggps, riba2, cartiso, and crtr are related to the biosynthesis or regulation of some limiting enzymes in carotenoid or biosynthesis metabolism of biopigment. Among these genes, the extremely significantly differentially expressed gene ggps is another prime molecular clone candidate gene because its relative significant expression change in the 3 comparison groups (P-value at least less than 0.01) measured by qPCR analysis (Table 4; Fig. 8d).
3.8 Characterization of DsGGPS and DsDGATBased on the unigene information of ggps (unigene 47 314) from transcriptome sequencing, the key gene DsGGPS (encoding geranylgeranyl diphosphate synthase) in D. salina_YC was successfully cloned via RACE with specific PCR primers (Supplementary Table S7a & Fig.S6a). A full-length 1 876-bp DsGGPS cDNA (MW=581.57 kDa) with a 220-bp 5' untranslated region (UTR) and a 582-bp 3' UTR was assembled (Fig. 9a). A 1 074-bp CDS was obtained for this gene with the same length as the predicted ORF. As a key enzyme in the biosynthesis of beta-carotene, the hydrophobic GGPS of D. salina_YC (average value of hydrophobicity (Hphob./Kyte & Doolittle) was -0.297, as shown in Supplementary Fig.S6b) contained 357 amino acids, of which Ala accounted for the highest proportion (12.04%) and Cys accounted for the lowest proportion (1.96%). This predicted GGPS, with diverse amino acid sequences among plant species (Supplementary Fig.S6c), belongs to the isoprenoid biosynthesis C1 superfamily (Supplementary Fig.S6d) (Emmerstorfer-Augustin et al., 2016). Its pI value was 6.71 and MW value was 38.88 kDa in D. salina_YC. The putative 3D structure of GGPS in D. salina_YC was also predicted, with no signal peptides or transmembrane regions detected (Supplementary Fig.S6e). This GGPS appears to be a relatively conserved enzyme in the ML tree, with the highest homology among the four Dunaliella species (Fig. 9b).

|
| Fig.9 Sequences analyses of the geranylgeranyl diphosphate synthase and diacylglycerol O-acyltransferase coding gene in D. salina_YC (DsGGPS and DsDGAT), and prediction of their encoded proteins a. full-length DsGGPS cDNA and its deduced amino acid sequences. Lowercase letters represent noncoding region bases. Compact capital letters represent coding region bases. Separated capital letters represent the abbreviations of amino acids; *: potential stop codon; b. phylogenetic tree of GGPSs in 17 plant species constructed using the maximum likelihood (ML) method. The number at each node of the tree indicates the support rate of the branch according to a bootstrap test with 1 000 repetitions. The protein accession number is presented in parentheses; c. full-length DsDGAT cDNA and its deduced amino acid sequences. Lowercase letters represent noncoding region bases. Compact capital letters represent coding region bases. Separated capital letters represent the abbreviations of amino acids; *: potential stop codon; d. phylogenetic tree of DGATs in 17 plant species constructed using the ML method. The number at each node of the tree indicates the support rate of the branch according to a bootstrap test with 1 000 repetitions. The protein accession number is presented in parentheses. |
Based on the unigene information of dgat (unigene 16 111), the key gene DsDGAT (encoding diacylglycerol O-acyltransferase) in D. salina_YC was also cloned via RACE with specific PCR primers (Supplementary Table S7b & Fig.S7a). A full length of 2 915-bp DsDGAT cDNA (MW=918.64 kDa) with a 515-bp 5' untranslated region (UTR) and a 756-bp 3' UTR was assembled (Fig. 9c). A 1 644-bp CDS was obtained in this alga with the ORFs predicted. The longest ORF was converted into a potential hydrophilic protein (the average value of Hphob./Kyte & Doolittle was 0.021, as shown in Supplementary Fig.S7b) with 547 amino acids (pI=9.51, MW=62.55 kDa). In the amino acids of this predicted protein, Leu had the highest (13.71%) proportion, and Cys had the lowest (1.83%) proportion; furthermore, the protein was predicted to encode DGAT in D. salina_YC, a key enzyme with diverse amino acid sequences among plant species (Supplementary Fig.S7c) that catalyzes the synthesis of triglycerides in the process of fatty acid biosynthesis and belongs to the membrane-bound O-acyl transferase (MOGAT) superfamily (Supplementary Fig.S7d) (Wang et al., 2013). The potential 3D model structure of this enzyme was also predicted, with no signal peptides or transmembrane regions detected (Supplementary Fig.S7e). The ML tree of DGATs showed that the amino acid sequence of DGAT in D. salina_YC was similar to those of DGATs in two green algae, C. zofingiensis and Raphidocelis subcapitata (Fig. 9d). The information obtained on both genes has been uploaded to GenBank in 2019 with the gene accession numbers MN172173 and MN172172.
3.9 Physiological and biochemical characterizationTLC, photochemical (PC) efficiency, SSA, and BCC in the 3 D. salina_YC experimental groups with DS_CO as the control were tested. These representative physiological/biochemical indexes could reflect the main metabolic situations or biological processes of this alga that in the 15 validated genes involved. As Fig. 10a and Supplementary Table S8a shown, the TLC of D. salina_YC cells increased as salinity and growth time increased. However, the TLC of DS_HS was the highest (maximum TLC value=(1.53±0.30)× 10-4 mg/cell, all ratio values of TLC during the whole growth period relative to DS_CO>5). The maximum and potential PC efficiencies of D. salina_YC cells were inhibited with increasing salinity (Fig. 10b & c; Supplementary Table S8b & c). The PSII primary PC efficiency (Fv/Fm) of DS_HS, DS_MS, and DS_LS was less than half within 3, 9, and 31 d, respectively (Fig. 10b). The PSII potential PC activity (Fv/Fo) of DS_HS was less than half within 46 d (Fig. 10c). By contrast, the PC efficiency of DS_CO was the least affected (ΔFv/Fm=0.11, ΔFv/Fo=0.94). Unlike the ratio of SSA, which exhibited slight fluctuations among the 3 algal comparison groups (relative to DS_CO), the SSA of the D. salina_YC cells at their mature phase was enhanced with an increasing NaCl concentration and prolonged growth time (Fig. 10d, Supplementary Table S8d). The maximum SSA value reached 0.22±0.01 U/mg in DS_HS at the mature phase at 60 min, with approximately 11 times higher SOD specific activity relative to that in DS_CO. Moreover, based on the beta-carotene extracts concentration (Supplementary Fig.S8, Tables S8e), both the BCC of D. salina_YC cells under high-salinity stress (maximum BCC value was 13.34±0.35 mg/cell on day 51) and their ratio relative to the control were the highest (maximum ratio of BCC relative to control was 8.8±0.49 on day 46) among the 3 D. salina_YC comparison groups (Fig. 10e).

|
| Fig.10 Comparative analyses of physiological and biochemical indexes in D. salina_YC under different salinity stresses a. comparative analyses of TLC in 3 D. salina_YC comparison groups relative to DS_CO. The value of TLC was obtained as the algal total lipid content (mg) over algal cell count; b. maximum photochemical efficiency (Fv/Fm) of D. salina_YC under 4 salinity stresses with a threshold line (Fv/Fm=0.5). Fv is the variable fluorescence, and Fm is the maximum fluorescence. Significant is shown with an asterisk (*) indicating P < 0.05 according to Student's t-test; c. potential photochemical efficiency (Fv/Fo) of D. salina_YC under 4 salinity stresses with a threshold line (Fv/Fo=0.5). Fv is the variable fluorescence, and Fo is the minimum florescence. Significant is shown with an asterisk (*) indicating P < 0.05 according to Student's t-test; d. comparative analyses of SSA in 3 D. salina_YC comparison groups relative to DS_CO. The value of SSA was obtained as the total SOD activity (U) over the total protein quality (mg) of the alga at 60 min at the mature phase (~51 d); e. comparative analyses of BCC in 3 D. salina_YC comparison groups relative to DS_CO. The value of BCC was obtained as algal beta-carotene quality (mg) over algal cell count. Ratios of total lipid content (TLC), SOD specific activity (SSA), and beta-carotene content (BCC) between DS_LS, DS_MS or DS_HS and DS_CO were calculated with a 5.0 times threshold. Differences in ratios between D. salina_YC comparison groups are shown with different numbers of lowercase letters. DS_LS, DS_MS, and DS_HS represent the D. salina_YC experimental groups stressed with 0.51-, 1.03-, and 3.42-mol/L NaCl, respectively. DS_CO represents the D. salina_YC control group treated with 0.05-mol/L NaCl. |
Shetty et al. (2019) reported that the low salinity condition (0.05–0.15-mol/L NaCl) increased the photosynthetic activity of D. salina over a short period of time but that higher salinity (0.3–0.4-mol/L NaCl) decreased it over a long period of time. The medium salinity, 0.5-mol/L NaCl, used as the stress condition for transcriptomic analysis of D. salina during its stationary phase revealed 4 core elements of the Dunaliella salt stress response system (Panahi et al., 2019). Another transcriptomic analysis of D. salina with a high-salinity treatment (2.5-mol/L NaCl) for 2 h revealed a large number of upregulated genes involved in 7 different metabolic or biological processes (He et al., 2020). Based on the above findings, we found that a more detailed salinity gradient treatment would be essential for revealing much more interesting functional genes and physiological features in this alga. Herein, 0.51-, 1.03-, and 3.42-mol/L NaCl concentrations were used as the abiotic stress conditions with 0.05-mol/L NaCl concentration as a control condition for transcriptomic analysis of this unique high-salt-tolerant Dunaliella species from Yuncheng Salt Lake.
Recently, transcriptomic analysis has helped elucidate the complexity of gene regulation under salt stress condition in algae. In this study, the D. salina_YC RNA-seq data per algal sample (mean value of raw reads: 73.9 M, mean value of clean reads: 68.6 M, GC mean content: 51.84%) obtained from the BGISEQ-500 platform were more abundant than the RNA-seq data of D. salina (value of raw reads: 38.5 M, clean reads: 31.2 M, GC content: 50%) obtained with the Illumina GAⅡx platform (Panahi et al., 2019). Moreover, each cDNA library of D. salina_YC exhibited a Q20% ranging from 97.42% to 97.67%, which are close to the percentages reported for D. salina strain CCAP19/18 and D. salina strain CCAP 19/30 (Polle et al., 2017; He et al., 2020). The number of CDSs in D. salina_YC based on BGISEQ-500 was 4 9751, ranging from 297 to 11 943 bp in length, which is higher than that generated for D. salina CCAP 19/30 with the Illumina HiSeq 2000 system (43 864 CDSs, ranging from 242 to 8 978 bp) (He et al., 2020). Furthermore, an average of 9 681 unigenes were obtained from each D. salina_YC sample in this study, which is greater than the individual gene number of D. salina CCAP 19/30 reported above (9 256 genes). However, the average length (856 bp) of contigs in D. salina_YC with a 1 323-bp N50 was less than that in D. salina strain 435 (an average contig length of 1 409 bp, N50: 1 727 bp) (Hong et al., 2017). In summary, BGISEQ-500 is an effective next-generation highthroughput sequencing platform. The transcriptome sequencing results of D. salina_YC generated with this platform are high-confidence.
The TLC of D. salina cells may be related to the activities of enzymes that catalyze fatty acid biosynthesis or degradation (Afify et al., 2010). However, this correlation changes due to the corresponding genes that are differentially expressed in this alga under different salinity conditions. The present study showed that the TLC of D. salina_YC progressively increased with global high DEGs expression levels (FPKM mean ratio of 8.27 relative to the control) when the salinity was 0.51–1.03 mol/L (Fig. 7a). In this salinity range, 3 validated genes (lacs, dgat, and acat1) encoding the enzymes that catalyze fatty acid biosynthesis (Figs. 5a & 6a; Table 4) were upregulated with positive changes in FPKM and qPCR values (Fig. 11a & b). However, another validated gene, nadb, regulated fatty acid degradation and was downregulated with negative changes measured by FPKM. When the salinity reached 3.42 mol/L, the TLC of D. salina_YC was markedly increased (a maximum value of 5.4231E-05 mg/cell) (Fig. 10a), with most of the DEGs downregulated (FPKM mean ratio of 2.23 relative to the control) (Fig. 7a). At the moment, all 4 validated genes were repressed based on their negative changes via FPKM and qPCR changes analyses (Fig. 11a & b). We speculate that other lipid metabolic enzymes may induce fatty acid biosynthesis and inhibit its degradation processes. Hypersalinity stress may mediate enhancement of glycerol biosynthesis in this alga, which would accelerate fatty acid accumulation in algal cells to synthesize a large amount of lipids. Rismani-Yazdi et al. (2011) proposed a similar hypothesis in another halophilic alga, D. tertiolecta, using transcriptomic analysis.

|
| Fig.11 Relative change levels of total lipid content (TLC), PC, SOD specific activity (SSA), and beta-carotene content (BCC), and their corresponding validated DEGs in 3 D. salina_YC comparison groups relative to DS_CO measured by FPKM (b, c, f, g) and qPCR (a, d, e, h) DS_LS, DS_MS, and DS_HS represent the D. salina_YC experimental groups stressed with 0.51-, 1.03-, and 3.42-mol/L NaCl, respectively. DS_CO represents the D. salina_YC control group treated with 0.05-mol/L NaCl. |
Much fewer algal cells with scarce contents in the small intracellular space were observed in the D. salina_YC control group with 0.05-mol/L NaCl treatment (Table 1; Fig. 1a). The PC efficiency (Fv/Fm ranged from 0.70 to 0.57, and Fv/Fo ranged from 3.25 to 2.05) decreased slowly in the control group (very low salinity condition) compared with the higher salinity stress groups (Fig. 10b & c). Some studies showed that, with the salt-stress going on, photosynthesis or chlorophyll biosynthetic rates decreased in D. salina (Shetty et al., 2019; He et al., 2020), which indicates the consistent trend with PC in this alga. Relative to the control, the negative change in PC efficiency in the 3 comparison groups increased with increasing algal salinity (not greater than 3.42 mol/L) (Fig. 11c & d). Under low and medium salinity conditions, the global expression level of photosynthesis-related DEGs in D. salina_YC was high (FPKM mean ratio of 16.1 relative to the control) (Fig. 7b). The 4 validated genes (lhcbm5, cab-8, lhcb5, and lhcbm8) encoded light-harvesting proteins or chlorophyll a/b-binding proteins (Figs. 5b & 6b; Table 4), which are involved in algal PC reactions and are upregulated with positive changes measured by FPKM and qPCR as the salinity increased by no more than 3.41 mol/L (Fig. 11c & d). However, when the salinity reached 3.41 mol/L, the negative change in PC efficiency increased with the related DEGs overall downregulated (FPKM mean ratio of 6.89 relative to the control) (Fig. 7b). Meanwhile, the 4 validated genes above were markedly repressed (Fig. 11c & d) based on FPKM and qPCR changes analyses, which indicates that hypersalinity stress may inhibit gene expression involved in the absorption and transition of light in D. salina_YC photosynthesis. Zhou (2013) proposed a similar hypothesis in Zostera marina L. using qPCR analysis.
The SSA of Dunaliella should be a very important parameter for investigating the algal response to salt stress-induced ROS damage (Qv and Jiang, 2013). The SSA of D. salina_YC increased (maximum value of 0.022 U/mg) in 60 min with increased environmental salinity in this study (Supplementary Table S8d). The global expression level of ROS response-related DEGs in this alga was high (FPKM mean ratio of 8.87) under 3 different salinity stresses relative to the control (Fig. 7c). However, the three validated genes cpld35, fsd1, and prxq encoding oxidoreductase-like protein, Fe-SOD and peroxidase (or its precursor), respectively in this alga (Figs. 5c & 6c; Table 4), were downregulated with a salinity increase of no more than 1.03 mol/L and then upregulated with increasing salinity via RNA-seq and qPCR changes analyses (Fig. 11e & f). The 4 genes underwent D. salina_YC positive ROS response regulation when it suffered from hypersalinity stress (Fig. 11e & f). Panahi et al. (2019) obtained similar results in D. tertiolecta based on the ROS scavenging-related genes apx and shmt2. Moreover, the gene cpld35 was markedly upregulated in D. salina_YC with a salinity increase of more than 1.03 mol/L measured by FPKM and qPCR changes. We speculate that this gene, encoded an oxidoreductaselike protein that could play an essential role in the regulatory progress of ROS scavenging in this alga especially under extreme salinity stress condition.
Alkayal et al. (2010) determined that hypersalinity (greater than 2.5-mol/L NaCl) triggered the synthesis of many bioactive substances or metabolites in D. salina. The BCC of D. salina_YC increased with increasing salinity (average increment of 5.27 mg/cell relative to the control), especially 3.42-mol/L NaCl (Supplementary Table S8e), with enrichment of intracellular yellow-green pigments (Fig. 1). A similar situation was found in the D. salina Teod (Ramos et al., 2011). The common DEGs in the 3 D. salina_YC salt-stress comparison groups involved in the carotenoid biosynthesis were downregulated overall (FPKM mean ratio of 5.18 relative to the control) (Fig. 7d), with two validated genes, riba2 and crtr encoding the riboflavin biosynthesis protein (possible beta-carotene synthesis-related non-key factor) and beta-carotene hydroxylase (a key enzyme that catalyzes the conversion of beta-carotene to zeaxanthin), respectively (Figs. 5d & 6d; Table 4), were slightly downregulated when the salinity was 0.51–1.03 mol/L, and then slightly upregulated when the salinity continued to increase measured by FPKM and qPCR changes (Fig. 11g & h). This gene regulation pattern involved in carotenoid biosynthesis was also shown in another green alga, Chlorella sp., following salt stress treatment (Li et al., 2018). Moreover, the gene ggps encoding geranylgeranyl diphosphate synthase was continued downregulated with salinity increasing. Conversely, the upregulated expressed gene cartiso measured by FPKM encoding carotenoid isomerase with salinity increasing may play a positive regulatory role for BCC accumulation in D. salina_YC. A similar conclusion was reached for another green alga, C. zofingiensis (Mao et al., 2020).
Overall, low or medium salinity conditions may be a positive factor for rapid cellular proliferation, active substance accumulation and related genes expression in D. salina (Talebi et al., 2013). Very low salinity should be a basic factor for maintaining live algae. Although high salinity may be a negative factor for the growth of this alga, a few unique bioactive substances or high-value-added metabolites may be obtained from it. Finally, we would like to acknowledge the limitations of this study. Although some experimental methods have been utilized to explore the potential salt tolerance or response mechanisms in D. salina_YC, regulation at the posttranscriptional, translational and protein levels cannot be ignored. Gene knockout and overexpression technologies could be used for expression and functional validation of some key saltstress related genes in D. salina. From this point of view, it is necessary to further illustrate the detailed molecular mechanism underlying the response to salt stress in D. salina based on these candidate key genes, which will be helpful to our protection of Dunaliella community and the efficient utilization of unique species in the future.
5 CONCLUSIONThis study provided an overview of the different responses of D. salina_YC to 4 different NaCl concentrations at the transcriptomic level combined with the morphological, physiological, and biochemical levels. Fifteen common DEGs among the total unigenes of the four D. salina_YC experimental groups used for sequencing were significantly enriched and are possibly involved in enhancing lipid metabolism, decreasing photosynthesis, constantly increasing active oxygen metabolism and accumulating carotenoids. Differential expression and cloning of some genes at the molecular level will help uncover the mechanism underlying the response or tolerance of D. salina_YC to different salinity environments in Yuncheng Salt Lake.
6 DATA AVAILABILITY STATEMENTThe raw datasets of transcriptome in the study are available from the NCBI Short Read Archive (SRA) database with the accession numbers SRR12326540, SRR12326982, SRR12327191, SRR8393723, SRR8393722, SRR8393725, SRR8393724, SRR8393727, SRR8393726, SRR8393729, SRR8393728, and SRR8393721. The authors declare that all the other data supporting the findings of this study are available within the article and its supplementary files.
7 AUTHOR CONTRIBUTIONFan GAO performed the experiments, analyzed the data, and co-wrote the manuscript; Fangru NAN, Jia FENG, Junping LÜ, and Xudong LIU analyzed the data; Shulian XIE supervised the project and revised the manuscript. All authors have read and approved the final manuscript.
8 ETHICS APPROVAL AND CONSENT TO PARTICIPATEAll sampling procedures in this experiment were in accordance with the guidelines for the care and use of laboratory plants of Shanxi University and were approved by the Wildlife Care and Use Committee of Yuncheng Forestry Bureau, Shanxi Province, China.
Electronic supplementary material
Supplementary material (Supplementary Figs.S1–S8 and Tables S1–S8) is available in the online version of this article at https://doi.org/10.1007/s00343-021-0164-4.
Afify A E M M R, Shalaby E A, Shanab S M M. 2010. Enhancement of biodiesel production from different species of algae. Grasas y Aceites, 61(4): 416-422.
DOI:10.3989/gya.021610 |
Ahmed R A, He M L, Aftab R A, Zheng S Y, Nagi M, Bakri R, Wang C H. 2017. Bioenergy application of Dunaliella salina SA 134 grown at various salinity levels for lipid production. Scientific Reports, 7: 8118.
DOI:10.1038/s41598-017-07540-x |
Alkayal F, Albion R L, Tillett R L, Hathwaik L T, Lemos M S, Cushman J C. 2010. Expressed sequence tag (EST) profiling in hyper saline shocked Dunaliella salina reveals high expression of protein synthetic apparatus components. Plant Science, 179(5): 437-449.
DOI:10.1016/j.plantsci.2010.07.001 |
Azachi M, Sadka A, Fisher M, Goldshlag P, Gokhman I, Zamir A. 2002. Salt induction of fatty acid elongase and membrane lipid modifications in the extreme halotolerant alga Dunaliella salina. Plant Physiology, 129(3): 1320-1329.
DOI:10.1104/pp.001909 |
BenMoussa-Dahmen I, Chtourou H, Rezgui F, Sayadi S, Dhouib A. 2016. Salinity stress increases lipid, secondary metabolites and enzyme activity in Amphora subtropica and Dunaliella sp. for biodiesel production. Bioresource Technology, 218: 819-825.
DOI:10.1016/j.biortech.2016.07.022 |
Biasini M, Bienert S, Waterhouse A, Arnold K, Studer G, Schmidt T, Kiefer F, Cassarino T G, Bertoni M, Bordoli L, Schwede T. 2014. SWISS-MODEL: modelling protein tertiary and quaternary structure using evolutionary information. Nucleic Acids Research, 42(W1): W252-W258.
DOI:10.1093/nar/gku340 |
Chen X J, Wu M J, Jiang Y, Yang Y, Yan Y B. 2015. Dunaliella salina Hsp90 is halotolerant. International Journal of Biological Macromolecules, 75: 418-425.
DOI:10.1016/j.ijbiomac.2015.01.057 |
Chen Y X, Chen Y S, Shi C M, Huang Z B, Zhang Y, Li S K, Li Y, Ye J, Yu C, Li Z, Zhang X Q, Wang J, Yang H M, Fang L, Chen Q. 2018. SOAPnuke: a mapreduce acceleration-supported software for integrated quality control and preprocessing of high-throughput sequencing data. Gigascience, 7(1): gix120.
DOI:10.1093/gigascience/gix120 |
Cheng S F, Xian W F, Fu Y, Marin B, Keller J, Wu T, Sun W J, Li X L, Xu Y, Zhang Y, Wittek S, Reder T, Günther G, Gontcharov A, Wang S B, Li L Z, Liu X, Wang J, Yang H M, Xu X, Delaux P M, Melkonian B, Wong G K S, Melkonian M. 2019. Genomes of subaerial Zygnematophyceae provide insights into land plant evolution. Cell, 179(5): 1057-1067.
DOI:10.1016/j.cell.2019.10.019 |
Davidi L, Katz A, Pick U. 2012. Characterization of major lipid droplet proteins from Dunaliella. Planta, 236: 19-33.
DOI:10.1007/s00425-011-1585-7 |
Djebali S, Wucher V, Foissac S, Hitte C, Corre E, Derrien T. 2017. Bioinformatics pipeline for transcriptome sequencing analysis. Methods in Molecular Biology, 1468: 201-219.
DOI:10.1007/978-1-4939-4035-6_14 |
Emmerstorfer-Augustin A, Moser S, Pichler H. 2016. Screening for improved isoprenoid biosynthesis in microorganisms. Journal of Biotechnology, 235: 112-120.
DOI:10.1016/j.jbiotec.2016.03.051 |
Fazeli M R, Tofighi H, Samadi N, Jamalifar H. 2006. Effects of salinity on β-carotene production by Dunaliella tertiolecta DCCBC26 isolated from the Urmia salt lake, north of Iran. Bioresource Technology, 97(18): 2453-2456.
DOI:10.1016/j.biortech.2005.10.037 |
Fu X P, Wang D C, Yin X L, Du P C, Kan B. 2014. Time course transcriptome changes in Shewanella algae in response to salt stress. PLoS One, 9(5): e96001.
DOI:10.1371/journal.pone.0096001 |
Gasteiger E, Gattiker A, Hoogland C, Ivanyi I, Appel R D, Bairoch A. 2003. ExPASy: the proteomics server for indepth protein knowledge and analysis. Nucleic Acids Research, 31(13): 3784-3788.
DOI:10.1093/nar/gkg563 |
Gierahn T M, Wadsworth Ⅱ M H, Hughes T K, Bryson B D, Butler A, Satija R, Fortune S, Love J C, Shalek A K. 2017. Seq-well: portable, low-cost RNA sequencing of single cells at high throughput. Nature Methods, 14(4): 395-398.
DOI:10.1038/nmeth.4179 |
Gong F H, Wang J, Li J. 2017. Isolation and characterization of peroxiredoxin 1 gene of Dunaliella salina. Gene, 635: 39-45.
DOI:10.1016/j.gene.2017.09.018 |
Götz S, García-Gómez J M, Terol J, Williams T D, Nagaraj S H, Nueda M J, Robles M, Talón M, Dopazo J, Conesa A. 2008. High-throughput functional annotation and data mining with the Blast2GO suite. Nucleic Acids Research, 36(10): 3420-3435.
DOI:10.1093/nar/gkn176 |
Han C, Li Q, Li X F, Zhang Z P, Huang J R. 2018. De novo assembly, characterization and annotation for the transcriptome of Sphaeroma terebrans and microsatellite marker discovery. Genes & Genomics, 40(2): 167-176.
DOI:10.1007/s13258-017-0618-4 |
He Q H, Lin Y Q, Tan H, Zhou Y, Wen Y L, Gan J J, Li R W, Zhang Q L. 2020. Transcriptomic profiles of Dunaliella salina in response to hypersaline stress. BMC Genomics, 21(1): 115.
DOI:10.1186/s12864-020-6507-2 |
He Z H, Qin K J, Wang Y, Zhao W. 1993. Biological resources in inland saline waters from Southern Shanxi, China Part I. Lake Xiao Chi. Journal of Dalian Fisheries College, 8(4): 1-16.
(in Chinese with English abstract) DOI:10.16535/j.cnki.dlhyxb.1993.04.001 |
Hong L, Liu J L, Midoun S Z, Miller P C. 2017. Transcriptome sequencing and annotation of the halophytic microalga Dunaliella salina. Journal of Zhejiang University-Science B, 18(10): 833-844.
DOI:10.1631/jzus.B1700088 |
Hu L, Zheng T C, Cai M, Pan H T, Wang J, Zhang Q X. 2019. Transcriptome analysis during floral organ development provides insights into stamen petaloidy in Lagerstroemia speciosa. Plant Physiology and Biochemistry, 142: 510-518.
DOI:10.1016/j.plaphy.2019.08.012 |
Huang W C, Kim J D. 2017. Simultaneous cell disruption and lipid extraction in a microalgal biomass using a nonpolar tertiary amine. Bioresource Technology, 232: 142-145.
DOI:10.1016/j.biortech.2017.02.037 |
Im S, Lee H N, Jung H S, Yang S, Park E J, Hwang M S, Jeong W J, Choi D W. 2017. Transcriptome-based identification of the desiccation response genes in marine red algae Pyropia tenera (Rhodophyta) and enhancement of abiotic stress tolerance by PtDRG2 in Chlamydomonas. Marine Biotechnology, 19(3): 232-245.
DOI:10.1007/s10126-017-9744-x |
Jin J P, Tian F, Yang D C, Meng Y Q, Kong L, Luo J C, Gao G. 2017. PlantTFDB 4.0: toward a central hub for transcription factors and regulatory interactions in plants. Nucleic Acids Research, 45(D1): D1040-1045.
DOI:10.1093/nar/gkw982 |
Jin Y, Qian H, Yu M J. 2015. Phylogenetic structure of tree species across different life stages from seedlings to canopy trees in a subtropical evergreen broad-leaved forest. PLoS One, 10(6): e0131162.
DOI:10.1371/journal.pone.0131162 |
Kawase Y, Imamura S, Tanaka K. 2017. A MYB-type transcription factor, MYB2, represses light-harvesting protein genes in Cyanidioschyzon merolae. FEBS Letters, 591(16): 2439-2448.
DOI:10.1002/1873-3468.12763 |
Kumar L, Futschik M E. 2007. Mfuzz: a software package for soft clustering of microarray data. Bioinformation, 2(1): 5-7.
DOI:10.6026/97320630002005 |
Langdon W B. 2015. Performance of genetic programming optimised Bowtie2 on genome comparison and analytic testing (GCAT) benchmarks. Biodata Mining, 8: 1.
DOI:10.1186/s13040-014-0034-0 |
Lee J, Heath L S, Grene R, Li S. 2019. Comparing time series transcriptome data between plants using a network module finding algorithm. Plant Methods, 15: 61.
DOI:10.1186/s13007-019-0440-x |
Li J, Lu Y M, Xue L X, Xie H. 2010. A structurally novel saltregulated promoter of duplicated carbonic anhydrase gene 1 from Dunaliella salina. Molecular Biology Reports, 37(2): 1143-1154.
DOI:10.1007/s11033-009-9901-z |
Li X Y, Yuan Y Z, Cheng D J, Gao J, Kong L Z, Zhao Q Y, Wei W, Sun Y H. 2018. Exploring stress tolerance mechanism of evolved freshwater strain Chlorella sp. S30 under 30 g/L salt. Bioresource Technology, 250: 495-504.
DOI:10.1016/j.biortech.2017.11.072 |
Liang M H, Lu Y, Chen H H, Jiang J G. 2017. The saltregulated element in the promoter of lycopene β-cyclase gene confers a salt regulatory pattern in carotenogenesis of Dunaliella bardawil. Environmental Microbiology, 19(3): 982-989.
DOI:10.1111/1462-2920.13539 |
Liang X, Qiao D R, Huang M, Yi X L, Bai L H, Xu H, Wei L, Zeng J, Cao Y. 2008. Identification of a gene encoding the light-harvesting chlorophyll a/b proteins of photosystem I in green alga Dunaliella salina. DNA Sequence, 19(2): 137-145.
DOI:10.1080/10425170701447614 |
Mak S S T, Gopalakrishnan S, Carøe C, Geng C Y, Liu S L, Sinding M H S, Kuderna L F K, Zhang W W, Fu S J, Vieira F G, Germonpré M, Bocherens H, Fedorov S, Petersen B, Sicheritz-Pontén T, Marques-Bonet T, Zhang G J, Jiang H, Gilbert M T P. 2017. Comparative performance of the BGISEQ-500 vs Illumina HiSeq2500 sequencing platforms for palaeogenomic sequencing. Gigascience, 6(8): gix049.
DOI:10.1093/gigascience/gix049 |
Mansfeldt C B, Richter L V, Ahner B A, Cochlan W P, Richardson R E. 2016. Use of De novo transcriptome libraries to characterize a novel oleaginous marine Chlorella species during the accumulation of triacylglycerols. PLoS One, 11(2): e0147527.
DOI:10.1371/journal.pone.0147527 |
Mao X M, Zhang Y, Wang X F, Liu J. 2020. Novel insights into salinity-induced lipogenesis and carotenogenesis in the oleaginous astaxanthin-producing alga Chromochloris zofingiensis: a multi-omics study. Biotechnology for Biofuels, 13: 73.
DOI:10.1186/s13068-020-01714-y |
Maza E. 2016. In papyro comparison of TMM (edgeR), RLE (DESeq2), and MRN normalization methods for a simple two-conditions-without-replicates RNA-Seq experimental design. Frontiers in Genetics, 7: 164.
DOI:10.3389/fgene.2016.00164 |
Miura R, Araki A, Minatoya M, Miyake K, Chen M L, Kobayashi S, Miyashita C, Yamamoto J, Matsumura T, Ishizuka M, Kubota T, Kishi R. 2019. An epigenomewide analysis of cord blood DNA methylation reveals sex-specific effect of exposure to bisphenol A. Scientific Reports, 9: 12369.
DOI:10.1038/s41598-019-48916-5 |
Moriya Y, Itoh M, Okuda S, Yoshizawa A C, Kanehisa M. 2007. KAAS: an automatic genome annotation and pathway reconstruction server. Nucleic Acids Research, 35(S2): W182-W185.
DOI:10.1093/nar/gkm321 |
Panahi B, Frahadian M, Dums J T, Hejazi M A. 2019. Integration of cross species RNA-Seq meta-analysis and machine-learning models identifies the most important salt stress-responsive pathways in microalga Dunaliella. Frontiers in Genetics, 10: 752.
DOI:10.3389/fgene.2019.00752 |
Pertea G, Huang X Q, Liang F, Antonescu V, Sultana R, Karamycheva S, Lee Y, White J, Cheung F, Parvizi B, Tsai J, Quackenbush J. 2003. TIGR gene indices clustering tools (TGICL): a software system for fast clustering of large EST datasets. Bioinformatics, 19(5): 651-652.
DOI:10.1093/bioinformatics/btg034 |
Polle J E W, Barry K, Cushman J, Schmutz J, Tran D, Hathwaik L T, Yim W C, Jenkins J, McKie-Krisberg Z, Prochnik S, Lindquist E, Dockter R B, Adam C, Molina H, Bunkenborg J, Jin E, Buchheim M, Magnuson J. 2017. Draft nuclear genome sequence of the halophilic and beta-carotene-accumulating green alga Dunaliella salina strain CCAP19/18. Genome Announcements, 5(43): e01105-17.
DOI:10.1128/genomeA.01105-17 |
Puente-Sánchez F, Olsson S, Aguilera A. 2016. Comparative transcriptomic analysis of the response of Dunaliella acidophila (Chlorophyta) to short-term cadmium and chronic natural metal-rich water exposures. Microbial Ecology, 72(3): 595-607.
DOI:10.1007/s00248-016-0824-7 |
Qv X Y, Jiang J G. 2013. Toxicity evaluation of two typical surfactants to Dunaliella bardawil, an environmentally tolerant alga. Environmental Toxicology and Chemistry, 32(2): 426-433.
DOI:10.1002/etc.2073 |
Ramos A A, Polle J, Tran D, Cushman J C, Jin E, Varela J C. 2011. The unicellular green alga Dunaliella salina Teod. as a model for abiotic stress tolerance: genetic advances and future perspectives. Algae, 26(1): 3-20.
DOI:10.4490/algae.2011.26.1.003 |
Rismani-Yazdi H, Haznedaroglu BZ, Bibby K, Peccia J. 2011. Transcriptome sequencing and annotation of the microalgae Dunaliella tertiolecta: pathway description and gene discovery for production of next-generation biofuels. BMC Genomics, 12: 148.
DOI:10.1186/1471-2164-12-148 |
Rodríguez-García A, Sola-Landa A, Barreiro C. 2017. RNASeq-Based comparative transcriptomics: RNA rreparation and bioinformatics. Methods in Molecular Biology, 1645: 59-72.
DOI:10.1007/978-1-4939-7183-1_5 |
Ruijter J M, Villalba A R, Hellemans J, Untergasser A, Van Den Hoff MJB. 2015. Removal of between-run variation in a multi-plate qPCR experiment. Biomolecular detection and quantification, 5: 10-14.
DOI:10.1016/j.bdq.2015.07.001 |
Seddigh S, Darabi M. 2018. Functional, structural, and phylogenetic analysis of mitochondrial cytochrome b(cytb) in insects. Mitochondrial DNA Part A, 29(2): 236-249.
DOI:10.1080/24701394.2016.1275596 |
Seppey M, Manni M, Zdobnov E M. 2019. BUSCO: assessing genome assembly and annotation completeness. Methods in Molecular Biology, 1962: 227-245.
DOI:10.1007/978-1-4939-9173-0_14 |
Shetty P, Gitau M M, Maróti G. 2019. Salinity stress responses and adaptation mechanisms in eukaryotic green microalgae. Cells, 8(12): 1657.
DOI:10.3390/cells8121657 |
Smith D R, Lee R W, Cushman J C, Magnuson J K, Tran D, Polle J E W. 2010. The Dunaliella salina organelle genomes: large sequences, inflated with intronic and intergenic DNA. BMC Plant Biology, 10: 83.
DOI:10.1186/1471-2229-10-83 |
Solovchenko A E, Selivanova E A, Chekanov K A, Sidorov R A, Nemtseva N V, Lobakova E S. 2015. Induction of secondary carotenogenesis in new halophile microalgae from the genus Dunaliella (Chlorophyceae). Biochemistry(Moscow), 80(11): 1508-1513.
DOI:10.1134/S0006297915110139 |
Song J Y, Yao H, Li Y, Li X W, Lin Y L, Liu C, Han J P, Xie C X, Chen S L. 2009. Authentication of the family polygonaceae in Chinese pharmacopoeia by DNA barcoding technique. Journal of Ethnopharmacology, 124(3): 434-439.
DOI:10.1016/j.jep.2009.05.042 |
Talebi A F, Tabatabaei M, Mohtashami S K, Tohidfar M, Moradi F. 2013. Comparative salt stress study on intracellular ion concentration in marine and salt-adapted freshwater strains of microalgae. Notulae Scientia Biologicae, 5(3): 309-315.
DOI:10.15835/nsb539114 |
Tian Y Y, Bai S, Dang Z H, Hao J F, Zhang J, Hasi A. 2019. Genome-wide identification and characterization of long non-coding RNAs involved in fruit ripening and the climacteric in Cucumis melo. BMC Plant Biology, 19: 369.
DOI:10.1186/s12870-019-1942-4 |
Van De Poel B, Cooper E D, Van Der Straeten D, Chang C, Delwiche C F. 2016. Transcriptome profiling of the green alga Spirogyra pratensis (Charophyta) suggests an ancestral role for ethylene in cell wall metabolism, photosynthesis, and abiotic stress responses. Plant Physiology, 172(1): 533-545.
DOI:10.1104/pp.16.00299 |
Vasilikiotis C, Melis A. 1994. Photosystem Ⅱ reaction center damage and repair cycle: chloroplast acclimation strategy to irradiance stress. Proceedings of the National Academy of Sciences of the United States of America, 91(15): 7222-7226.
DOI:10.1073/pnas.91.15.7222 |
Wang F P, Feng J, Wang J, Li B, Xie S L. 2014. Phylogenetic and morphological investigation of a Dunaliella strain isolated from Yuncheng Salt Lake, China. Acta Geologica Sinica (English Edition), 88(Supp. l): 106-107.
DOI:10.11648/j.plant.20140202.12 |
Wang M X, Zhang Y X, Guo P Y. 2017. Effect of florfenicol and thiamphenicol exposure on the photosynthesis and antioxidant system of Microcystis flos-aquae. Aquatic Toxicology, 186: 67-76.
DOI:10.1016/j.aquatox.2017.02.022 |
Wang P, Wang Z N, Dou Y C, Zhang X X, Wang M Y, Tian X M. 2013. Genome-wide identification and analysis of membrane-bound O-acyltransferase (MBOAT) gene family in plants. Planta, 238(5): 907-922.
DOI:10.1007/s00425-013-1939-4 |
Wang Y, Cong Y T, Wang Y H, Guo Z H, Yue J R, Xing Z Y, Gao X N, Chai X J. 2019. Identification of early salinity stress-responsive proteins in Dunaliella salina by isobaric tags for relative and absolute quantitation (iTRAQ)-based quantitative proteomic analysis. International Journal of Molecular Sciences, 20(3): 599.
DOI:10.3390/ijms20030599 |
Wei S J, Bian Y Y, Zhao Q, Chen S X, Mao J W, Song C X, Cheng K, Xiao Z, Zhang C F, Ma W M, Zou H F, Ye M L, Dai S J. 2017. Salinity-induced palmella formation mechanism in halotolerant algae Dunaliella salina revealed by quantitative proteomics and phosphoproteomics. Frontiers in Plant Science, 8: 810.
DOI:10.3389/fpls.2017.00810 |
Wheeler D L, Church D M, Edgar R, Federhen S, Helmberg W, Madden T L, Pontius J U, Schuler G D, Schriml L M, Sequeira E, Suzek T O, Tatusova T A, Wagner L. 2004. Database resources of the National Center for Biotechnology Information: update. Nucleic Acids Research, 32(S1): D35-D40.
DOI:10.1093/nar/gkh073 |
Wichuk K, Brynjólfsson S, Fu W Q. 2014. Biotechnological production of value-added carotenoids from microalgae: emerging technology and prospects. Bioengineered, 5(3): 204-208.
DOI:10.4161/bioe.28720 |
Wu Q, Lan Y H, Cao X Y, Yao H Y, Qiao D R, Xu H, Cao Y. 2019. Characterization and diverse evolution patterns of glycerol-3-phosphate dehydrogenase family genes in Dunaliella salina. Gene, 710: 161-169.
DOI:10.1016/j.gene.2019.05.056 |
Wu X L, Xiong E H, Wang W, Scali M, Cresti M. 2014. Universal sample preparation method integrating trichloroacetic acid/acetone precipitation with phenol extraction for crop proteomic analysis. Nature Protocols, 9(2): 362-374.
DOI:10.1038/nprot.2014.022 |
Xie S L, Li Y H, Li Z. 1998. The species composition and distribution of Euglenophyta in salt lakes area in Yuncheng. Acta Hydrobiologica Sinica, 22(1): 33-38.
(in Chinese with English abstract) |
Yao L N, Tan K W M, Tan T W, Lee Y K. 2017. Exploring the transcriptome of non-model oleaginous microalga Dunaliella tertiolecta through high-throughput sequencing and high performance computing. BMC Bioinformatics, 18: 122.
DOI:10.1186/s12859-017-1551-x |
Yao L N, Tan T W, Ng Y K, Ban K H K, Shen H, Lin H X, Lee Y K. 2015. RNA-Seq transcriptomic analysis with Bag2D software identifies key pathways enhancing lipid yield in a high lipid-producing mutant of the non-model green alga Dunaliella tertiolecta. Biotechnology for Biofuels, 8: 191.
DOI:10.1186/s13068-015-0382-0 |
Yuan P P, Yin S, Han D, Zhang W J, Cui H L. 2015. Halorientalis brevis sp. nov., isolated from an inland salt lake of China. Current Microbiology, 71(3): 382-386.
DOI:10.1007/s00284-015-0861-3 |
Zhang S, Li X R, Xu H, Cao Y, Ma S H, Cao Y, Qiao D R. 2014. Molecular cloning and functional characterization of MnSOD from Dunaliella salina. Journal of Basic Microbiology, 54(5): 438-447.
DOI:10.1002/jobm.201200483 |
Zhou L Q, Liu Z H, Dong Y H, Sun X J, Wu B, Yu T, Zheng Y X, Yang A G, Zhao Q, Zhao D. 2019. Transcriptomics analysis revealing candidate genes and networks for sex differentiation of yesso scallop (Patinopecten yessoensis). BMC Genomics, 20: 671.
DOI:10.1186/s12864-019-6021-6 |
Zhou Y. 2013. The Expression Analylsis of Genes Encoding Light-Harvesting Chlorophyll a/b-Binding Proteins in Zostera marina L. in Differernt Environment. Ocean University of China, Qingdao.
|