 2021, Vol. 39
Institute of Oceanology, Chinese Academy of Sciences
Article Information
- DU Ping, JIANG Zhibing, ZHU Yuanli, LIAO Yibo, CHEN Quanzhen, ZENG Jiangning, SHOU Lu
- Seasonal and regional differences in long-term changes in large mesozooplankton (> 505 μm) biomass and abundance in a semi-enclosed subtropical bay
- Journal of Oceanology and Limnology, 39(6): 2281-2294
- http://dx.doi.org/10.1007/s00343-021-0347-z
Article History
- Received Sep. 19, 2020
- accepted in principle Oct. 16, 2020
- accepted for publication Dec. 25, 2020


2 Laboratory for Marine Fisheries Science and Food Production Processes, Pilot National Laboratory for Marine Science and Technology (Qingdao), Qingdao 266237, China;
3 Key Laboratory of Ocean Space Resource Management Technology, MNR, Hangzhou 310012, China
Zooplankton plays a pivotal role in marine food webs by transferring carbon fixed by phytoplankton and microzooplankton to higher trophic levels (Hughes, 2000). Variations in zooplankton are mainly related to hydro-environmental changes; moreover, zooplankton responses can amplify subtle environmental variations that are difficult to detect through the assessment of single physical variables (Fernández-Urruzola et al., 2014). Understanding the relationship between the environment and the zooplankton community, based on long-term observations, is essential to precisely grasp the influence of environmental changes on marine ecosystems.
Long-term studies in many areas have shown that global zooplankton are undergoing different changes (Uye, 1994; Kideys et al., 2000; Piontkovski and Castellani, 2009; Glibert, 2010; García-Comas et al., 2011; Steinberg et al., 2012; Valencia et al., 2016; Wang et al., 2016a). The major environmental changes in subtropical bay systems include anthropogenic increases in nutrient inputs and temperature. However, the responses of zooplankton communities have differed owing to differences in plankton composition. In Tokyo Bay during the 1980s, for example, larger copepods that dominanted in the 1950s were replaced by small copepods (Oithona nana), and the abundances of Scyphomedusae and Ctenophora increased (Uye, 1994). In the Sacramento-San Joaquin River Delta, the dominant copepod species changed from Eurytemora affinis to Limnoithona tetraspina (Glibert, 2010). In the neritic northwestern Black Sea, gelatinous zooplankton (Noctiluca scintillans and ctenophores) increased considerably, accompanied by decreases in the abundances of crustacean and fodder zooplankton (Kideys et al., 2000). In the San Francisco estuary, the abundance ratio of copepods to cladocerans changed (Lehman et al., 2010). In the Changjiang (Yangtze) River estuary, an increase in zooplankton biomass and abundance and a shift in zooplankton community structure have occurred over the past 30 years (Wang et al., 2016a).
Xiangshan Bay (XSB) is a typical anthropogenically affected system suffering from increased eutrophication and warming. XSB was once excellent for fish spawning and breeding because of its abundant nutrients, rich food organisms, and relatively stable environment (Wang et al., 2017). However, over the last three decades, XSB has been affected by large-scale human activities, such as the expansion of aquaculture (especially fish cages) and coastal industries since the 1990s, as well as the operation of power plants since 2005 (Du et al., 2017). Human activities aggravated the eutrophication and warming to different degrees (Ye et al., 2017b; Jiang et al., 2019a). Over the past 35 years, primary productivity and phytoplankton biomass have increased, especially the proportion of micro-chlorophyll a (Chl a) (20– 200 μm) (Jiang et al., 2019a). Conversely, the abundance and biomass of large mesozooplankton (LMZ; > 505 μm) have decreased (Du, 2018; Supplementary Fig.S1a), although changes in the LMZ dominant species have not been obvious throughout the bay (Luo et al., 2018). Meanwhile, fishery resources, including fish, crabs, shrimp, and cephalopods, have decreased sharply (Editorial Committee of the Bay Chorography in China (ECBCC), 1992; Tang et al., 2012; Supplementary Fig.S1b).
Significant spatiotemporal heterogeneity is a distinct characteristic of subtropical bays. To better manage and restore these areas, it is critical to identify the spatiotemporal heterogeneity in ecosystem changes and key drivers in different areas. XSB is a long and narrow semi-enclosed bay with significant spatial and seasonal heterogeneity in terms of environmental parameters and the plankton community (Du et al., 2015, 2019; Jiang et al., 2019b). The bay has traditionally been divided into three regions: the BI (inner bay), BM (middle bay), and BO (outer bay) (Ye et al., 2017a; Fig. 1). The water in the BI is mainly affected by runoff near the bottom of the bay, while the water in the BO is greatly affected by the water mass originating from the East China Sea (ECBCC, 1992). The salinity from BI to BO ranges from 17 to 27 (Du et al., 2020). Four distinct seasons (spring, summer, autumn, and winter) occur throughout the year in XSB. The water temperature from winter to summer ranges from 9.0 to 28.7 ℃ (Du et al., 2020). The BO of XSB is subject to the southward-flowing, turbid, inshore Changjiang Diluted Water during the cold/dry season (spring and winter) and the northward-flowing, relatively clear, offshore Taiwan Warm Current during the warm/wet season (summer and autumn) (ECBCC, 1992). According to existing records, algal blooms in XSB occur mainly during the cold season and in the inner section (Jiang et al., 2019b). Although XSB adjoins the Changjiang River estuary (Fig. 1), LMZ abundance and biomass in XSB were found to decrease, in contrast to the trend in zooplankton changes near the Changjiang River estuary (Wang et al., 2016a). Therefore, we hypothesize that regional and seasonal differences exist in the historical changes of LMZ abundance and biomass in XSB.

|
| Fig.1 Map of Xiangshan Bay, China, and the partition diagram BI: inner bay; BM: middle bay; BO: outer bay; power plant 1: Ninghai Power Plant; power plant 2: Wushashan Power Plant; CDW (blue arrow): Changjiang Diluted Water; TWC (red arrow): Taiwan Warm Current. |
In this study, we aimed to examine whether there are regional and seasonal differences in the long-term changes in LMZ abundance and biomass in XSB, and determine whether changes in LMZ are associated with increases in nutrients and temperature. This study provides a research idea and results to support regionally and seasonally differentiated management and ecological restoration in long and narrow semi-enclosed subtropical bays. Meanwhile, these findings will be valuable for studies on pelagic ecosystem changes in regions synchronously affected by warming and eutrophication.
2 MATERIAL AND METHOD 2.1 Study areaXSB is a long and narrow bay (approximately 60-km long and 3–8-km wide) in China (29.40°N– 29.75°N, 121.40°E–122.05°E) (Fig. 1). The bay covers a tidal flat area of 198 km2 and a water area of 365 km2, and the water depths range from 5 to 20 m. The bay was traditionally divided into three regions based on topography, hydrological features, and human activities (Ye et al., 2017a; Fig. 1). Ninety percent of the water exchange takes approximately 80, 60, and 15 days in the inner (BI), middle (BM), and outer (BO) sections, respectively (Dong and Su, 1999) (Fig. 1). Accordingly, the BO is affected by the water mass originating from the highly saline East China Sea, while the BI is more affected by freshwater inputs. The salinity from BI to BO ranges from 17 to 27 (Du et al., 2020). Freshwater inputs from 95 rivers around the bay, most of which are in the BI and BM, result in low salinity along the inner regions of the bay (ECBCC, 1992). Additionally, XSB is surrounded by dense population areas, and human activities (coastal power plants, aquaculture, and terrestrial inputs) are mostly concentrated in the BI and BM (Nobre et al., 2010). Combined with the influence of poor seawater exchange, pollutants easily accumulate in the BI and BM (Fan and Jin, 1989; Ye et al., 2017a). The Ninghai (4×600 MW+2×1 000 MW) and Wushashan (4×600 MW) Power Plants are located in the BI and BM, respectively, with large thermal discharge volumes of 87.5 and 53 m3/s, respectively. The areas that experience a 1 ℃ increase around the Ninghai and Wushashan Power Plants can approach 20 and 60 km2, respectively (Huang and Ye, 2014). Additionally, strong wind- and tide-induced vertical mixing and sediment resuspension result in increased turbidity in the BO, while high clarity and water column stability are observed in the BI. Under the influence of the East Asian monsoon, there are four distinct seasons in XSB. The average water temperatures are approximately 15, 27, 20, and 10 ℃ in the spring, summer, autumn, and winter, respectively. During the cold season (spring and winter), the southward monsoon brings turbid Changjiang Diluted Water to the BO, whereas during the warm season (summer and autumn), the northward monsoon brings the Taiwan Warm Current that is relatively warmer and clearer to the BO (Gao et al., 1990). Furthermore, precipitation is significantly higher from June to September than during other months, resulting in decreased salinity in the warm season (Jiang et al., 2019b). Thus, there are spatial and seasonal gradients and variations in temperature, salinity, nutrients, and turbidity, which result from the combined influence of topography, hydrological features, human activities, and monsoons.
2.2 Data sourceThe China National Oceanic Census began in 1959, while environmental surveys in gulfs began in the early 1980s. Mesozooplankton are zooplankton ranging in size from 200 to 20 000 μm. All early zooplankton samples in China were collected using a plankton net with a mesh size of 505 μm, in accordance with the Marine Investigation Criterion, and have been designated "large mesozooplankton (LMZ)". Therefore, in this study, we analyzed the long-term changes in the abundance and biomass of these LMZ, which range in size from 505 to 20 000 μm.
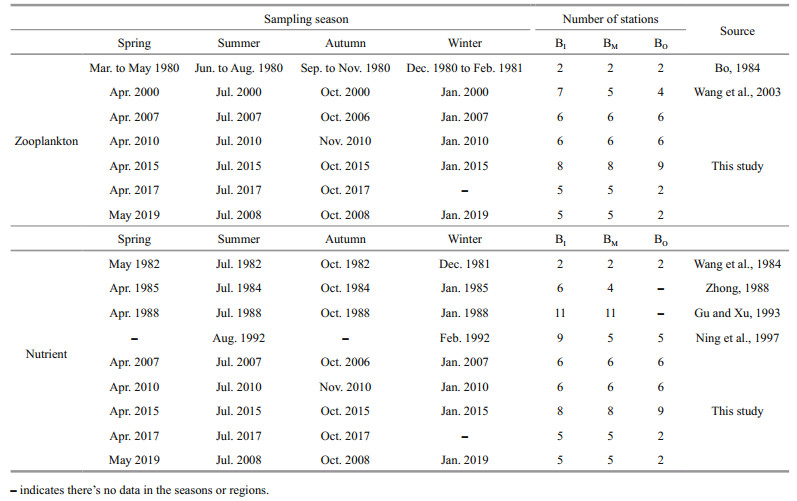
The zooplankton and nutrient data in this study were derived from the literatures and our own studies (Table 1). Samples were collected monthly in 1980/1981 and quarterly in other years; thus, in 1980/1981, the seasonal biomass and abundance values are three-month averages, whereas in other years, the values are those from the quarterly surveys. The historical data for each sampling region contained a certain number of stations (Table 1). The zooplankton data generated from the 2000 to 2019 samples were all collected and analyzed by the Second Institute of Oceanography, Ministry of Natural Resources (SIO, MNR), China. Zooplankton samples were collected using a plankton net (diameter: 80 cm, mesh size: 505 μm, length: 140 cm) via vertical tows from 2 m above the bottom depth to the surface. All samples collected were stored in 5% formalin in 1-L plastic bottles. The volume of filtered water was measured using a digital flow meter. In the laboratory, mesozooplankton samples were filtered through a silk sieve with a mesh size of 160 mm and then weighed with a 0.1-mg electronic balance after picking out of sundries. Taxonomic identification and enumeration was carried out using a stereoscope (Zeiss SteREO Discovery.V8) and a microscope (Leica DM2500). Adult mesozooplankton, crustacean larvae, and other larvae were identified to the species, family, and class levels, respectively. Zooplankton biomass was determined as the ratio of the wet weight of zooplankton to the filtered water volume, and zooplankton abundance was the ratio of the number of individuals to the filtered water volume. The nutrient data generated from the 2006 to 2019 samples were collected and analyzed by SIO, MNR. The nutrients included dissolved inorganic nitrogen (DIN=nitrate (NO3-N)+nitrite (NO2-N)+ammonium (NH4-N)) and dissolved inorganic phosphate (DIP=phosphate (PO4-P)) concentrations, which showed clear historical changes. To analyze NO3-N, NO2-N, NH4-N, and PO4-P, 1-L water samples were filtered through 0.45-μm pore size mixed cellulose ester filters, and the nutrients were measured using colorimetric methods according to GB 17378.4-1998/2007.
Although these historical data were not collected from the same stations or at the same time, they covered specific regions and seasons. Therefore, the error between past and present data collected from different stations is likely minimal. Furthermore, to reduce the error caused by monthly differences, the most zooplankton data representing winter, spring, summer, and autumn were collected in January, April, July, and October, respectively (only the samples from autumn 2010 and spring 2019 were collected in mid-November and mid-May, respectively).
To determine the warming trend in XSB, and considering that power plants began operating in 2005, the monthly mean sea surface temperature (SST) from 2003 to 2017 was derived from the Moderate-resolution Imaging Spectroradiometer (MODIS) Aqua Level 3 Product-Monthly SST4 (4-μ nighttime measurements with 4-km resolution; https://oceancolor.gsfc.nasa.gov/l3/).
2.3 Data analysisThe Mann-Kendall test in the "Kendall" package in R v.3.5.1 software (The R Development Core Team, 2020) was used to detect monotonic increases in zooplankton abundance and biomass, as well as DIN and DIP concentrations and SST. Sen's non-parametric method was used to estimate the true slope of an existing trend (Salmi et al., 2002). Changes were considered significant at P < 0.05. Test S was exported to indicate monotonic trend when the number of years n≤10, while Test Z was exported to indicate monotonic trend when n > 10.
3 RESULT 3.1 Regional and seasonal differences in zooplankton changesWe found regional and seasonal differences in the variation trends of LMZ abundance and biomass (Figs. 2–3; Table 2). Trends of decreasing abundance and biomass were observed in most of the seasons and regions, while increasing abundance and biomass trends were observed in BO during spring. The rapid decline in abundance and biomass occurred after 2005.

|
| Fig.2 Historical changes in large mesozooplankton abundance in different seasons and regions The dotted line indicates no data between the two years. BI: inner bay, BM: middle bay; BO: outer bay. |

|
| Fig.3 Historical changes in large mesozooplankton biomass in different seasons and regions The dotted line indicates no data between the two years. BI: inner bay, BM: middle bay; BO: outer bay. |

|
Sharp abundance declines were observed in winter and autumn. The approximately 7-fold decline in the BI during autumn (from 204 ind./m3 in the 1980s to 28 ind./m3 in 2018), 14-fold decline in the BI during winter (from 170 ind./m3 in the 1980s to 12 ind./m3 in 2019) and 7-fold decline in the BM during winter (from 75 ind./m3 in the 1980s to 11 ind./m3 in 2019) were significant (P < 0.05) (Fig. 2; Table 2).
Sharp biomass declines were observed in the warm season (summer and autumn). The biomass-declining trend was increasingly clear from the BO to BI during summer, whereas the increasing trend was increasingly clear from the BI to BO during spring. The approximately 10-fold decline in the BI during summer (from 187 mg/m3 in the 1980s to 16 mg/m3 in 2018), 5-fold decline in the BM during autumn (from 48 mg/m3 in the 1980s to 10 mg/m3 in 2018) and 2-fold increase in the BO during spring (from 148 mg/m3 in the 1980s to 278 mg/m3 in 2019) were significant (P < 0.05) (Fig. 3; Table 2).
The seasonal changes in LMZ abundance and biomass were as follows. In spring, both the biomass and abundance in the BO increased, and biomass increased significantly (Figs. 2–3; Table 2). Calanus sinicus was the dominant species in the BO, and its relative abundance remained at almost 40% to 50% in the 1980s and 2019. In summer, the biomasses of LMZ in the BI and BM declined greatly (Fig. 3; Table 2), while the abundances declined slightly or increased (Fig. 2; Table 2), which indicates that the mean individual biomass (ratio of biomass to abundance, B/A) declined. The changes in dominant species during summer were not obvious, and the dominant species in the BI were still Acartia pacifica and Brachyura larvae. However, the relative abundance of A. pacifica declined from approximately 50% in the 1980s to 15% in 2017 and 2019, whereas that of Brachyura larvae increased from 30% to 40%. Meanwhile, the relative abundance of Oithona nana (a small copepod) reached 10% in 2017. In autumn, both the biomasses and abundances of LMZ in the three regions of XSB declined greatly. In winter, the decreasing trend of abundance was more obvious than that of biomass, due to the higher biomass in 2006, which was caused by the presence of some species (Diastylis tricincta, Amphipoda spp., C. sinicus) with individuals larger than Centropages dorsispinatus.
3.2 Regional and seasonal differences in changes in nutrients and temperatureThe average annual concentrations of DIN and DIP increased in almost all seasons and regions from 1981/1982 to 2019, by approximately three times for DIN and more than two times for DIP. The increases in DIN and DIP both began in the late 1980s or early 1990s. The increases in the BI and BM were greater than those in the BO in each season. Significant increases in DIN were observed in the BI and BM during summer and in the BI during winter (P < 0.05). No significant increases in DIP were observed (P > 0.05) (Figs. 4–5; Table 2).

|
| Fig.4 Historical changes in dissolved inorganic nitrogen (DIN) concentrations in different seasons and regions The dotted line indicates no data between the two years. BI: inner bay, BM: middle bay; BO: outer bay. |

|
| Fig.5 Historical changes in dissolved inorganic phosphate (DIP) concentrations in different seasons and regions The dotted line indicates no data between the two years. BI: inner bay, BM: middle bay; BO: outer bay. |
For the years 2003 to 2017, significant increases in SST were detected in the BI, BM, and BO during winter, by 2.27, 2.68, and 1.60 ℃, respectively, and at rates of 1.52, 1.79, and 1.07 ℃/decade, respectively. Significant increases were also found in the BI during summer, by 0.33 ℃ at a rate of 0.22 ℃/decade, and in the BM during autumn, by 0.68 ℃ at a rate of 0.45 ℃/decade, according to the Mann-Kendall test and Sen's slope estimation (Supplementary Fig.S2). Moreover, SST in the BM increased during all four seasons. The SST in the BO increased during the cold season but did not change during the warm season. SST in the BI decreased slightly in the spring and autumn.
3.3 Coupled changes in zooplankton and environmental factorsDuring the warm season, the LMZ biomass declined significantly in the regions where the temperature increased significantly, while the nutrient concentration (especially DIN) also increased greatly in these regions, namely, in the BI during summer and in the BM during autumn (Figs. 2–5; Table 2). During winter, significant declining trends in LMZ abundance were observed in the region where the DIN concentration and temperature increased significantly simultaneously.
4 DISCUSSIONIn accordance with our hypothesis, our study results indicate that regional and seasonal differences exist in the historical changes of LMZ (> 505 μm) abundance and biomass in XSB. The regions with declining LMZ biomass trends during the warm season were accompanied by simultaneous increases in nutrients and temperature. The increases in LMZ abundance and biomass in the BO during spring appeared to be affected by water from the Changjiang River estuary outside the bay.
4.1 Simultaneous increases in nutrient concentration and temperature depressed LMZ biomass in the BI and BM during the warm seasonsIn the context of global warming, increases in temperature and eutrophication are widespread in many bays and along coasts during periods of rapid economic development; however, the responses of pelagic ecosystems are not exactly the same (Ning et al., 2010; Kimmel et al., 2012; Jiang et al., 2014; Wang et al., 2016a). Eutrophication and warming generally enhance phytoplankton biomass, with increases in the proportions of either small-cell species (Uye, 1994; Glibert, 2010; Hao et al., 2016) or large-cell species (Jiang et al., 2019a) in different areas because of latitudinal differences, as well as changes in the nutrient proportions and nitrogen forms among the sea areas. However, the responses of zooplankton and fish to eutrophication and increased phytoplankton are more complex and may be determined by trophic interactions in the middle of the food web (Micheli, 1999; Shurin et al., 2002; Stibor et al., 2004).
After examining several parameters in XSB that have been recorded since the early 1980s, we found that the increases in water temperature, and DIN, DIP, and Chl-a concentrations, and the decrease in total fisheries resources may co-vary with the decline in LMZ biomass (Supplementary Fig.S1). Nutrient concentrations started changing in the late 1980s or early 1990s (Figs. 4–5), coinciding with large-scale fish cage development in XSB. The increased phytoplankton biomass in XSB corresponded to the nutrient changes. Beginning in 2005, the thermal discharge by power plants in the BI and BM of XSB accelerated the warming trend because of the long water-residence time. The rapid decline in LMZ biomass that occurred after 2005 coincided with the time at which the power plants commenced operation. Therefore, the decline in LMZ biomass was likely related to the joint stress of increased temperature and nutrients.
In subtropical systems, increasing water temperature often promotes an increase in mesozooplankton (> 200 μm) abundance (Salvador and Bersano, 2017), but an inverse relationship generally exists between zooplankton body size and temperature (Daufresne et al., 2009). The high temperatures and eutrophic conditions promoted an increase in the abundance of small-bodied copepods, such as Oithona nana, Paracalanus parvus, and copepod nauplii, which are frequently observed in coastal ecosystems (Park and Marshall, 2000; Lam-Hoai et al., 2006; Salvador and Bersano, 2017). A recent study on mesozooplankton (> 200 μm) in XSB showed that the number of small mesozooplankton (200–505 μm; e.g., O. nana, Limnoithona tetraspina, Brachyura larvae, copepod nauplii) was higher in summer and in the BI under higher temperatures and nutrient concentrations (Du et al., 2020). In this study, the decreasing trends in the biomasses of LMZ (> 505 μm) were more obvious than the decreases in abundance in the BI during summer and in the BM during autumn (Figs. 2–3; Table 2), which indicates that the B/A may decline. At the same time, changes in the relative abundances of dominant species were observed in the BI during summer. The abundance of A. pacifica (a medium-sized copepod) declined in the summer, probably because of a temperature increase near the power plant outlet up to 33 ℃ that exceeded its thermal tolerance (Du et al., 2017). Instead, the relative abundances of Brachyura larvae and O. nana (a small-sized copepod) increased. Therefore, we propose that the decline in the biomass of LMZ in XSB during summer was mainly because of zooplankton miniaturization caused by increases in nutrients and, especially, temperature. We speculate that the decrease in LMZ abundance in the BI and BM during winter may be caused by the miniaturization of Centropages dorsispinatus, which remained the main dominant species in the 1980s and 2019. Unfortunately, there were no historical data on the abundance of small mesozooplankton (200–505 μm).
Given the trends of temperature, nutrients, Chl a, and fisheries resources in the time series (Figs. 2–5 and Supplementary Fig.S1), we propose the following scenario to explain the long-term changes in the pelagic ecosystem in the BI and BM of XSB since the 1980s (Fig. 6). Eutrophication and warming increased food resource availability (increased phytoplankton biomass) for zooplankton (Jiang et al., 2019a) but caused zooplankton to decrease in size. Eutrophic waters are often characterized by larger phytoplankton species, and anthropogenic nutrient enrichment increases cell size at mid-high latitudes (Cloern, 2018). Diatoms have always been dominant in XSB (relative abundance > 80%); furthermore, some large-celled dinoflagellate species, which were not dominant in 2000 or 2006/2007, have become dominant since 2015 (Jiang et al., 2019a). The zooplankton miniaturization caused the large phytoplankton to lose effective feeding control; therefore, the micro-Chl-a (20–200 μm) contribution increased sharply and formed chronic blooms, especially in the BI (Jiang et al., 2019a). The mismatch between the phytoplankton supply and food demand of zooplankton prevented the energy from transferring to higher trophic organisms; thus, the transition from a high-energy food chain to a low-energy one caused the fisheries resources to decline in combination with overfishing (ECBCC, 1992; Parsons and Lalli, 2002; Tang et al., 2012; Supplementary Fig.S1).

|
| Fig.6 Schematic diagram of changes in the pelagic ecosystem of Xiangshan Bay, China |
Under the influence of the East Asian monsoon, the BO of XSB is subjected to southward-flowing Changjiang Diluted Water during spring and winter (ECBCC, 1992; Zeng et al., 2017). Calanus sinicus is the dominant LMZ species in Changjiang Diluted Water during spring, as well as the most important dominant species in the BO of XSB during spring. The biomasses of LMZ near the Changjiang River estuary during spring in 1999, 2001, and 2011 (674.28, 542.18, and 415.6 mg/m3, respectively) were approximately two times higher than those in the late 1950s and 1980s (244.59 and 277.80 mg/m3) (Wang et al., 2004, 2016b), which is consistent with the trend of LMZ biomasses in the BO of XSB.
The increases in the total LMZ biomass in the spring of 1999 and 2001 were mainly caused by an increase in the number of the dominant species C. sinicus (Wang et al., 2004). A study on long-term zooplankton variations based on annual averages from 1982 to 2011 near the Changjiang River estuary found a slight, nonsignificant upward trend in zooplankton abundance and biomass (Wang et al., 2016a). However, the abundance of most crustacean zooplankton (Euphausiacea, Mysidacea, and Copepoda) decreased while gelatinous zooplankton (medusae and tunicates) and Polychaeta increased (Li et al., 2010; Wang et al., 2016a). Studies on the long-term variations in zooplankton in Tokyo Bay, the San Francisco Estuary, shallow regions of the northwestern Black Sea, and Chesapeake Bay, which suffered from eutrophication, all revealed that crustacean zooplankton and fodder zooplankton decreased in abundance and size (Uye, 1994; Kideys et al., 2000; Glibert, 2010; Kimmel et al., 2012); however, once carnivorous gelatinous zooplankton (medusae and ctenophores) increased or invaded, the total zooplankton biomass and abundance increased (Kideys et al., 2000). These changes are not beneficial for fishery resources (Parsons and Lalli, 2002).
In recent decades, the East China Sea shelf has experienced major environmental and ecological changes—including eutrophication, red tides, hypoxia, and warming—especially near the Changjiang River estuary (Li et al., 2010; Ning et al., 2011; Jiang et al., 2014; Kong et al., 2016). Medusae comprise the third largest group of zooplankton in the East China Sea (Xu, 2006). Medusa outbreaks have occurred in the northern East China Sea in successive years since the 1990s, especially after 2003 (Dong et al., 2010). High medusae abundance mostly occurred in the northern East China Sea outside the Changjiang Diluted Water during spring, while low abundance occurred in coastal waters, because the salinity ranges for most medusae species in the East China Sea are narrow, with the optimal salinity being 32–34 (Xu, 2009), while the salinity ranges in XSB were 17–27. In surveys conducted over the last 15 years, scyphozoans, cubozoans, and their larvae have not been found in XSB. Only some hydromedusae (Eirene sp., Ectopleura sp., Aglaura hemistoma, Liriope tetraphylla), siphonophores (Diphyes chamissonis, Muggiaea atlantica), ctenophores (Pleurobrachia globose), and Chaetognatha (Zonosagitta bedoti, Flaccisagitta enflata) often appeared in XSB, especially in the BO, from May to October, when the BO was mainly affected by the northward-flowing Taiwan Warm Current. Therefore, this bay is unlikely to be invaded by large medusae (scyphozoans or cubozoans) in the short term (Xu, 2009; Luo et al., 2012; Wang et al., 2012; Zuo et al., 2016).
5 CONCLUSIONWe found regional and seasonal differences in the historical changes in the abundance and biomass of LMZ in XSB. The sharp abundance declines in the BI and BM during winter and autumn resulted in a decline in the annual mean abundance of LMZ throughout the bay. The sharp biomass declines in the BI and BM during the warm season (summer and autumn) resulted in the decline in the annual mean biomass throughout the bay. The significant decline in LMZ biomass in the BI and BM during the warm season was coupled with simultaneous increases in nutrients and temperature. The mismatch between the phytoplankton supply and food demand of zooplankton prevented energy from being transferred to higher trophic levels. Thus the decline in the energy transfer efficiency of the food chain, combined with overfishing, likely resulted in the decrease in fisheries resources. The increase in the abundance and biomass of LMZ in the BO during spring appeared to be affected by the Changjiang River estuary water. Fortunately, XSB is unlikely to be invaded by large medusae. We recommend that the ecosystem management and ecological restoration in subtropical semi-enclosed bays be focused on internal waters, which have a poor water exchange capacity. Regrettably, it is difficult to determine a quantitative relationship between zooplankton and environmental factors because of the lack of synchronous time-series data, as well as the complex interactions in the ecosystem. In addition, zooplankton changes may also be caused by other, more important, unknown factors, because we measured only a few parameters. Thus, continuous plankton monitoring in XSB should be performed in the future. Meanwhile, the trophic transfer efficiency of food chains in subtropical bays, including microbial loops, warrants further study.
6 DATA AVAILABILITY STATEMENTAll data generated and/or analyzed during this study are included in this published article and its supplementary information files.
7 ACKNOWLEDGMENTWe are grateful to Xiaoya LIU, Jingjing ZHANG, and Xiangyu SUN in the SIO, MNR, China for their cooperation with the nutrient analysis. We are also grateful to the anonymous reviewers for improving the quality of the present manuscript.
Electronic supplementary material
Supplementary material (Supplementary Figs.S1–S2) is available in the online version of this article at https://doi.org/10.1007/s00343-021-0347-z.
Bo H P. 1984. Report on zooplankton survey in Xiangshan Bay. Marine Fisheries, 6(6): 249-253.
(in Chinese) |
Cloern J E. 2018. Why large cells dominate estuarine phytoplankton. Limnology and Oceanography, 63(S1): S392-S409.
DOI:10.1002/lno.10749 |
Daufresne M, Lengfellner K, Sommer U. 2009. Global warming benefits the small in aquatic ecosystems. Proceedings of the National Academy of Sciences of the United States of America, 106(31): 12788-12793.
DOI:10.1073/pnas.0902080106 |
Dong L X, Su J L. 1999. Numerical study of water exchange in Xiangshangang bay Ⅱ. model application and water exchange study. Oceanologia et Limnologia Sinica, 30(5): 465-470.
(in Chinese with English abstract) |
Dong Z J, Liu D Y, Keesing J K. 2010. Jellyfish blooms in China: dominant species, causes and consequences. Marine Pollution Bulletin, 60(7): 954-963.
DOI:10.1016/j.marpolbul.2010.04.022 |
Du P, Jiang Z B, Wang Y M, Qian P. 2019. Spatial heterogeneity of the planktonic protistan community in a semi-closed eutrophic bay, China. Journal of Plankton Research, 41(3): 223-239.
DOI:10.1093/plankt/fbz012 |
Du P, Jiang Z B, Zhu Y L, Tang Y B, Liao Y B, Chen Q Z, Zeng J N, Shou L. 2020. What factors control the variations in abundance, biomass, and size of mesozooplankton in a subtropical eutrophic bay?. Estuaries and Coasts, 43(8): 2128-2140.
DOI:10.1007/s12237-020-00747-8 |
Du P, Liao Y B, Jiang Z B, Wang K, Zeng J N, Shou L, Xu X Q, Xu X D, Liu J J, Huang W, Zhang D M. 2017. Responses of mesozooplankton communities to different anthropogenic activities in a subtropical semi-enclosed bay. Journal of the Marine Biological Association of the United Kingdom, 98(4): 1-14.
DOI:10.1017/S0025315416001995 |
Du P, Xu X Q, Liu J J, Jiang Z B, Chen Q Z, Zeng J N. 2015. Spatial heterogeneity of macro- and meso-zooplankton in Xiangshan Bay in spring and summer. Acta Ecologica Sinica, 35(7): 2308-2321.
(in Chinese with English abstract) DOI:10.5846/stxb201306091487 |
Du P. 2018. The Spatio-Temporal Variation and the Driving Factors of Mesozooplankton Community in Xiangshan Bay. Ningbo University, Ningbo. (in Chinese)
|
Edition Committee of the Bay Chorography in China (ECBCC). 1992. The Bay Chorography in China (5). China Ocean Press, Beijing, China. 166-233.
(in Chinese)
|
Fan A D, Jin X S. 1989. Tidal effect on nutrient exchange in Xiangshan Bay, China. Marine Chemistry, 27(3-4): 259-281.
DOI:10.1016/0304-4203(89)90051-0 |
Fernández-Urruzola I, Osma N, Packard T T, Gómez M, Postel L. 2014. Distribution of zooplankton biomass and potential metabolic activities across the northern Benguela upwelling system. Journal of Marine Systems, 140: 138-149.
DOI:10.1016/j.jmarsys.2014.05.009 |
Gao S, Xie C Q, Feng Y J. 1990. Fine-grained sediment transport and sorting by tidal exchange in Xiangshan Bay, Zhejiang, China. Estuarine, Coastal and Shelf Science, 31(4): 397-409.
DOI:10.1016/0272-7714(90)90034-O |
García-Comas C, Stemmann L, Ibanez F, Berline L, Mazzocchi M G, Gasparini S, Picheral M, Gorsky G. 2011. Zooplankton long-term changes in the NW Mediterranean Sea: decadal periodicity forced by winter hydrographic conditions related to large-scale atmospheric changes?. Journal of Marine Systems, 87(3-4): 216-226.
DOI:10.1016/j.jmarsys.2011.04.003 |
GB 17378.4-1998/2007. The Specification for Marine Monitoring Part 4: Seawater Analysis. Standards Press, Beijing, China. 1-162. (in Chinese)
|
Glibert P M. 2010. Long-term changes in nutrient loading and stoichiometry and their relationships with changes in the food web and dominant pelagic fish species in the San Francisco estuary, California. Reviews in Fisheries Science, 18(2): 211-232.
DOI:10.1080/10641262.2010.492059 |
Gu X G, Xu Z L. 1993. Study on the phytoplankton ecology and red tide of middle and western Xiangshan Bay. Marine Fisheries, 15(5): 199-204.
(in Chinese with English abstract) |
Hao Y J, Tang D L, Boicenco L, Wang S F. 2016. Environmental ecological response to increasing water temperature in the Daya Bay, Southern China in 1982-2012. Natural Resources, 7(4): 184-192.
DOI:10.4236/nr.2016.74017 |
Huang X Q, Ye S F. 2014. Monitoring and Impact Assessment of Temperature Increase Caused by Thermal Discharge from Power Plants in the Xiangshan Bay. China Ocean Press, Beijing. 1-5.
(in Chinese)
|
Hughes L. 2000. Biological consequences of global warming: is the signal already apparent?. Trends in Ecology & Evolution, 15(2): 56-61.
DOI:10.1016/S0169-5347(99)01764-4 |
Jiang Z B, Du P, Liu J J, Chen Y, Zhu Y L, Shou L, Zeng J N, Chen J F. 2019a. Phytoplankton biomass and size structure in Xiangshan Bay, China: current state and historical comparison under accelerated eutrophication and warming. Marine Pollution Bulletin, 142: 119-128.
DOI:10.1016/j.marpolbul.2019.03.013 |
Jiang Z B, Gao Y X, Chen Y, Du P, Zhu X Y, Liao Y B, Liu X Y, Zeng J N. 2019b. Spatial heterogeneity of phytoplankton community shaped by a combination of anthropogenic and natural forcings in a long narrow bay in the East China Sea. Estuarine, Coastal and Shelf Science, 217: 250-261.
DOI:10.1016/j.ecss.2018.11.028 |
Jiang Z B, Liu J J, Chen J F, Chen Q Z, Yan X J, Xuan J L, Zeng J N. 2014. Responses of summer phytoplankton community to drastic environmental changes in the Changjiang (Yangtze River) estuary during the past 50 years. Water Research, 54: 1-11.
DOI:10.1016/j.watres.2014.01.032 |
Kideys A E, Kovalev A V, Shulman G, Gordina A, Bingel F. 2000. A review of zooplankton investigations of the Black Sea over the last decade. Journal of Marine Systems, 24(3-4): 355-371.
DOI:10.1016/S0924-7963(99)00095-0 |
Kimmel D G, Boynton W R, Roman M R. 2012. Long-term decline in the calanoid copepod Acartia tonsa in central Chesapeake Bay, USA: an indirect effect of eutrophication?. Estuarine, Coastal and Shelf Science, 101: 76-85.
DOI:10.1016/j.ecss.2012.02.019 |
Kong F Z, Xu Z J, Yu R C, Yuan Y Q, Zhou M J. 2016. Distribution patterns of phytoplankton in the Changjiang River estuary and adjacent waters in spring 2009. Chinese Journal of Oceanology and Limnology, 34(5): 902-914.
DOI:10.1007/s00343-016-4202-6 |
Lam-Hoai T, Guiral D, Rougier C. 2006. Seasonal change of community structure and size spectra of zooplankton in the Kaw River estuary (French Guiana). Estuarine, Coastal and Shelf Science, 68(1-2): 47-61.
DOI:10.1016/j.ecss.2006.01.009 |
Lehman P W, Teh S J, Boyer G L, Nobriga M L, Bass E, Hogle C. 2010. Initial impacts of Microcystis aeruginosa blooms on the aquatic food web in the San Francisco Estuary. Hydrobiologia, 637: 229-248.
DOI:10.1007/s10750-009-9999-y |
Li Y, Li D J, Tang J L, Wang Y M, Liu Z G, He S Q. 2010. Long-term changes in the Changjiang Estuary plankton community related to anthropogenic eutrophication. Aquatic Ecosystem Health & Management, 13(1): 66-72.
DOI:10.1080/14634980903579942 |
Luo X F, Wei H, Wang Y H. 2012. Processes influencing jellyfish particle tracking in the Yellow Sea and East China Sea. Oceanologia et Limnologia Sinica, 43(3): 635-642.
(in Chinese with English abstract) DOI:10.11693/hyhz201203034034 |
Luo X, Zeng J N, Xu X Q, Du P. 2018. Distribution of zooplankton in the Xiangshan Bay and its changes during longer period. Marine Science Bulletin, 37(1): 74-87.
DOI:10.11840/j.issn.1001-6392.2018.01.010 |
Micheli F. 1999. Eutrophication, fisheries, and consumer-resource dynamics in marine pelagic ecosystems. Science, 285(5432): 1396-1398.
DOI:10.1126/science.285.5432.1396 |
Ning X R, Lin C L, Su J L, Liu C G, Hao Q, Le F F, Tang Q S. 2010. Long-term environmental changes and the responses of the ecosystems in the Bohai Sea during 1960-1996. Deep Sea Research Part Ⅱ: Topical Studies in Oceanography, 57(11-12): 1079-1091.
DOI:10.1016/j.dsr2.2010.02.010 |
Ning X R, Shi J X, Liu Z L, Cai Y M. 1997. Abundance and distribution of photosynthetic picoplankton and their environmental constraints in Xiangshan Bay. Acta Oceanologica Sinica, 19(1): 87-95.
(in Chinese) |
Ning X, Lin C, Su J, Liu C, Hao Q, Le F. 2011. Long-term changes of dissolved oxygen, hypoxia, and the responses of the ecosystems in the East China Sea from 1975 to 1995. Journal of Oceanography, 67(1): 59-75.
DOI:10.1007/s10872-011-0006-7 |
Nobre A M, Ferreira J G, Nunes J P, Yan X Y, Bricker S, Corner R, Groom S, Gu H F, Hawkins A J S, Hutson R, Lan D Z, Silva J D L, Pascoe P, Telfer T, Zhang X L, Zhu M Y. 2010. Assessment of coastal management options by means of multilayered ecosystem models. Estuarine, Coastal and Shelf Science, 87(1): 43-62.
DOI:10.1016/j.ecss.2009.12.013 |
Park G S, Marshall H G. 2000. Estuarine relationships between zooplankton community structure and trophic gradients. Journal of Plankton Research, 22(1): 121-136.
DOI:10.1093/plankt/22.1.121 |
Parsons T R, Lalli C M. 2002. Jellyfish population explosions: revisiting a hypothesis of possible causes. La Mer, 40: 111-121.
|
Piontkovski S A, Castellani C. 2009. Long-term declining trend of zooplankton biomass in the Tropical Atlantic. Hydrobiologia, 632: 365-370.
DOI:10.1007/s10750-009-9854-1 |
Salmi T, Määttä A, Anttila P, Ruoho-Airola T, Amnell T. 2002. Detecting Trends of Annual Values of Atmospheric Pollutants by the Mann-Kendall Test and Sen's Slope Estimates-the Excel Template Application MAKESENS. Publications on Air Quality 31. Finnish Meteorological Institute, Helsinki.
|
Salvador B, Bersano J G F. 2017. Zooplankton variability in the subtropical estuarine system of Paranaguá Bay, Brazil, in 2012 and 2013. Estuarine, Coastal and Shelf Science, 199: 1-13.
DOI:10.1016/j.ecss.2017.09.019 |
Shurin J B, Borer E T, Seabloom E W, Anderson K, Blanchette C A, Broitman B, Cooper S D, Halpern B S. 2002. A cross-ecosystem comparison of the strength of trophic cascades. Ecology Letters, 5(6): 785-791.
DOI:10.1046/j.1461-0248.2002.00381.x |
Steinberg D K, Lomas M W, Cope J S. 2012. Long-term increase in mesozooplankton biomass in the Sargasso Sea: linkage to climate and implications for food web dynamics and biogeochemical cycling. Global Biogeochemical Cycles, 26(1): 1-16.
DOI:10.1029/2010GB004026 |
Stibor H, Vadstein O, Diehl S, Gelzleichter A, Hansen T, Hantzsche F, Katechakis A, Lippert B, Løseth K, Peters C, Roederer W, Sandow M, Sundt-Hansen L, Olsen Y. 2004. Copepods act as a switch between alternative trophic cascades in marine pelagic food webs. Ecology Letters, 7(4): 321-328.
DOI:10.1111/j.1461-0248.2004.00580.x |
Tang F H, Li L, Liao Y, Wang Y L. 2012. Spatial and temporal distribution on fishery resources of marine pasture demonstration area in Xiangshan Harbor. Journal of Zhejiang University (Science Edition), 39(6): 696-702.
(in Chinese with English abstract) DOI:10.3785/j.issn.1008-9497.2012.06.018 |
The R Development Core Team. 2020. R: A Language and Environment for Statistical Computing. R Foundation for Statistical Computing, Vienna, Austria.
|
Uye S I. 1994. Replacement of large copepods by small ones with eutrophication of embayments: cause and consequence. Hydrobiologia, 292-293(1): 513-519.
DOI:10.1007/BF00229979 |
Valencia B, Landry M R, Décima M, Hannides C C S. 2016. Environmental drivers of mesozooplankton biomass variability in the North Pacific Subtropical Gyre. Journal of Geophysical Research: Biogeosciences, 121(12): 3131-3143.
DOI:10.1002/2016JG003544 |
Wang C S, Liu Z S, He D H. 2003. Seasonal dynamics of zooplankton biomass and abundance in Xiangshan Bay. Journal of Fisheries of China, 27(6): 595-599.
(in Chinese with English abstract) DOI:10.3321/j.issn:1000-0615.2003.06.015 |
Wang K, Wang R, Zuo T, Gao S W. 2004. Analysis of zooplankton biomass in Changjiang River Estuary and adjacent waters. Oceanologia et Limnologia Sinica, 35(6): 568-576.
DOI:10.3321/j.issn:0029-814X.2004.06.014 |
Wang L, Chen Q W, Han R, Wang B D, Tang X U. 2016a. Zooplankton community in Yangtze River Estuary and adjacent sea areas after the impoundment of the Three Gorges Reservoir. Annales de Limnologie-International Journal of Limnology, 52: 273-284.
DOI:10.1051/limn/2016015 |
Wang L, Wang B D, Chen Q W, Tang X W. 2016b. Characteristics of the zooplankton community and impactfactors in the Yangtze estuary coastal eara after third stage impoundment of the Three Gorges Dam. Acta Ecologica Sinica, 36(9): 2505-2512.
(in Chinese with English abstract) DOI:10.5846/stxb201412062423 |
Wang Y H, Tang R Y, Jiang G C, Dong H L, Lei P F, Lu Y. 1984. Distribution features of the chemical elements in Xiang Shan Bay, Zhejiang. Donghai Marine Science, 2(1): 57-62.
(in Chinese with English abstract) |
Wang Y T, Li S F, Yang L L, Yuan X Y, Jiang Y Z, Lin N. 2017. Species composition of larval and juvenile fish in the Xiangshan Bay in spring and summer. Marine Fisheries, 39(3): 286-295.
(in Chinese with English abstract) |
Wang Y T, Sun S, Wang S W, Wang M X, Zhang G T. 2012. Geographical variations in abundance and size of Aequorea coerulescens in the Yellow and East China Seas in spring 2011. Oceanologia et Limnologia Sinica, 43(6): 1096-1102.
(in Chinese with English abstract) |
Xu Z L. 2006. Dynamics of medusa abundance in the East China Sea. Acta Zoologica Sinica, 52(5): 854-861.
(in Chinese with English abstract) |
Xu Z L. 2009. Water environment adaptability and ecological groups of Hydroidomedusae in East China Sea. Chinese Journal of Applied Ecology, 20(1): 177-184.
(in Chinese with English abstract) |
Ye M Y, Li J L, Shi X L, Jiang Y M, Shi Z Q, Xu L H, He G L, Huang R P, Feng B X. 2017a. Spatial pattern change of the coastline development and utilization in Zhejiang from 1990 to 2015. Geographical Research, 36(6): 1159-1170.
(in Chinese with English abstract) DOI:10.11821/dlyj201706013 |
Ye R, Liu L, Wang Q, Ye X S, Cao W, He Q Y, Cai Y H. 2017b. Identification of coastal water quality by multivariate statistical techniques in two typical bays of northern Zhejiang Province, East China Sea. Acta Oceanologica Sinica, 36(2): 1-10.
DOI:10.1007/s13131-017-0981-7 |
Zeng X M, He R Y, Zong H B. 2017. Variability of Changjiang Diluted Water revealed by a 45-year long-term ocean hindcast and Self-Organizing Maps analysis. Continental Shelf Research, 146: 37-46.
DOI:10.1016/j.csr.2017.08.010 |
Zhong H Y. 1988. Distributional features of chemical factors in the Mid-West part of Xiang Shan Bay, Zhejiang. Journal of Zhejiang College of Fisheries, 6(1): 53-61.
(in Chinese with English abstract) |
Zuo T, Wang J, Wu Q, Yuan W, Luan Q S. 2016. Spatial distribution and biomass of large jellyfish in the Yellow Sea and Northern Part of the East China Sea in May 2015. Oceanologia et Limnologia Sinica, 47(1): 195-204.
(in Chinese with English abstract) |