 2021, Vol. 39
Institute of Oceanology, Chinese Academy of Sciences
Article Information
- WANG Qing, WANG Zhenyan, LIU Kai, CUI Quanchao, SHI Xingyu
- Geochemical characteristics and geological implication of ferromanganese crust from CM6 Seamount of the Caroline Ridge in the Western Pacific
- Journal of Oceanology and Limnology, 39(5): 1605-1621
- http://dx.doi.org/10.1007/s00343-021-1032-y
Article History
- Received Mar. 18, 2021
- accepted in principle Apr. 28, 2021
- accepted for publication Jul. 20, 2021


2 Laboratory for Marine Mineral Resources, Pilot National Laboratory for Marine Science and Technology (Qingdao), Qingdao 266237, China;
3 University of Chinese Academy of Sciences, Beijing 100049, China;
4 Center for Ocean Mega-Science, Chinese Academy of Sciences, Qingdao 266071, China
Hydrogenetic ferromanganese crusts (hereinafter referred to as crusts) are composed of Fe hydroxides and Mn oxides that precipitate from cold ambient sea water and generally form on seamounts, ridges, flanks, and peaks of plateaus (Manheim and LaneBostwick, 1989; Hein et al., 2000). Additional to iron and manganese, other elements (e.g., Co, Ni, Mo, W, Te) in the crusts are considered important elements for high-technology and green-technology in the world (Halbach et al., 2017). The main genetic types of crusts include hydrogenetic, hydrothermal, and diagenesis; and the crusts of mixed origin also common (Bonatti et al., 1972; Hein et al., 2000; Marino et al., 2019). Hydrogenetic crusts have a low growth rate, generally about 1–10 mm/Ma (Hein and Koschinsky, 2014). The characteristics of hydrogenetic precipitation that directly derived from ambient cold ocean water and its slowly growth make the crusts an ideal object recording geological events and climate changes during the accretion of successive laminae on the seafloor (Hein et al., 1992; Koschinsky et al., 1995, 2018). Chemical results can be correlated with changes in seawater composition by timevarying geological conditions (Hein et al., 1992; Wu et al., 2001). Isotopes are very reliable in tracking paleo-oceanographic changes of the crusts (Finlayson et al., 2018), but in the absence of isotopes data, finescale analysis can also be considered a direct and effective method to unveil these changes. In the lack of more robust dating techniques for cross-validation, an appropriate estimation of the uncertainty of geochemical data based on the dual-age model cobaltchronometry method (Manheim and Lane-Bostwick, 1988; Puteanus and Halbach, 1988) shall be the best practice for calculating the approximate cumulative growth time of the crusts (Josso et al., 2019). Phosphatization events are commonly registered by old crusts, and the equatorial Pacific crusts data shows that there were two major (39–24 Ma, 27–21 Ma) and three minor (71, 31, and 15 Ma) phosphatization events in seamount sediments (Hein et al., 1993). Under the influence of phosphatization, crusts undergo diagenetic remobilization and reorganization, which no longer represents a complete main crustal hydro-precipitate (Koschinsky et al., 1997). Therefore, it is necessary to find out whether the crust is affected by the phosphatization event when conducting finescale geochemical analysis and paleo-oceanographic sedimentary record research.
The crust exploration area mainly involves the Pacific, Atlantic, Indian, and Arctic Oceans (Hein et al., 2013, 2016, 2017; Conrad et al., 2017; Yeo et al., 2019; Josso et al., 2020). Previous studies of the active Mariana arc system in the Western Pacific on crusts of different origins indicate that the influence of active environment is unconducive to the precipitation of hydrogenetic crusts (Usui and Someya, 1997; Hein et al., 2008). Tectonically, the Caroline Ridge Seamounts is active. The Caroline Ridge is located on the edge of the subduction of the Pacific Plate under the Philippines Plate (Li et al., 2017). Since the Caroline Plate collided against the Philippine Plate at the Yap Trench, the subducting plate is still converging but at a very slow rate (Zhang et al., 2017b). During the Early-Middle Miocene (about 14–23 Ma), an initial rifting event occurred on the Caroline Ridge, bisecting the Caroline Ridge, producing the Sorol Trough (Zhang et al., 2020b). The latest published research indicates that the Caroline Ridge is not an island arc, but an oceanic plateau formed by a mantle plume (Zhang et al., 2020a). Moreover, fresh basalt volcanic glass of about 8 Ma in age was discovered there (Zhang et al., 2017a, 2020a). Internationally, only Japan has been involved in basic hydrogeological surveys of the West Caroline Basin in 1990s, but no crust samples were collected (Kawahata et al., 1998). Recently, Hou et al. (2020) analyzed the geochemical characteristics of crusts from CM4 seamount adjacent to CM6 seamount of the East Caroline Ridge. However, the thicknesses of these crusts are too thin (less than 1 mm) to analyze the paleo-oceanographic information on a large time scale.
In this paper, geochemical characteristics and recorded paleoenvironmental information of a thick crust (38 mm) on the CM6 Seamount of Caroline Ridge are analyzed, aiming to reveal the features of ambient ocean water during the formation of the crusts and their geological implications.
2 MATERIAL AND METHOD 2.1 Ferromanganese crustThe research area (10°06′N, 140°15′E) is located on the east slope of CM6 Seamount of East Caroline Ridge in the Western Pacific Ocean (Fig. 1). The NWtrending seamount situated 766 m below the sea level, and the slope on the west of the seamount ridge is gentler than the east.

|
| Fig.1 The bathymetry of CM6 Seamount on the Caroline Ridge Bathymetric data are from https://www.bluemarblegeo.com/global-mapper. The magenta stripe with an arrow indicates the pathway of the Upper Circumpolar Deep Water (UCDW) (modified after Kawabe et al. (2009), and Kawabe and Fujio (2010)). The positions of M17 and M14 are from Zhang et al. (2020a) and the position of the Site-57 basalt core is from Ridley et al. (1974). |
Crust sample M6-1-2 was collected in situ from the CM6 Seamount (at a water depth of 1 366 m) onboard the R/V Kexue (Science in Chinese) of the Institute of Oceanology, Chinese Academy of Sciences during hydrological and geological surveys on Caroline Ridge in Western Pacific in 2019.
M6-1-2 crust (Fig. 2a) is a dark-brown, dense, massive crust with a thickness of about 40 mm. Its surface has metallic luster with a micro botryoidal texture, high hardness. Part of the pores, especially the larger ones, are filled with tawny clay-like materials. From the lower to the upper layer, the crust sample shows mottled, botryoidal, or dendritic, and columnar textures, respectively (Fig. 3).

|
| Fig.2 The appearance of M6-1-2 crust sample a. the macroscopic view. The blue parallelogram represents the plane that cuts along the growth of the crust and the yellow dotted line is the boundary line of each layer determined according to the growth profile in the variation of elements content of the crust; b. the plane that cuts along the growth of the crust. EPMA transect along the growth axis is scanned along the blue line. The red arrow shows the growth direction. |

|
| Fig.3 Micromorphological characteristics of the crust sample in reflected light field under metallographic microscope a. the upper layer is mainly columnar texture; b. the middle layer is mainly botryoidal texture; c. the lower layer is mainly mottled texture. |
Many studies (Ren et al., 2007; Wang et al., 2011; Marino et al., 2017) have confirmed that electron probe microanalysis (EPMA) is an effective tool for fine-scale chemical profile analysis of crusts. Before analysis, a thin section was prepared along the growth direction of the crust sample, and then polished to make a probe sheet for measurement. Chemical compositions of oxides were analyzed by EPMA with a JEOL JXA-8230 at the State Key Laboratory of Marine Geology (Tongji University) of China (accelerating voltage: 15 kV; beam current: 10 nA; utilizing a 20-μm diameter beam). Natural and synthetic mineral standards were used to calibrate all the quantitative analyses and a ZAF correction was used for data reduction (Z is the atomic number correction related to stopping power of the element; A is the absorption correction: less energetic X-rays from lighter elements are absorbed upon leaving the sample by heavier elements; F is the fluorescence correction: a more energetic X-ray leaving the sample can fluoresce a lower energy X-ray from a lighter element).
The crust sample along transect was analyzed as shown in Fig. 2b. Seventeen major and trace elements: Na, Si, Sr, Al, Mg, Ba, Ca, K, Pb, P, Zn, Cu, Ni, Co, Fe, Mn, and Ti were measured. The corresponding standard samples are respectively, albite, adamant, SrO4, jadeite, olivine, BaTiSi3O9, CaMnSi2O6, orthoclase, PbCrO4, apatite, ZnO, CuO, NiO, CoO, Fe2O3, CaMnSi2O6, and TiO2. The standard deviation (SD) and detection limit (DL) of each measured spot are given in Supplementary Table S1.
2.2.2 X-ray diffractionX-ray diffraction (XRD) analysis was used to determine the mineral components in the crust sample with powder diffraction peak. Specimens of each layer were grounded in a mortar to into the size below 200 mesh, during which all the tools used were wellcleaned with distilled water. An amount of 400-mg powder was taken from each layer and compressed into non-directional tablets by the tableting method. The XRD analysis was completed on Rigaku D/max 2500 diffractometer at the Test Center of the First Bureau of Oceanography, Ministry of Natural Resources, China (CuKa radiation; working voltage: 40 kV; working current: 100 mA; anti-divergence narrow; both slit (Ds) and anti-scatter slit (SS): 1°; the receiving slit (Rs): 0.3 mm; the step length: 0.02° (2θ); the scanning range: 3°–75° (2θ); and the scanning rate: 5°/min). The data from XRD were analyzed with software JADE 6.0, and the mineral corresponding to each diffraction peak was determined according to the Powder diffraction file (PDF) database of the International Center for Diffraction Data (ICDD).
3 RESULT 3.1 Co-chronometry datingOn the assumption that Co flux in the oceanic water column is almost constant, Manheim and LaneBostwick (1988) proposed the relationship between Co content and growth rate in various Fe-Mn deposits:
 (1)
(1)where GR is the growth rate of Fe-Mn deposits accumulation in mm per Ma. Cow=50 Co(%)/w(Fe+Mn) (w(Fe+Mn) is the normalized weight of Fe+Mn in percentage. Co (%) is the concentration (%) of cobalt).
Halbach et al. (1983) developed a more specific relationship between Co content and growth rate for Co-rich crust in the central Pacific Seamounts, and Puteanus and Halbach (1988) proposed the growth rate relationship based on the determination of 10Be and 230Thexcess profiles:
 (1)
(1)where GR is the growth rate of Fe-Mn deposits accumulation in mm per Ma. Co (%) is the concentration (%) of cobalt. The effective application range of this equation is Co concentration greater than 0.24 wt% and less than 2 wt% (Puteanus and Halbach, 1988). No phosphatization marker carbonate fluorapatites (CFA) was found in the crust sample, thus no need to correct the Co content.
It must be noted that the Co concentration calculation method provides the minimum cumulative growth time of crust and cannot identify a break or erosional hiatus that taken place during the whole growth period. In the preliminary research stage, the dating specification of Josso et al. (2019) was used to calculate the above-mentioned two relationships (as represented by Eqs.1 & 2, respectively) to obtain a more reliable data of the cumulative time of crust. Calculation of growth rate and cumulative time of the crust sample is shown in the Supplementary Table S2 of this paper. The crust sample was dated using a high-resolution data along an EPMA transect (Fig. 4) as per Marino et al. (2017).

|
| Fig.4 Chemical composition variation of crust sample The blue dashed line is the stratified boundary. According to the Co empirical equations from Puteanus and Halbach (1988), we calculated that the youngest cumulative growth time for M6-1-2 crust is 11.1 Ma, the age interval of the lower layer ranged from 11.1±0.4 to 9.7±0.3 Ma, the age interval of the middle layer ranged from 9.7±0.3 to 8.5±0.2 Ma, and the age interval of the upper layer ranged from 8.5±0.2 Ma to present. |
The growth rate of the crust calculated by Eqs.1 & 2 respectively is obviously different, and the growth rate based on Eq.1 is smaller than that of the Eq.2. However, the trends of the two methods shown in Fig. 5 are basically the same, except for the opposition at the depth of 25–30 mm. Taking the result obtained from Eq.2 as an example, the growth rate within 18.5- mm depth is relatively stable, and its mainly oscillates between 1.01 and 8.47 mm/Ma with the average value of 3.47 mm/Ma. The increase in localized growth rates occurs in the depth of 10–12 mm only. Below 18-mm depth, other phases of mineral diluted the FeMn oxide components resulting in the increases in growth rate range to 1.41–25.10 mm/Ma on average of 11.40 mm/Ma. This phenomenon is most obvious at the depth of 18–24 mm, and the localized maximum value reached 25.10±1.27 (2σ) mm/Ma.

|
| Fig.5 Growth rate calculation for crust sample (a) and reciprocal age-depth model (b) derived from Co-chronometry equations of Manheim and Lane-Bostwick (1988) and Puteanus and Halbach (1988) The age results of M17-24 and M14-2 are derived from Zhang et al. (2020a). Age of Site-57 basalt core are from Ridley et al. (1974) and the formation time of the Solor Trough is obtained by Zhang et al. (2020b). |
On the assumption that there were no hiatus or erosive events in the crust and the collected crust sample was still growing at present, based on the age derived from the Puteanus and Halbach (1988) and Manheim and Lane-Bostwick (1988), the minimum age at which crust start to form is 11.1±0.4 Ma and 25.2±1 Ma, respectively. The cumulative time of crust sample based on Eq.1 is older than the basalt substrate formation (confirmed by Site-57), which is not credible. Therefore, this study tends to use the result based on Eq.2 as the minimum accumulation time of M6-1-2 crust. According to the change in the chemical composition of the crust obtained by EPMA (Fig. 4), the crust was divided into three layers. Armed with this, it is estimated that the time for the lower, middle, and upper layers of the crust to start to accumulate is 11.1±0.4, 9.7±0.3, and 8.5±0.2 Ma, respectively.
3.2 Texture and mineralogyImages under the Olympus BX53M microscope show layered micro-textures (Fig. 3). The lower layer (Fig. 3c) is dominated by mottled texture with a plenty of porosity and the size of botryoids is about 200 μm×200 μm. The middle layer (Fig. 3b) is mainly botryoidal mixed with little columnar texture. In this layer, porosity is reduced and the size of botryoids is greater than 200 μm×200 μm. In the upper layer however (Fig. 3a), we found massively well-developed columnar texture with significantly less porosity.
The results of XRD analysis are shown in Fig. 6. There are four mineral phase forms in the crust sample. The dominant crystalline phase is ferruginous vernadite (Fe-rich δ-MnO2) having two X-ray reflections each at 1.41 Å and 2.44 Å that gradually increase in sharpness from lower to upper layer, which may be caused by the variation in Mn content between layers (Hein et al., 2000). Fe oxyhydroxide is another major phase, minerals of this phase found in the crust is mainly X-ray amorphous. Detrital minerals quartz (3.34 Å) and plagioclase (3.21 Å and 2.90 Å) appear in the upper layer as a representative of the input of eolian debris (Hein et al., 1985). The carbonate mineral calcite related to the residual biogenic phases is distributed in the middle and lower layers at 1.91 Å, 3.03 Å, and 1.87 Å. According to Zhao et al. (2009), diffraction peaks of carbonate fluorapatites (CFA) are not found in the M6-1-2 crust sample layers, meaning that the crust sample is nonphosphatized.

|
| Fig.6 XRD analysis of crust sample Vernadite (V) appears in all layers at 2.44 Å and 1.41 Å while quartz (Q) and feldspar (F) in the upper layer and calcite (C) in the middle and lower layers. No carbonate fluorapatite (CFA) occurred in each layer of the crust sample. At about 23°, the peaks rise in the middle and lower layers are due to a small amount of crust powder in the sample, so it shows as background signals. |
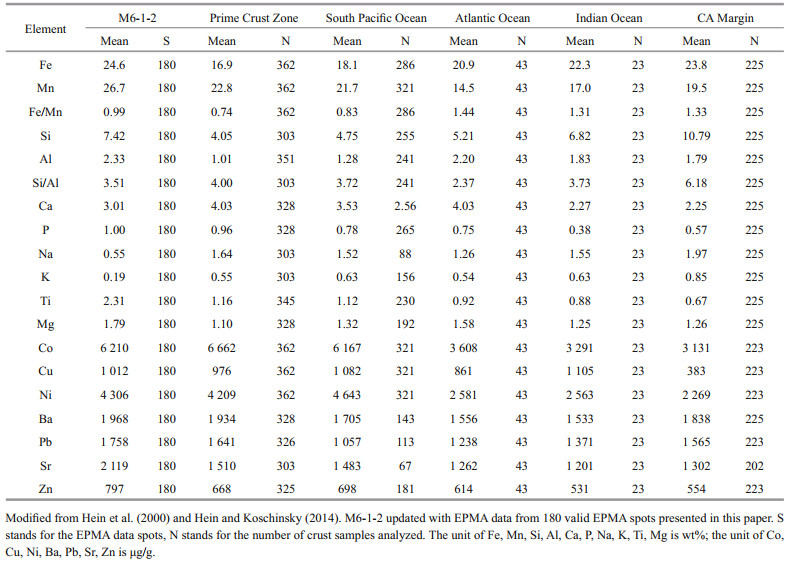
The chemical composition of the crust sample is shown in Table 1. To make the measured results of EPMA spots closer to the bulk crust samples, we used the mean content (the content afterwards is the mean value without explanation) of 180 EPMA spots for comparison to minimize the difference in test methods. Figure 7 adds the content changes between the layers of the crust sample to facilitate a more intuitive comparison. In general, contents of Fe, Mn, and Ti in the M6-1-2 is higher than those of the crusts from the Prime crust Zone, South Pacific Ocean, Atlantic Ocean, Indian Ocean, and California Margin. Meanwhile, the contents of Si, Co, and Ni are higher than most of the above regions. This content change is directly related to the selected measured spots, and a more-matched element content change requires the support of an inductively coupled plasma mass spectrometer. Except for Mn, Co, Ni, and Cu, which have obvious differences of content among the three layers, the contents of other tested elements have smaller fluctuations. In the lower layer, the contents of Mn, Co, Cu, Ni, Pb, and Zn are low, those of Al and Si are basically close to the overall content of the crust, while those of Ba and Sr are high. In the middle layer, the contents of Mn, Co, and Ni are lower than those of the lower growth layer, reaching the lowest content among the three layers. The contents of Ca, Ba, and Sr also reached the lowest at this layer. In contrast, Fe, Al, Si, and Zn reached the highest content in this layer. In the upper layer, Mn, Co, Ni, and Cu have obviously higher content, which contribute significantly to the average value. The contents of Fe, Si, and Al are the lowest in this layer even though their interlayer contents vary a little.

|
| Fig.7 Overall and stratified mean chemical composition of crust from Caroline Ridge CM6 Seamount compared to crusts from global ocean from Hein et al. (2000) and Hein and Koschinsky (2014) |
Figure 4 shows the variation in chemical composition of the sample along the growth transect based on the total EPMA spots data. Content of each measured element in the lower layer fluctuated largely, the oscillation in the middle layer was reduced but remained high, and that of the upper layer was obviously stable. The above-mentioned fluctuation among major elements was distinguishable, especially that in the contents of Si, Al, and K, being the most significant; and they are related to detrital/ aluminosilicate minerals, implying the influence of related minerals in the crust. The Pearson correlation matrix calculated from the EPMA data of the crust layers is presented Supplementary Table S3, which highlight the presence of four groups.
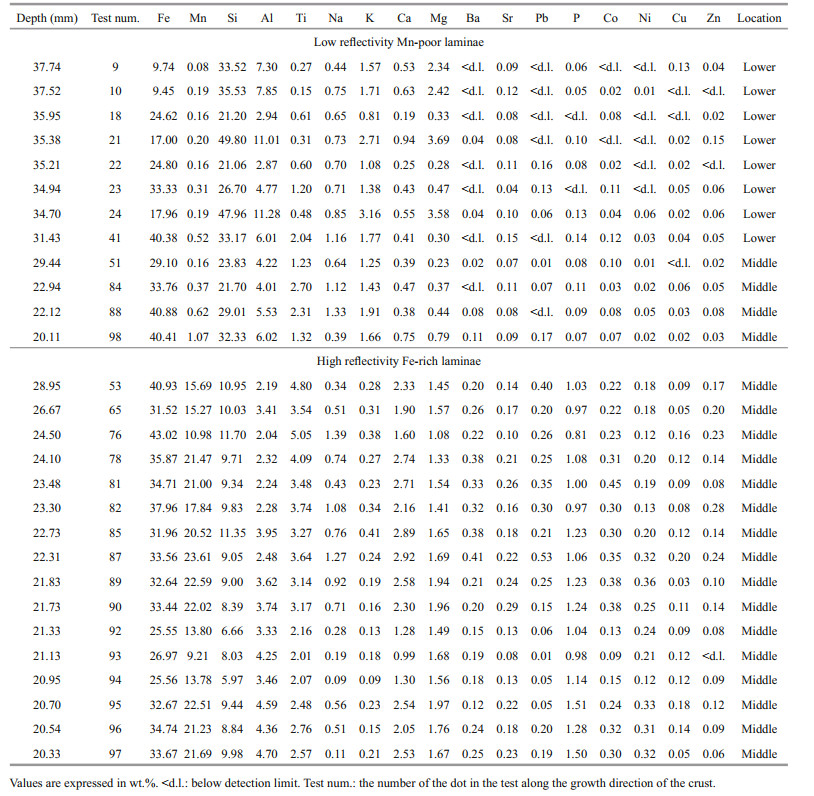
Two types of spots with recognizable characteristics were found in the EPMA data of the crust (Table 2). The first type is what we called low-reflectivity Mnpoor laminae (Fig. 8). The most intuitive feature of the marked spots on the EPMA images is the low reflectivity. Compared with those in Table 1, they have extremely low content of Mn, Ca is also significantly low, and the contents of Ti and P are low. Trace elements of Co, Ni, and Cu are also remarkably low. However, the contents of Si, Al, and K are extremely high, the content of Fe is also higher than that of Mn. The above-mentioned characteristics indicate that this type is composed of aluminosilicate minerals that co-precipitated with Fe-Mn oxides (Halbach, 1986). The second type is characterized by high-reflectivity Fe-rich laminae (Fig. 9). Features of EPMA images and elemental composition confirm that these spots are all Fe-Mn oxide precipitates. However, compared with those in Table 1, the contents of these spots are different, which is specifically manifested in the relatively higher contents of Fe, Ti, Si, and Al, and the low contents of Mn, Co, and Ni. These spots are mainly distributed in the middle layer.
|

|
| Fig.8 EPMA images of low-reflectivity Mn-poor laminae The white dots are EPMA spots for analysis. The numbers are the serial number in the test. |

|
| Fig.9 EPMA images of high reflectivity Fe-rich laminae The white dots are EPMA spots for analysis. The numbers are the serial number in the test. |
The geochemical composition fluctuation of the crust growth profile and the difference of the microstructure characteristics can reflect the changes of the paleo-ocean environment during its growth (Hein et al., 1992). We analyzed the mineral composition, microstructure, and geochemical characteristics of the M6-1-2 crust to determine the changes.
4.1 Element content fluctuation influencing factorsFigure 4 shows that the fluctuations in element content of the crust sample in the middle and lower layers are significantly stronger than those in the upper layer (the major elements are the most obvious), and the crust growth rate is also obviously higher (Fig. 5a). The co-existence of abundant detrital minerals and bioclasts could accelerate the growth rate of the crust (Josso et al., 2019), making it more inclined to form dendritic microstructures (Hein et al., 2000). Characteristics of our crust sample support the above statement. The middle botryoidal and lower mottled/dendritic microstructures (Fig. 3) are filled with a large amount of bioclasts (Fig. 10) and silicate minerals (Fig. 8 & Table 2). XRD results also show that calcites related to biological activities appeared in the middle and lower layers of the crust (Fig. 6), the silicate mineral fraction is amorphous, so the peak cannot be identified in the X-ray powder crystal diffractometer. In the process of line scanning analysis of the crust sample, the biological skeleton has obvious morphological characteristics, so it can avoid being dotted. Silicate minerals, however, are amorphous and thus unavoidable. Therefore, in the correlation matrix of EPMA data (Supplementary Table S3), Si, Al, and K elements related to detrital minerals in the middle and lower layers are significantly correlated, while the correlation between the biologically related elements is not obvious. The increase in content of Si, Al, and K that are related to silicate minerals can dilute obviously the contents of Mn, Co, and Ni.

|
| Fig.10 The backscattering images of carbonate plankton skeleton in the middle and lower layers of the crust sample |
Questionable is that the fluctuations in elemental content of Si and Al in the upper layer of the crust are very small, which seems to be contrary to the phenomenon of quartz and plagioclase minerals in the upper layer of the crust sample in Fig. 6. In fact, this bias is caused by the different ways of sampling between the two test methods. The results shown in Figs. 4 & 6 are true, and it is certain that no quartz or plagioclase were selected from the EPMA measurement spots. Sampling in XRD is on the entire surface that covers the EPMA analysis line, thus quartz and plagioclase in the upper layer of the crust sample but not on the analysis line could be analyzed by XRD, showing the limitation of the line scanning analysis that reflects information of local but entire sample body. Quartz and plagioclase in the sample were considered derived from aeolian input (Halbach et al., 2017). Due to the limitation of the XRD sampling accuracy and the line scanning analysis method itself, we were unable to make an accurate explanation of the source of quartz and plagioclase.
Therefore, we believe that the co-existence of abundant silicate minerals and bioclast in the middle and lower layers of the crust sample were the direct cause of the element content fluctuations, and the differences in microstructure and mineral composition, which is supported by Josso et al. (2020), who conducts a more detailed analysis and discussion of the incorporated substances in the crust sample.
4.2 Minimum oxygen zone expansionThe increase in content of Mn, Co, and Ni in the upper layer implies that the thickness of the minimum oxygen zone (OMZ) in the seawater over the CM6 seamount increased during the growth period of the upper layer of the crust sample (the crust accumulation time is about 8.5 Ma). The OMZ is a reservoir of dissolved Mn, with the migration of the convection and diffusion of seawater, Mn moves out of the OMZ and is oxidized (Hein et al., 2016; Conrad et al., 2017). Expansion of the OMZ could increase the downward supplies of Mn and related elements Co, Ni, leading to an increase of related elements in the crusts that grow below the OMZ. Even in the regions with relatively high detrital materials, the increase in thickness of the OMZ can also inhibit the growth of the crusts (Conrad and Hein, 2013). The growth rate of the upper layer (Fig. 5a) and the variation in content of Mn, Co, and Ni (Fig. 4) all seem to support the assumption of the OMZ expansion, although the less dilution of other detrital and biogenic has a similar effect. In the EPMA images of the upper layer of the crustal sample, silicate minerals featured low reflectivity (Fig. 11) and Mn-poor characteristics. The morphology (Jeong et al., 2000) and element content (Iizasa and Takenouchi, 1989) are consistent with those of biogenic opal-A (Figs. 11 & 12). Shallow water column, cold water temperature, diatom aggregate formation, and quick sinking have positive effects on the preservation of opal-A, and biological productivity is the most important factor (Nelson et al., 1995). Therefore, the burial of opal-A is due to the increase in the primary productivity or diatom productivity. In paleo-productivity studies, buried opal-A is often cited as evidence of high diatom productivity (Mortlock et al., 1991; Ragueneau et al., 2000). Hence, it is believed that the burial of Opal-A provides proof of increased biological productivity for the expansion of OMZ. Moreover, researchers (Farrell et al., 1995; Hermoyian and Owen, 2001) found that from the late Miocene to the early Pliocene, the primary productivity of the Indian Ocean and the Pacific increased significantly, which may also be potential evidence of OMZ expansion in the overlying seawater of the study area. Our study area is influenced by Upper Circumpolar Deep Water (UCDW), an oxygen-rich water comes from the Antarctic Circumpolar Current at the depth of 900–2 000 m (Kawabe et al., 2003; Ronge et al., 2015). It flows in the upper deep layer along the western edge of the equatorial Pacific Ocean, passing through the study area into the Philippine Sea (Kawabe et al., 2009). The encounter between the bottom current and the seamount produces an upwelling, which promoted the biological activities and produced high productivity and is considered one of the reasons for the OMZ expansion (Marino et al., 2019).

|
| Fig.11 Fuzzy-shaped amorphous silica in the upper layer of the M6-1-2 crust sample (only partially listed) The green dots are the EPMA analysis spots. The numbers are the serial number in the test. |

|
| Fig.12 Chemical composition characteristics of higher Fe, Si, Al and lower Mn, Co, Ni content of amorphous silicate mineral in the upper layer of the crust sample The element value at the breakpoint is zero. Test num. represents the serial number in the test. |
Hydrothermal influence in dominantly hydrogenetic deposits has been discovered in the active Mariana arc system in the Western Pacific (Usui and Someya, 1997; Hein et al., 2008), the Wallis and Futuna back-arc in the southwest Pacific (Pelleter et al., 2017), and the Canary Islands Seamounts in the Atlantic Ocean (Marino et al., 2019). The hydrothermal influence in the active Mariana arc and the Wallis and Futuna back-arc system is mainly reflected in the Mn oxide deposits with high Mn/Fe ratio, while the crust from the Canary Islands Seamount shows some minor localized hydrothermal influence at some stratigraphic interval with high Fe/Mn ratio. We noticed that the crust influenced by hydrothermal of the Canary Islands Seamount reported by Marino et al. (2019) has the following characteristics: in terms of mineral composition, goethite, hematite, magnetite/ilmenite, and CFA with quartz, smectite, and feldspar are present, Mn-oxide are very scarce. Under the backscattering microscope, localized hydrothermal influence at some stratigraphic interval has high reflectivity; in terms of element content, it has the characteristics of high Fe (up to 50 wt.%). Marino et al. (2019) also established a relationship between Ferich laminae and local hydrothermal and volcanic activity near seamounts during growth of the crusts.
In the sample M6-1-2, the measurement spots having significant fractionation in Fe and Mn contents (high Fe/Mn) were confirmed to be silicate minerals featuring higher Si, Al, Na, and K contents and low reflectivity (Fig. 8 & Table 2). About one-third of the measurement spots in the middle layer are characterized by high reflectivity and rich in Fe and Ti (Fig. 9 & Table 2). These measurement spots where Fe-Mn oxide precipitates, have relatively higher Si and Al contents and lower Mn, Co, and Ni content than those of the upper layer. It can be seen from the test number (Table 2) that those measurement spots have a certain degree of continuity (mainly in the middle layer close to the upper layer), which indicates that during a period of continuous Fe-Mn oxide precipitation, the contents of Fe, Si, Al ions or clusters in the surrounding seawater increased. The low Co content also reflect the higher growth rate during this period. It should be emphasized that Zhang et al. (2020) discovered fresh volcanic glass on a seamount near the CM6 (Fig. 1, M14) and determined its age to be 8.13±0.81 Ma (K-Ar dating). This age is close to the time when the high-reflectivity Fe-rich laminae appeared about 9.5–8.5 Ma. Therefore, the characteristics of these measurement spots reveal that some stratigraphic intervals of the middle layer near the upper layer was affected by the surrounding volcanic activity during the precipitation. Two reasons could be explained for the minor age difference between the volcanic glass and our sample: 1) the age of a piece of volcanic glass could not record the time elapsed for the entire volcanic activity, and 2) the break or erosional hiatus in the crust is not considered when using Co-chronometry dating.
In addition, the compositions range of ferromanganese deposits precipitated from hydrothermal processes is very broad (Pelleter et al., 2017), and the fractionations of Mn and Fe in the samples are a function of hydrothermal oxidationreduction conditions and distance from the source. Hydrothermal influence on the crust could be from three situations: 1) the distant plume of hydrothermal particles supplying metals; 2) the hydrogenetic crust that is hydrothermally altered by a local fluid; and 3) directly formed from a hydrothermal fluid precipitation. Among the three, we are more inclined to the situation 1. Studies of more samples in the study area may clarify the impact of volcanic activity on crusts more clearly in the future.
4.4 Genesis of crust based on EPMA dataIt is feasible to take advantage of EPMA data to analyze the genesis of crust formation, and to show the information of each measurement spot more clearly. The measured element content of CM6 seamount crust sample after normalization was plotted in the Fe-Mn-(Co+Cu+Ni) ternary and Co/ (Ni+Co) vs. Mn/Fe binary diagram (Fig. 13). All measurement spots fall into the field of hydrogenetic origin. In the ternary diagram, some spots close to the hydrothermal origin are mainly those that may be influenced by volcanic activity as discussed in Section 4.3. Therefore, studies on the impact of volcanic activity on crusts are worthy of further exploration.

|
| Fig.13 Ternary and binary diagram for classification of crust sample The Fe-Mn-(Cu+Co+Ni) Ternary diagram is according to Bonatti et al. (1972), and the Co/(Ni+Co) vs. Mn/Fe binary diagram is according to Marino et al. (2019). |
The cumulative growth time of the crust in CM6 Seamount of the Caroline Ridge in the Western Pacific obtained by Co-chronometry method is 11.1±0.4 Ma. According to the geochemical characteristics, the M6-1-2 crust sample can be divided into three vertical layers: upper, middle, and lower.
The co-existence of abundant silicate minerals and bioclasts was responsible for the drastic element content fluctuations in the middle and lower layers, and for the differences in the microstructure, mineral composition, and the correlation between the elements in the crust.
In the upper layer crust, the cumulative growth time of about 8.5±0.2 Ma, the content variation of Mn, Co, Ni, and other elements accompanied by the burial of opal-A recorded the expansion of oxygen minimum zone. In the middle layer, the highreflectivity Fe-rich laminae are affected by the increase in content of Fe, Si, Al, and other elements that may be released from surrounding volcanic activity.
The genetic diagram drawn by EPMA data shows that the crust is characteristic of hydrogenetic origin.
The crust samples of Caroline Ridge seamount required an early research in isotope geochemistry in near future.
6 DATA AVAILABILITY STATEMENTThe datasets generated during and/or analyzed during the current study are available from the corresponding author on reasonable request.
7 ACKNOWLEDGMENTWe thank scientists and crew of the R/V Kexue (Science in Chinese) in 2019 voyage for the crust sampling and data assistance. Thanks are extended to the Senior Engineer Xuebo YIN, Institute of Oceanology, Chinese Academy of Sciences, for his technological assistance in the sample testing.
Electronic supplementary materialSupplementary material (Supplementary Tables S1–S3) is available in the online version of this article at https://doi.org/10.1007/s00343-021-1032-y.
Bonatti E, Kraemer T F, Rydell H. 1972. Classification and genesis of submarine iron-manganese deposits. In: Horn D R ed. Ferromanganese Deposits on the Ocean Floor. Columbia University National Science Foundation, Washington. p. 149-166.
|
Conrad T, Hein J R, Paytan A, Clague D A. 2017. Formation of Fe-Mn crusts within a continental margin environment. Ore Geology Reviews, 87: 25-40.
DOI:10.1016/j.oregeorev.2016.09.010 |
Conrad T A, Hein J R. 2013. Water depth-composition trends in ferromanganese crusts adjacent to the California margin compared to those in equatorial Pacific crusts. In: AGU Fall Meeting Abstracts. AGU Fall Meeting, AGU, San Francisco, CA, 9-13 December 2013, Abstract OS11d-1678.
|
Farrell J W, Raffi I, Janecek T R, Murray D W, Levitan M, Dadey K A, Emeis K C, Lyle M, Flores J A, Hovan S. 1995. Late Neogene sedimentation patterns in the eastern equatorial Pacific Ocean. In: Pisias N G, Mayer L A, Janecek T R, Palmer-Julson A, van Andel T H eds. Proceedings of the Ocean Drilling Program, Scientific Results. Ocean Drilling Program, College Station, TX. p. 717-756.
|
Finlayson V A, Konter J G, Konrad K, Koppers A A P, Jackson M G, Rooney T O. 2018. Sr-Pb-Nd-Hf isotopes and 40Ar/39Ar ages reveal a Hawaii-Emperor-style bend in the Rurutu hotspot. Earth and Planetary Science Letters, 500: 168-179.
DOI:10.1016/j.epsl.2018.08.020 |
Halbach P E. 1986. Processes controlling the heavy metal distribution in Pacific ferromanganese nodules and crusts. Geologische Rundschau, 75(1): 235-247.
DOI:10.1007/BF01770191 |
Halbach P E, Jahn A, Cherkashov G. 2017. Marine Co-rich ferromanganese crust deposits: description and formation, occurrences and distribution, estimated world-wide resources. In: Sharma R ed. Deep-Sea Mining. Springer International Publishing, Cham. p. 65-141.
|
Halbach P E, Segl M, Puteanus D, Mangini A. 1983. Co-fluxes and growth rates in ferromanganese deposits from central Pacific seamount areas. Nature, 304(5928): 716-719.
DOI:10.1038/304716a0 |
Hein J R, Bohrson W A, Schulz M S, Noble M, Clague D A. 1992. Variations in the fine-scale composition of a central Pacific ferromanganese crust: paleoceanographic implications. Paleoceanography, 7(1): 63-77.
DOI:10.1029/91PA02936 |
Hein J R, Conrad T, Mizell K, Banakar V K, Frey F A, Sager W W. 2016. Controls on ferromanganese crust composition and reconnaissance resource potential, Ninetyeast Ridge, Indian Ocean. Deep Sea Research Part I: Oceanographic Research Papers, 110: 1-19.
DOI:10.1016/j.dsr.2015.11.006 |
Hein J R, Konstantinova N, Mikesell M, Mizell K, Fitzsimmons J N, Lam P J, Jensen L T, Xiang Y, Gartman A, Cherkashov G, Hutchinson D R, Till C P. 2017. Arctic deep water ferromanganese-oxide deposits reflect the unique characteristics of the Arctic Ocean. Geochemistry, Geophysics, Geosystems, 18(11): 3 771-3 800.
DOI:10.1002/2017GC007186 |
Hein J R, Koschinsky A. 2014. Deep-ocean ferromanganese crusts and nodules. In: Holland H D, Turekian K K eds. Treatise on Geochemistry. 2nd edn. Elsevier, Amsterdam. p. 273-291.
|
Hein J R, Koschinsky A, Bau M, Manheim F T, Kang J K, Roberts L. 2000. Cobalt-rich ferromanganese crusts in the Pacific. In: Cronan D S ed. Handbook of Marine Mineral Deposits. CRC Press, Boca Raton. p. 239-279.
|
Hein J R, Manheim F T, Schwab W C, Davis A S. 1985. Ferromanganese crusts from Necker Ridge, Horizon Guyot and S.P. Lee Guyot: geological considerations. Marine Geology, 69(1-2): 25-54.
DOI:10.1016/0025-3227(85)90132-X |
Hein J R, Mizell K, Koschinsky A, Conrad T A. 2013. Deepocean mineral deposits as a source of critical metals for high- and green-technology applications: comparison with land-based resources. Ore Geology Reviews, 51: 1-14.
DOI:10.1016/j.oregeorev.2012.12.001 |
Hein J R, Schulz M S, Dunham R E, Stern R J, Bloomer S H. 2008. Diffuse flow hydrothermal manganese mineralization along the active Mariana and southern Izu-Bonin arc system, western Pacific. Journal of Geophysical Research: Solid Earth, 113(B8): B08S14.
DOI:10.1029/2007JB005432 |
Hein J R, Yeh H W, Gunn S H, Sliter W V, Benninger L M, Wang C H. 1993. Two major Cenozoic episodes of phosphogenesis recorded in equatorial Pacific Seamount deposits. Paleoceanography, 8(2): 293-311.
DOI:10.1029/93PA00320 |
Hermoyian C S, Owen R M. 2001. Late Miocene-early Pliocene biogenic bloom: evidence from low-productivity regions of the Indian and Atlantic Oceans. Paleoceanography, 16(1): 95-100.
DOI:10.1029/2000PA000501 |
Hou X F, Wang Z Y, Li W J, Liu K, Wang Q. 2020. Mineralogy and geochemistry of ferromanganese crusts of Caroline Ridge CM4 guyot in the Western Pacific. Oceanologia et Limnologia Sinica, 51(5): 1 118-1 126.
(in Chinese with English abstract) |
Iizasa K, Takenouchi S. 1989. Todorokite veinlets in opal-A layers of deep-sea manganese nodules from the northern central Pacific. Mining Geology, 39(217): 325-333.
DOI:10.11456/shigenchishitsu1951.39.217_325 |
Jeong K S, Jung H S, Kang J K, Morgan M L, Hein J R. 2000. Formation of ferromanganese crusts on northwest intertropical Pacific seamounts: electron photomicrography and microprobe chemistry. Marine Geology, 162(2-4): 541-559.
DOI:10.1016/S0025-3227(99)00091-2 |
Josso P, Parkinson I, Horstwood M, Lusty P, Chenery S, Murton B. 2019. Improving confidence in ferromanganese crust age models: a composite geochemical approach. Chemical Geology, 513: 108-119.
DOI:10.1016/j.chemgeo.2019.03.003 |
Josso P, Rushton J, Lusty P, Matthews A, Chenery S, Holwell D, Kemp S J, Murton B. 2020. Late Cretaceous and Cenozoic paleoceanography from north-east Atlantic ferromanganese crust microstratigraphy. Marine Geology, 422: 106122.
DOI:10.1016/j.margeo.2020.106122 |
Kawabe M, Fujio S. 2010. Pacific Ocean circulation based on observation. Journal of Oceanography, 66(3): 389-403.
DOI:10.1007/s10872-010-0034-8 |
Kawabe M, Fujio S, Yanagimoto D. 2003. Deep-water circulation at low latitudes in the western North Pacific. Deep Sea Research Part I: Oceanographic Research Papers, 50(5): 631-656.
DOI:10.1016/S0967-0637(03)00040-2 |
Kawabe M, Fujio S, Yanagimoto D, Tanaka K. 2009. Water masses and currents of deep circulation southwest of the Shatsky Rise in the western North Pacific. Deep Sea Research Part I: Oceanographic Research Papers, 56(10): 1 675-1 687.
DOI:10.1016/j.dsr.2009.06.003 |
Kawahata H, Yamamuro M, Ohta H. 1998. Seasonal and vertical variations of sinking particle fluxes in the West Caroline Basin. Oceanologica Acta, 21(4): 521-532.
DOI:10.1016/S0399-1784(98)80035-2 |
Koschinsky A, Heinrich L, Boehnke K, Cohrs J C, Markus T, Shani M, Singh P, Stegen K S, Werner W. 2018. Deep-sea mining: interdisciplinary research on potential environmental, legal, economic, and societal implications. Integrated Environmental Assessment and Management, 14(6): 672-691.
DOI:10.1002/ieam.4071 |
Koschinsky A, Stascheit A, Bau M, Halbach P. 1997. Effects of phosphatization on the geochemical and mineralogical composition of marine ferromanganese crusts. Geochimica et Cosmochimica Acta, 61(19): 4 079-4 094.
DOI:10.1016/s0016-7037(97)00231-7 |
Koschinsky A, Van Gerven M, Halbach P. 1995. First investigations of massive ferromanganese crusts in the NE Atlantic in comparison with hydrogenetic pacific occurrences. Marine Georesources & Geotechnology, 13(4): 375-391.
DOI:10.1080/10641199509388294 |
Li X J, Wang Z, Yao Y J, Gao H F, Li B. 2017. The tectonic features and evolution of the west Pacific margin. Geology in China, 44(6): 1 102-1 114.
|
Manheim F T, Lane-Bostwick C M. 1988. Cobalt in ferromanganese crusts as a monitor of hydrothermal discharge on the Pacific Sea floor. Nature, 335(6185): 59-62.
DOI:10.1038/335059a0 |
Manheim F T, Lane-Bostwick C M. 1989. Chemical Composition of Ferromanganese Crusts in the World Ocean: A Review and Comprehensive Database. U.S. Geological Survey, 89-020, Open-File Report, https://doi.org/10.3133/ofr8920V.1.1.
|
Marino E, González F J, Kuhn T, Madureira P, Wegorzewski A V, Mirao J, Medialdea T, Oeser M, Miguel C, Reyes J, Somoza L, Lunar R. 2019. Hydrogenetic, diagenetic and hydrothermal processes forming ferromanganese crusts in the Canary Island seamounts and their influence in the metal recovery rate with hydrometallurgical methods. Minerals, 9(7): 439.
DOI:10.3390/min9070439 |
Marino E, González F J, Somoza L, Lunar R, Ortega L, Vázquez J T, Reyes J, Bellido E. 2017. Strategic and rare elements in Cretaceous-Cenozoic cobalt-rich ferromanganese crusts from seamounts in the Canary Island Seamount Province(northeastern tropical Atlantic). Ore Geology Reviews, 87: 41-61.
DOI:10.1016/j.oregeorev.2016.10.005 |
Mortlock R A, Charles C D, Froelich P N, Zibello M A, Saltzman J, Hays J D, Burckle L H. 1991. Evidence for lower productivity in the Antarctic Ocean during the last glaciation. Nature, 351(6323): 220-223.
DOI:10.1038/351220a0 |
Nelson D M, Tréguer P, Brzezinski M A, Leynaert A, Quéguiner B. 1995. Production and dissolution of biogenic silica in the ocean: Revised global estimates, comparison with regional data and relationship to biogenic sedimentation. Global Biogeochemical Cycles, 9(3): 359-372.
DOI:10.1029/95GB01070 |
Pelleter E, Fouquet Y, Etoubleau J, Cheron S, Labanieh S, Josso P, Bollinger C, Langlade J. 2017. Ni-Cu-Co-rich hydrothermal manganese mineralization in the Wallis and Futuna back-arc environment (SW Pacific). Ore Geology Reviews, 87: 126-146.
DOI:10.1016/j.oregeorev.2016.09.014 |
Puteanus D, Halbach P E. 1988. Correlation of Co concentration and growth rate-a method for age determination of ferromanganese crusts. Chemical Geology, 69(1-2): 73-85.
DOI:10.1016/0009-2541(88)90159-3 |
Ragueneau O, Tréguer P, Leynaert A, Anderson R F, Brzezinski M A, Demaster D J, Dugdale R C, Dymond J, Fischer G, François R, Heinze C, Maier-Reimer E, Martin-Jézéquel V, Nelson D M, Quéguiner B. 2000. A review of the Si cycle in the modern ocean: Recent progress and missing gaps in the application of biogenic opal as a paleoproductivity proxy. Global and Planetary Change, 26(4): 317-365.
DOI:10.1016/S0921-8181(00)00052-7 |
Ren X W, Glasby G P, Liu J H, Shi X F, Yin J W. 2007. Finescale compositional variations in a Co-rich Mn crust from the Marcus-Wake Seamount cluster in the western Pacific based on electron microprobe analysis (EMPA). Marine Geophysical Researches, 28(2): 165-182.
DOI:10.1007/s11001-007-9024-7 |
Ridley W I, Rhodes J M, Reid A M, Jakes P, Shih C, Bass M N. 1974. Basalts from leg 6 of the deep-sea drilling project. Journal of Petrology, 15(1): 140-159.
DOI:10.1093/petrology/15.1.140 |
Ronge T A, Steph S, Tiedemann R, Prange M, Merkel U, Nürnberg D, Kuhn G. 2015. Pushing the boundaries: glacial/interglacial variability of intermediate and deep waters in the southwest Pacific over the last 350, 000 years. Paleoceanography, 30(2): 23-38.
DOI:10.1002/2014PA002727 |
Usui A, Someya M. 1997. Distribution and composition of marine hydrogenetic and hydrothermal manganese deposits in the northwest Pacific. Geological Society, London, Special Publications, 119(1): 177-198.
DOI:10.1144/GSL.SP.1997.119.01.12 |
Wang Y M, Wang X H, Qu W J, Gao Y S, Gu T X, Fan X T, Andreev S I, Shi X F. 2011. Platinum-group element results for two cobalt-rich seamount crust ultra-fine reference materials: MCPt-1and MCPt-2. Geostandards and Geoanalytical Research, 35(3): 341-352.
DOI:10.1111/j.1751-908X.2010.00052.x |
Wu G H, Zhou H Y, Chen H L. 2001. Progress in the research of cobalt-rich crusts. Geological Journal of China Universities, 7(4): 379-389.
(in Chinese with English abstract) DOI:10.3969/j.issn.1006-7493.2001.04.002 |
Yeo I A, Howarth S A, Spearman J, Cooper A, Crossouard N, Taylor J, Turnbull M, Murton B J. 2019. Distribution of and hydrographic controls on ferromanganese crusts: Tropic Seamount, Atlantic. Ore Geology Reviews, 114: 103131.
DOI:10.1016/j.oregeorev.2019.103131 |
Zhang G L, Wang S, Zhang J, Luo Q, Li T G. 2017a. Proceedings of subduction system and intra-oceanic volcanism of the Western Pacific. Oceanologia et Limnologia Sinica, 48(6): 1 220-1 234.
(in Chinese with English abstract) |
Zhang G L, Zhang J, Wang S, Zhao J X. 2020a. Geochemical and chronological constraints on the mantle plume origin of the Caroline Plateau. Chemical Geology, 540: 119566.
DOI:10.1016/j.chemgeo.2020.119566 |
Zhang Z Y, Dong D D, Sun W D, Zhang G X, Bai Y L. 2020b. Investigation of an oceanic plateau formation and rifting initiation model implied by the Caroline Ridge on the Caroline Plate, western Pacific. International Geology Review, 63(2): 193-207.
DOI:10.1080/00206814.2019.1707126 |
Zhang Z Y, Dong D D, Zhang G X, Zhang G L. 2017b. Topographic constraints on the subduction erosion of the Yap Arc, Western Pacific. Marine Geology & Quaternary Geology, 37(1): 47-50.
(in Chinese with English abstract) DOI:10.16562/j.cnki.0256-1492.2017.01.005 |
Zhao J R, Chu F Y, Yang K H, Lei J J, Jin L. 2009. Manganese mineral components, compositional characteristics and their implication for genesis of cobalt-rich crust from C seamount in Central Pacific. Journal of Marine Sciences, 27(1): 15-21.
(in Chinese with English abstract) |