 2023, Vol. 41
Institute of Oceanology, Chinese Academy of Sciences
Article Information
- WU Pengfei, WU Lin, BAO Lifeng, WANG Long, WANG Bo, TANG Danling
- An internally damped inertial platform for marine gravimetry and a test case in the South China Sea
- Journal of Oceanology and Limnology, 41(2): 816-829
- http://dx.doi.org/10.1007/s00343-023-2337-9
Article History
- Received Oct. 7, 2022
- accepted in principle Nov. 8, 2022
- accepted for publication Dec. 1, 2022


2 University of Chinese Academy of Sciences, Beijing 100049, China;
3 Guangdong Remote Sensing Center for Marine Ecology and Environment (GDRS), Southern Marine Science and Engineering Guangdong Laboratory (Guangzhou), Guangzhou 511458, China;
4 School of Geography and Information Engineering, China University of Geosciences, Wuhan 430074, China
Gravimeters are extremely sensitive accelerometers that measure differences of approximately 1 part per 100 million in the Earth's gravitational field. To measure with such a high accuracy, the sensor must be kept as vertical as possible; otherwise, the measured gravity values will be reduced from the true values. To maintain verticality while the sensor is in motion, it is generally mounted on an inertial platform that constantly detects changes in the ship's level and rectifies these changes to ensure that the sensor is always measuring the true vertical component of the gravity field. Mechanistically, strapdown inertial systems (Verdun and Klingelé, 2005; Cai et al., 2017; Wang et al., 2018; Yuan et al., 2020) have been utilized to measure the gravity component due to their simplicity, for the system the relationship between the body frame and the local-level frame is computed by numerically integrating the output of the gyroscopes. The strapdown approach gives the same level of gravity field information as the more established platform gravimeter at all but the linear bias, this bias is due mostly to the behavior of the accelerometer biases for the strapdown system (Glennie et al., 2000; Bruton et al., 2001).
The Schuler-tuned inertial platform can be used for marine gravity system. These include the GT-2 M from Gravimetric Technologies (Moscow, Russia), the AIRGrav from Sander Geophysics (Ottawa, Canada), and the Chekan-AM from Concern CSRI Elektropribor (St. Petersburg, Russia). Additionally, internally damped inertial platforms, e.g., the BGM-3 from Bell Aerospace (Buffalo, NY, USA), the KSS31 from Bodensee Gravimeter Geo-System (Überlingen, Germany), and the Sea Ⅲ system from Micro-g LaCoste & Romberg (Lafayette, Colorado, USA), can be used. In damped inertial platforms, feedback loops can be designed to make each axis of the platform act like a damped pendulum. A damping period of 2 to 18 min is selected to compensate for ship dynamics, platform levelling accuracy, and gravity sensor resolution (Ander et al., 1999; Abbasi et al., 2007; Forsberg et al., 2015). These platforms are sensitive to ship horizontal accelerations. When measuring gravity at sea from a surface ship, the use of gravimeters mounted on damped platforms can result in errors due to periodic off-levelling of the platform in the presence of horizontal accelerations of the same period. To avoid errors due to the effects of horizontal accelerations on incorrectly levelled platforms, Schuler-tuned inertial platforms are designed to make each axis of the platform act like a dampingfree pendulum. The period of the pendulum is chosen to be 84.4 min, which is called the Schuler period (Schwarz and Wei, 1995). In principle, the effects of horizontal accelerations on platform levelling errors shall be eliminated. However, the platform oscillates at the Schuler frequency due to gyro drift and accelerometer imperfections. As the platform is not damped, the amplitude of these oscillations tends to grow with time. The latest systems developed by Gravimetric Technologies' GT-2 M and Sander Geophysics' AIRGrav systems include a GNSS-aided inertial platform that makes use of GNSS derived velocity. This can be used to dampen the Schuler oscillations and reduce platform off-levelling to a few tens of arcseconds under dynamic conditions in order to meet the requirements for a marine scalar gravity system (Argyle et al., 2000; Stelkens-Kobsch, 2006; Studinger et al., 2008; Abramov and Koneshov, 2015; Sander et al., 2015; Smoller et al., 2015; Golovan et al., 2018). However, GNSS systems cannot function in all cases, such as during underwater gravity surveys in deep ocean areas; therefore, these platform levelling methods are not reliable (Shinohara et al., 2013, 2015; Xiong et al., 2020).
An internally damped inertial platform was also developed for use with the marine gravimeter JMGrav, which was developed and produced by the Innovation Academy for Precision Measurement Science and Technology, Chinese Academy of Sciences. In this paper, we discussed the methods and results of laboratory and sea tests using this system with a special attention to the gyro feedback loop design and to the phase difference control between off-levelling angle motion and horizontal acceleration. The principle and design of the JMGrav gravity sensor are given, the details of the new platform are described, and the requirements for platform operation are addressed.
2 DESIGN AND METHOD 2.1 Sensor designThe JMGrav marine gravimeter consists of three main components: the gravity sensor, the inertia platform, and the data acquisition system. The gravity sensor is used to accurately measure the vertical specific force. The constant gravity acceleration g0 is compensated by a metal zero-length spring made of constant modulus alloy, whereas gravity changes are detected by the built-in electromagnetic system.
The mass-spring system (Fig. 1), which is based on an axially symmetric sensor, consists of a cylindershaped mass guided by 6 threads in frictionless manner. The motion of the mass is limited to one degree of freedom in vertical direction. Thus, horizontal accelerations do not affect the motion, and the sensor is free from any cross-coupling errors.

|
| Fig.1 Schematic diagram of the gravity sensor |
The frictionless guidance of the mass is achieved by means of the tensioned threads that keep the mass system vertically oriented. From the outer frame, 6 horizontal threads in two planes perpendicular to the mass axis are tangentially fixed to the cylindershaped mass in 120° configuration. The threads are tensioned by a pair of springs oriented 180° from each other. Optimum tensioning is very important with respect to system responsiveness and sensitivity to any external perturbing accelerations. The symmetric threads, burdened under static conditions, are loaded by additional forces when undergoing horizontal acceleration. The dimensions of the cross-section are selected to ensure linear measuring conditions up to high rates of acceleration.
A pair of magnets is mounted horizontally on each side of the axis of the mass. They are oriented with the polarities reversed and with an air gap between two magnets encompassing the upper horizontal part of the coil winding component. The magnetic induction is parallel to the normal vector of the coil. The other pair of magnets is mounted in the lower part of the coil-winding component in the same vertical plane as the two magnets above. The magnetic induction of the upper and lower pairs of magnets is of equal magnitude, in exactly opposite directions, and is approximately uniform.
The coil affixed to the mass in the permanent magnetic field is displaced in the vertical direction when subjected to changes in gravity or vertical accelerations. The magnetic damping is produced by a change in the magnetic flux of the coil due to mass motion. Thus, a high level of damping is achieved without the use of liquids. This damping is augmented with circuit damping via sophisticated servo techniques.
A capacitive transducer is mounted at the top of the mass, where it detects extremely small displacements of the mass with respect to the outer casing of the sensor. The servo electronics produce a proportional electrical current through the coil in response to the transducer signal. The resulting electromagnetic force is equal and opposite to the applied acceleration and perfectly balances the inertial reactive forces. Meanwhile, the servo electronics produce an integral electrical current that drives the mass displacement to zero and which suppresses vertical accelerations. The current passing through the coil is thus an exact measure of gravity variations.
Most of the delicate parts of the sensor are contained inside a special Dewar vessel to protect them against sudden temperature changes. A heating wire grid is attached to the Dewar vessel, which, together with electronic controls, keeps the internal temperature at a constant level of approximately 50 ℃. The temperature fluctuations within the Dewar are less than 0.01 ℃. To reduce magnetic disturbances coming from external fields, an extra magnetic shielding is installed. In addition, a pressure-sealed case is provided to prevent changes in air pressure from impacting the sensor.
2.2 Platform designThe platform is designed to keep the sensitivity axis of the gravity sensor in the vertical direction under motion. If this alignment is imperfect, a small error, which is referred to as the off-levelling angle, exists, and the measured gravity will not be correct. To determine what accuracy is required in the platform, it is necessary to determine how the gravimeter reading is affected by errors in verticality. Although the off-levelling angle can take place on both the pitch and roll axes, each axis can be treated independently, and the total error is just the sum of the two. Only one axis will be considered in the following discussion. This can be done by considering Fig. 2, which shows a gravimeter on a platform. The sensitive axis l of the gravimeter is shown to be off vertical by an angle θ (also the off-levelling angle). The gravity measurement error is then:
 (1)
(1)

|
| Fig.2 Gravimeter on a platform |
where g is gravity and x″ is the horizontal acceleration. By disregarding higher-order terms above secondorder terms, Eq.1 can be approximated by:
 (2)
(2)The last term in Eq.2 is the static error that exists even when there is no motion. For a 1 mGal accuracy (1 mGal=10-5/ms2), the second term requires a vertical accuracy of 5 min of arc, which is not hard to attain. The first term, however, depends upon the horizontal acceleration and generally requires a much higher vertical accuracy.
The horizontal acceleration can be viewed as a superposition of multiple harmonic components due to its wide energy distribution band, and a single harmonic is considered here:
 (3)
(3)The corresponding angle θ can be expressed as:
 (4)
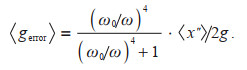
(4)Since both horizontal accelerations x″ and offlevelling angle θ are time-varying with overlapping spectra, a time average must be taken to determine the total off-levelling gravity error. If the two terms with the same period have a phase difference other than 90°, the time average of the product x″θ will not be zero, thereby giving rise to off-lleveling gravity error:
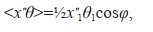 (5)
(5)where the angle brackets denote the time average and φ is the phase difference between θ and x″. In the worst case scenario (where φ=0, π, 2π, …, cosφ=±1), if the magnitude of Eq.5 is less than 1 mGal and x″= 50 Gal; then, θ must be less than 8 arcseconds (Fig. 3). Thus, it is extremely important that the off-levelling angles θ have the same period as the horizontal accelerations x″.

|
| Fig.3 Off-levelling error caused by angles θ and phase difference φ between θ and x″ (where x″=50 Gal) |
To achieve this accuracy, it was necessary to ensure the following: (1) that gyros and accelerometers of adequate accuracy were used; (2) that fast response torque motors were used; and (3) that the gyrolevelling loop, which will be described later, was given a sufficiently long period and the most favorable phase control. The gyros used are model GXT-4B (Aerospace Precision Electromechanical Institute, Xi'an China), which are of inertial guidance quality. The accelerometers are model KTJB1 (Kaituo Navigation Control Technology Co., Hefei China). The accelerometers appear to have adequate accuracy, but more-accurate ones are available for use if it becomes desirable. The motors used are model J130LYX06B (Chengdu Electric MFG. Co., Chengdu China), which utilize a flat armature technology and have an ultra-thin design. The main parameters of the inertial sensors and motor are given in Table 1.
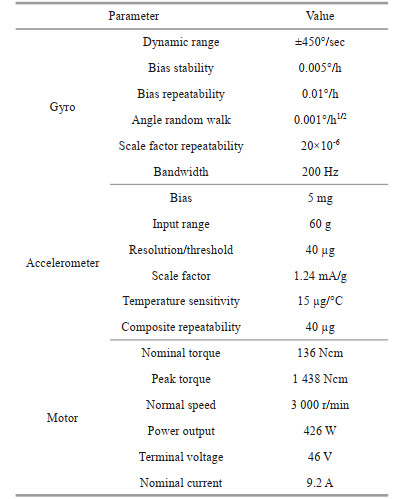
Figure 4 shows the descriptive structure of the inertia platform, including the primary components. The platform was designed as a two-axis gimbal suspension. The gravity sensor element (GSE) is in the center of the platform. Two fiber optic gyros (FOGs) with built-in electronics are orthogonally mounted on their inner gimbals. Outer and inner rotating gimbals are supported by precise bearings, and their axes are aligned parallel to the longitudinal vehicle axis and lateral vehicle axis, respectively. Each gimbal axis is provided with an angular position transducer and a brushless torque motor. A two-channel servo drive provides matching of the gimbals in accordance with the gyro pickoffs. The servo drive consists of two identical channels with a digital signal processing (DSP) controller that controls the torque motors on the corresponding axis of the platform by the signal from the gyro pickoff.

|
| Fig.4 Structure of the inertia platform mounted on a gravity sensor |
When the platform is subjected to disturbing torque along the axis direction, it will cause the frame to rotate, and the gyro installed on the platform becomes sensitive to the rotation of the frame angle and converts the rotation into an electrical signal. After the transfer function, the signal is fed to the motor, which drives the rotation of the platform frame. When the unloading moment generated by the motor is equal to the disturbance moment experienced by the platform, the disturbance moment is completely cancelled, and the platform is stabilized in the inertia space. However, this is not adequate to ensure that the platform remains level because (1) the reference line might not have been vertical to begin with, (2) the gyro has some drift, and (3) the Earth rotates while the gyro tends to remain fixed in space. To attain the vertical accuracy required by Eq.2, two accelerometers are mounted on the platform, as shown in Fig. 4, and a satisfactory gyro leveling loop must be designed. If the accelerometers do not indicate level conditions, they generate error signals. A function of each error signal is fed to the corresponding gyro to gradually precess it to return the reference line of the platform back to vertical. Figure 5 shows a block diagram of the operation of one axis of the platform-levelling loop.

|
| Fig.5 Block diagram of one axis of the platform leveling loop |
In Fig. 5, Bx is the accelerometer zero bias, ε is the gyro drift rate, ωie is the rotational rate of the Earth, L is the latitude of the Earth, γ is the heading, and J is the rotational inertia.
For a small θ, the gyro precession rate in space is expressed as:
 (6)
(6)where (θ+x″/g) is the accelerometer error signal and k is a constant.
The main problem of using Eq.6 as a gyro precession signal is that it depends not only on the misalignment angle θ but also on the horizontal acceleration x″. When accelerometers are used to sense the off levelling, this is unavoidable, unfortunately. It will cause levelling errors.
The horizontal periodic accelerations x″ should have no direct effect on the gyros. However, the accelerometer that provides the precession signal to the gyro is necessarily affected by horizontal accelerations, and then the horizontal acceleration is passed to the gyro as an error. Therefore, the proportional constant that determines the rate at which the gyro is made to precess should be made small; thus, the effect of the horizontal accelerations can be severely reduced. Furthermore, θ will have to match the corresponding component of the Earth's rotation for the platform to remain fixed relative to the Earth, which means that the error signal (θ+x″/g) must differ from zero and that there will be an error in platform verticality. A similar error is produced by gyro drift.
The phase difference between the off-levelling angles θ and the horizontal accelerations x″ is also interesting. The accelerometer error signal will be nearly 180° out of phase with the horizontal accelerations if its natural period is smaller than that of the accelerations. If the output of this accelerometer is proportional to the rate at which the gyro precesses, the angular error motion of the gyro tends to lag 90° behind the output of the accelerometer. Thus, there will also be a phase difference of 90° between θ and x″. This is the condition that is most favorable to minimum off-levelling error, as expressed by Eq.5. Therefore, a better gyro feed signal can be expressed as:
 (7)
(7)This leads to the following equation for the platform:
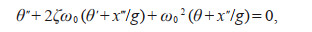 (8)
(8)where ζ is the damping factor, which is determined by the amount of ordinary feedback, and ω0 is the natural frequency of the platform, which is determined by the amount of integral feedback. Notably, the integral term in the feed signal eliminates errors in θ due to the rotation of Earth.
Considering that the horizontal acceleration x″ expressed by Eq.3 is a sinusoidal function of circular frequency ω, the steady state solution of Eq.8 is:
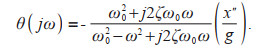 (9)
(9)For perfect operation, θ should be identically equal to zero; therefore, the value of θ given in Eq.9 represents the error in Eq.2. In the first term of Eq.2, only the component of θ that is in phase with x″ is of significance. This component is the real part of the coefficient of x″ in Eq.9. Adding the second term in Eq.2, the resulting off-levelling gravity error is then:
 (10)
(10)where
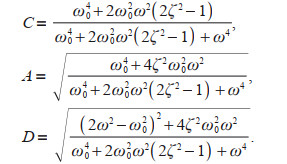
Equation 10 shows that the gravity error oscillates around Cx″12/4g at twice the frequency of the horizontal acceleration. To minimize the gravity error, C should be small. It is smallest for ζ=0, but then C would be singular at ω=ω0. The smallest C without singularity is reached when 2ζ2–1=0, i.e., ζ = 
 (11)
(11)With the damping factor ζ of

|
| Fig.6 Amplitude and phase frequency transfer functions of the platform |
To show how Eq.11 limits the natural frequency ω0 of the platform, the equation is plotted in Fig. 7 for three different values of T0 (T0=2π/ω0 is the natural period of the platform) and for a 100-Gal sinusoidal horizontal acceleration of frequency ω. The curves show that for a platform with a 240-s period, the error is less than 1 mGal for periods shorter than 28 s. Ocean waves have not appreciable amplitudes at periods longer than 28 s; therefore, a 240-s period can be used for the platform.

|
| Fig.7 Variation in average error plotted against horizontal acceleration period for an amplitude equal to 100 Gal and considering the period of the platform |
Figure 8 shows the allowable range of horizontal acceleration that will produce an error of 1 mGal or less for three different values of the period of the platform. For a platform with a 240-s period, horizontal acceleration with amplitudes greater than 100 Gal must have periods shorter than 28 s to stay below the curve. Therefore, the platform period must be increased if the gravimeter is to be operated at horizontal accelerations with lower frequencies.

|
| Fig.8 Variation in average error plotted against horizontal acceleration period for an amplitude equal to 100 Gal and considering the period of the platform |
Horizontal accelerations at lower frequencies and with periods longer than 100 s are generally caused when a ship does not travel in a straight line at constant speed. There are expected deviations in both course and speed, and such deviations can have periods longer than the periods of ocean waves. Figure 9 shows the permissible lateral amplitude of deviation of a ship's track from a straight line for an error of 1 mGal and for three different platform periods. The 240-s curve shows a permissible, lateral amplitude of ship motion of 30 m with a period of 120 s, which can easily be achieved.

|
| Fig.9 Allowable amplitude of sinusoidal ship motion for an error of 1 mGal considering the period of the platform |
The platform has been tested on a motion simulator (Fig. 10), the oscillatory motions of which are practically sinusoidal with maximum amplitudes of 250 cm and periods of 5–1 000 s. For a period of 10 s, horizontal accelerations would reach peaks of 100 Gal. The platform was subjected to simulated sinusoidal horizontal accelerations having periods of 5–20 s with a break of 1 000 s between each test.

|
| Fig.10 Platform on a motion simulator |
An optical autocollimator was utilized to continuously measure the motion of the platform during the roll and pitch simulations. A pair of position-sensitive detectors (PSDs) are employed to measure the phase difference between the angle θ and the horizontal acceleration x″. To determine the phase difference between the two, a specific time point, t2, is set at the zero position of the offlevelling angle curve and a time point, t1, is selected that corresponds to the sine motion curve (Fig. 11) where t1 < t2. Thus, the phase difference between the two can be defined as:
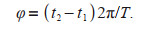 (12)
(12)

|
| Fig.11 Sample records of autocollimator signals and simulator signals for the pitch axis |
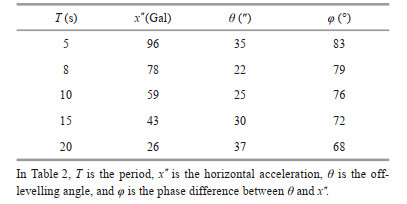
From the test data and phase difference calculated by the above equation, the platform motion lags the simulator by nearly 270° in the high frequency band and by slightly more than 180° in the low frequency band. This result is closer to the expected phase difference in Fig. 6.
The sample values of the simulation tests in the pitch are given in Table 2. Notably, the longer the period of horizontal acceleration is, the greater the off-levelling angle error. Similar results were obtained for the roll.
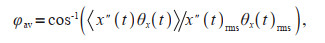
The platform on which a JMGrav gravimeter was mounted was tested in March 2021 on board the R/V Shiyan 2 (operated by South China Sea Institute of Oceanology, CAS), which was conducting a marine ecological survey near the U-boundary (Tang et al., 2018, 2021) in the South China Sea (Table 3). The instrument was located near the intersection of the longitudinal axis and transverse axis of the ship, with the pitch and roll axes of the platform aligned parallel to the longitudinal vehicle axis and the lateral vehicle axis, respectively. Two angle sensors on the gimbal were employed to measure the off-levelling angles. A high-precision INS and GNSS receiver were installed adjacent to the gravimeter to obtain the position, navigation, acceleration, and attitude information. All data were collected and stored in the acquisition system of the gravimeter to ensure adequate time synchronization with the measured data.
The platform and gravimeter surveys were performed in the Nanwei Basin and along the Nanwei Slope (Fig. 12) in the South China Sea. During the survey and tests, sea conditions varied from calm to slight-to-moderate swells. Sea conditions were occasionally rough, with accelerations greater than 100 Gal. However, these conditions provided a rare opportunity to test the instrument's adaptability and accuracy over a wide range of horizontal accelerations. Throughout the entire time of the offshore survey, the instrument was in working order, and its performance was tested over many days of continuous operation.

|
| Fig.12 Track of Shiyan 2 during the survey and test location (in yellow box) Map review No. GS(2022)4314. |
We examined the acquisition system records taken aboard the R/V Shiyan 2 during the round-trip survey in the South China Sea. The data in one direction are plotted in Figs. 13–14, and horizontal accelerations and off-levelling angles are generally irregular and that they may vary continually in amplitude, period, and their relative phase relationships. Since the levelling loop system responds to all accelerations, the attitude and motion of the platform at sea depend on the existing acceleration conditions. Periodic horizontal acceleration causes simultaneous periodic swaying of the gyro, which is transmitted to the platform by the servo system and therefore results in an off-levelling error. The spectrum for surge and sway accelerations in Fig. 13b shows that horizontal accelerations with periods of 2–30 s could present serious off-levelling errors. Regarding the phase relationship, the pitch angle leads surge by approximately 0° to 30°, and the roll angle lags sway by approximately 100° to 120°, which can be observed. From the test data, it is estimated that the off-levelling angles may reach an amplitude of approximately 20 arcseconds at an acceleration period of 5 s and that the phases are delayed by slightly less than 260°. The amplitude increases with increasing period and might reach a value of approximately 40 arcseconds at periods of 15 s. The phase lag is then near 230° because the effect of the damping has been decreased.

|
| Fig.13 Surge and sway accelerations (a), and the spectra of surge and sway accelerations (b) |

|
| Fig.14 Pitch and roll attitude angles (a), and pitch and roll off-levelling angles (b) |
An important point is that the resulting instantaneous off-levelling gravity error may be measured and recorded continuously. This may be achieved by electrically multiplying the instantaneous error signal by the instantaneous horizontal acceleration measured by the accelerometer. Here, however, we are concerned mainly with the time averages rather than the instantaneous errors, since gravity variations have much longer periods and with a minimum period of interest of approximately 5 min. A ship sailing at 10 knots would cover 0.8 nautical miles during that minimum period of interest.
We randomly selected 52 samples from the data, each with a duration of 10 min, for the calculation of instantaneous errors, as well as for calculating the time-averaged pitch and roll off-levelling errors. Table 4 presents data for 16 of the 52 samples, including the time-averaged off-levelling errors. It can be observed that the pitch off-levelling angles are less than 30 arcseconds in the presence of surge accelerations of approximately 60 Gal. The roll offlevelling angles are less than 40 arcseconds in the presence of sway accelerations at an amplitude of approximately 70 Gal. With a few exceptions, the pitch off-levelling errors are mostly negative and less than 0.6 mGal. The roll off-levelling errors are mostly positive and less than 1 mGal. Moreover, we notice that in general, the magnitudes of the roll offlevelling angles and errors were larger than that of the pitch as the sway tends to be larger than the surge.

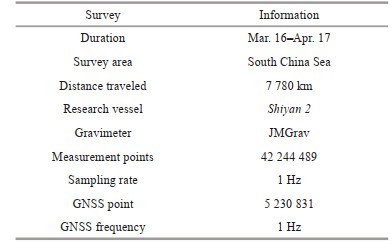
The cosine of an average phase angle can be determined by dividing the calculated off-levelling error by the product of the root mean square (RMS) off-levelling angle and the RMS horizontal acceleration:
 (13)
(13)where the RMS values, as well as the time average of x″(t)θx(t), are calculated from the entire record interval.
Figure 15 shows the histogram of the 52 samples in total, and the off-levelling errors are almost always less than 1 mGal. Somewhat larger than typical values for the amplitudes of acceleration and off-levelling angle are 80 Gal and 40 arcseconds, respectively. If the two signals were in-phase sinusoids at the above amplitudes, the time average of the off-levelling error would be slightly larger than 7 mGal. However, the actual observed errors were much smaller, which can be ascribed to the irregularity of the roll and pitch off-levelling error and phase differences between θ and x″. From the abundance of data, the results show that ship heading is an important factor for head, following, and beam seas in various sea states.

|
| Fig.15 Histogram constructed from 52 samples of offlevelling errors |
First, we measured the gravity along a profile crossing the continental slope (see Fig. 12), where there is an important gravity signal. High-accuracy ocean gravity field models were used as references to assess the external coincidence accuracy of the gravimeter. The Sandwell and Smith series (S & S) (Sandwell et al., 2014; Lequentrec-Lalancette et al., 2016) from the Scripps Institution of Oceanography, University of California San Diego (SIO), and DTU series (Andersen and Knudsen, 2019; Zhang et al., 2021) from the Technical University of Denmark (DTU) are typical representative references. Both models are in states of continuous updating, with the latest releases having an accuracy better than 2 mGal and a spatial resolution of 1′×1′ (Watts et al., 2020; Li et al., 2021). We therefore have very good reference knowledge regarding the gravity anomaly along the profile.
The round trip (repeat lines) measurements on this profile are shown in Fig. 16. The reproducibility between the repeat lines was very good and the overall repeatability of the 225-km lines was 1.7 mGal (RMS). The mean difference between the two transects was equal to 0.3 mGal with a standard deviation of 1.2 mGal. The measurements are also in good agreement with the Sandwell reference data. The standard deviations of the differences between Line 1, Line 2, and Line 3, and the corresponding reference data were 1.2, 1.5, and 1.3 mGal, on average of 0.2, 0.4, and 0.5 mGal, respectively.

|
| Fig.16 Gravity measurements along the profile a. free air gravity anomaly measured by the JMGrav gravimeter (repeat lines) and free air gravity anomaly from satellite measurements (Sandwell v31); b. difference between the repeat lines; c. depth along the profile, https://www.gebco.net. |
Figure 16a shows that the free-air anomalies often vary rapidly along the profile. Figure 16c shows that these variations are very closely related to the changes in bathymetry. The correlation coefficient between the JMGrav gravimeter data and topographic relief was 0.76. The close correlation between the water depth and free-air gravity anomaly shown in Fig. 16 is on its own sufficient justification for believing that the gravimeter data are valid.
Then, we measured the gravity along a grid over the Nanwei Basin in the South China Sea. The grid is laid out as shown in Fig. 17, with 3 east-west lines and 4 north-south lines, resulting in 12 crossing points. The gravity differences at the crossing points are shown in Fig. 17.

|
| Fig.17 The grid layout with gravity differences at the crossing points |
The measurement error of this survey has been estimated to be 1.3 mGal from the differences at the crossing points (the error is calculated by taking the standard deviation of the differences at the crossing points divided by 
We have designed and developed a sophisticated internally damped inertial platform for the JMGrav marine gravimeter. To achieve a gravity measurement accuracy of 1 mGal onboard a ship under the influence of horizontal accelerations, a better gyro levelling loop was developed. The gyro is made to precess at a very slow rate so that it is essentially not affected by the horizontal accelerations caused by ship motions. Additionally, the influence of the Earth's rotation and the relatively large drift of the gyro are compensated for perfectly. In this method, a levelling accuracy of better than a few tens of arcseconds can be achieved. In addition, phase delays are introduced by the levelling loop, and the phase difference between periodic off-levelling motion and horizontal acceleration varies from 90°. This result can typically improve the quality of the gravity data before any processing corrections are applied. The platform on which a JMGrav gravimeter was mounted was tested on board the R/V Shiyan 2 from March 16 to April 17, 2021, during a gravity survey to the South China Sea. Fiftytwo random samples from continuous recordings of the data were calculated, and the platform accuracy was assessed. The off-levelling angles were less than 30 arcseconds, and the phase lags horizontal acceleration by approximately 230° to 260°. From a repeated survey line and crossing points, we obtained gravity measurements with an estimated error between 1.3 and 1.7 mGal. The marine measurements have also been compared to satellite altimetry data and show differences with a standard deviation of 1.5 mGal and a mean value of 0.5 mGal. Based on these test results of the repeat lines the JMGrav gravimeter is deemed operational and ready for further survey operations.
6 DATA AVAILABILITY STATEMENTAll data generated and/or analyzed during this study are shared on reasonable request to the corresponding author.
7 ACKNOWLEDGMENTThe tests in the South China Sea were supported by the U1 voyage of the Integrated Research on Ecological and Environmental Rights in the South China Sea, which was carried out by R/V Shiyan 2.
Abbasi M, Barriot J P, Verdun J. 2007. Airborne LaCoste & Romberg gravimetry: a space domain approach. Journal of Geodesy, 81(4): 269-283.
DOI:10.1007/s00190-006-0107-z |
Abramov D V, Koneshov V N. 2015. On the characteristics and potential facilities of the sensitive unit of the GT-2A gravimeter. Seismic Instruments, 51(1): 80-84.
DOI:10.3103/S0747923915010028 |
Ander M E, Summers T, Gruchalla M E. 1999. LaCoste & Romberg gravity meter: system analysis and instrumental errors. Geophysics, 64(6): 1708-1719.
DOI:10.1190/1.1444675 |
Andersen O B, Knudsen P. 2019. The DTU17 global marine gravity field: first validation results. In: Mertikas S, Pail R eds. Fiducial Reference Measurements for Altimetry. Springer, Cham. p. 83-87, https://doi.org/10.1007/1345_2019_65.
|
Argyle M, Ferguson S, Sander L, et al. 2000. AIRGrav results: a comparison of airborne gravity data with GSC test site data. The Leading Edge, 19(10): 1134-1138.
DOI:10.1190/1.1438494 |
Bruton A M, Hammada Y, Ferguson S et al. 2001. A comparison of inertial platform, damped 2-axis platform and strapdown airborne gravimetry. In: Proceedings of the International Symposium on Kinematic Systems in Geodesy, Geomatics and Navigation. Banff, Canada. p. 542-550.
|
Cai S K, Tie J, Zhang K D, et al. 2017. Marine gravimetry using the strapdown gravimeter SGA-WZ. Marine Geophysical Research, 38(4): 325-340.
DOI:10.1007/s11001-017-9312-9 |
Forsberg R, Olesen A V, Einarsson I. 2015. Airborne gravimetry for geoid determination with Lacoste Romberg and Chekan gravimeters. Gyroscopy and Navigation, 6(4): 265-270.
DOI:10.1134/S2075108715040069 |
Glennie C L, Schwarz K P, Bruton A M, et al. 2000. A comparison of stable platform and strapdown airborne gravity. Journal of Geodesy, 74(5): 383-389.
DOI:10.1007/s001900000082 |
Golovan A A, Klevtsov V V, Koneshov I V, et al. 2018. Application of GT-2A gravimetric complex in the problems of airborne gravimetry. Izvestiya, Physics of the Solid Earth, 54(4): 658-664.
DOI:10.1134/S1069351318040043 |
Lequentrec-Lalancette M F, Salaűn C, Bonvalot S et al. 2016. Exploitation of marine gravity measurements of the mediterranean in the validation of global gravity field models. In: International Symposium on Earth and Environmental Sciences for Future Generations. Springer, Prague, Czech Republic. p. 63-67, https://doi.org/10.1007/1345_2016_258.
|
Li Q Q, Bao L F, Wang Y. 2021. Accuracy evaluation of altimeter-derived gravity field models in offshore and coastal regions of China. Frontiers in Earth Science, 9: 722019.
DOI:10.3389/feart.2021.722019 |
Sander S, Elieff S H P, Sander L. 2015. Accuracy of SGL's AIRGrav airborne gravity system from the Kauring test site and results from a regional hydrocarbon exploration survey. In: International Workshop and Gravity, Electrical & Magnetic Methods and their Applications. Society of Exploration Geophysicists and Chinese Geophysical Society, Chenghu, China. p. 29-32, https://doi.org/10.1190/GEM2015-008.
|
Sandwell D T, Müller R D, Smith W H F, et al. 2014. New global marine gravity model from CryoSat-2 and Jason-1 reveals buried tectonic structure. Science, 346(6205): 65-67.
DOI:10.1126/science.1258213 |
Schwarz K P, Wei M. 1995. Some unsolved problems in airborne gravimetry. In Gravity and Geoid: Joint Symposium of the International Gravity Commission and the International Geoid Commission (p. 131-150). Springer Berlin Heidelberg, https://doi.org/10.1007/978-3-642-79721-7_15.
|
Shinohara M, Yamada T, Ishihara T et al. 2015. Development of an underwater gravity measurement system using autonomous underwater vehicle for exploration of seafloor deposits. In: OCEANS 2015-Genova. IEEE, Genova, Italy. p. 1-7, https://doi.org/10.1109/OCEANS-Genova.2015.7271487.
|
Shinohara M, Yamada T, Kanazawa T et al. 2013. Development of an underwater gravimeter and the first observation by using autonomous underwater vehicle. In: 2013 IEEE International Underwater Technology Symposium (UT). IEEE, Tokyo, Japan. p. 1-6, https://doi.org/10.1109/UT.2013.6519864.
|
Smoller Y L, Yurist S S, Golovan A A, et al. 2015. Using a multiantenna GPS receiver in the airborne gravimeter GT-2a for surveys in polar areas. Gyroscopy and Navigation, 6(4): 299-304.
DOI:10.1134/S2075108715040100 |
Stelkens-Kobsch T H. 2006. Further development of a high precision two-frame inertial navigation system for application in airborne gravimetry. In: Flury J, Rummel R, Reigber C et al eds. Observation of the Earth System from Space. Springer, Berlin, Heidelberg. p. 479-494, https://doi.org/10.1007/3-540-29522-4_31.
|
Studinger M, Bell R, Frearson N. 2008. Comparison of AIRGrav and GT-1A airborne gravimeters for research applications. Geophysics, 73(6): I51-I61.
DOI:10.1190/1.2969664 |
Tang D L, Liu W, Sui G J, et al. 2021. A bibliometric analysis of remote sensing research hotspots on the South China Sea and its U-boundary. Journal of Tropical Oceanography, 40(3): 83-95.
(in Chinese with English abstract) DOI:10.11978/YG2020004 |
Tang D L, Liu Y P, Hao X G, et al. 2018. A newly-discovered historical map using both national boundary and administrative line to represent the U-boundary in the South China Sea. Chinese Science Bulletin, 63(9): 856-864.
(in Chinese with English abstract) DOI:10.1360/N972017-00440 |
Verdun J, Klingelé E E. 2005. Airborne gravimetry using a strapped-down LaCoste and Romberg air/sea gravity meter system: a feasibility study. Geophysical Prospecting, 53(1): 91-101.
DOI:10.1111/j.1365-2478.2005.00436.x |
Wang W, Gao J Y, Li D M, et al. 2018. Measurements and accuracy evaluation of a strapdown marine gravimeter based on inertial navigation. Sensors, 18(11): 3902.
DOI:10.3390/s18113902 |
Watts A B, Tozer B, Harper H, et al. 2020. Evaluation of shipboard and satellite‐derived bathymetry and gravity data over seamounts in the northwest Pacific Ocean. Journal of Geophysical Research: Solid Earth, 125(10): e2020JB020396.
DOI:10.1029/2020JB020396 |
Xiong Z M, Cao J L, Liao K X, et al. 2020. A new method for underwater dynamic gravimetry based on multisensor integrated navigation. Geophysics, 85(3): G69-G80.
DOI:10.1190/geo2019-0006.1 |
Yuan Y, Gao J Y, Wu Z C, et al. 2020. Performance estimate of some prototypes of inertial platform and strapdown marine gravimeters. Earth, Planets and Space, 72(1): 89.
DOI:10.1186/s40623-020-01219-w |
Zhang S J, Abulaitijiang A, Andersen O B, et al. 2021. Comparison and evaluation of high-resolution marine gravity recovery via sea surface heights or sea surface slopes. Journal of Geodesy, 95(6): 66.
DOI:10.1007/s00190-021-01506-8 |