 2023, Vol. 41
Institute of Oceanology, Chinese Academy of Sciences
Article Information
- HAN Tonggang, CHEN Jiangxin, AZEVEDO Leonardo, HE Bingshou, XU Huaning, YANG Rui
- Quantitative estimation of bubble volume fraction of submarine seep plumes by modeling seismic oceanography data
- Journal of Oceanology and Limnology, 41(2): 673-686
- http://dx.doi.org/10.1007/s00343-022-1413-x
Article History
- Received Dec. 9, 2021
- accepted in principle Jan. 6, 2022
- accepted for publication Feb. 23, 2022


2 Key Laboratory of Gas Hydrate, Ministry of Natural Resources, Qingdao Institute of Marine Geology, Qingdao 266071, China;
3 Laboratory for Marine Mineral Resources, Pilot National Laboratory for Marine Science and Technology (Qingdao), Qingdao 266237, China;
4 CERENA, DECivil, Instituto Superior Técnico, Universidade de Lisboa, Av. Rovisco Pais, Lisbon 1049-001, Portugal
Submarine cold seeps have recently attracted significant attention from the scientific community and are usually characterized by the migration and seepage of methane-rich fluids, which are among the most valuable indicators of the presence of gas hydrate below the seafloor (Wan et al., 2020). They are widely distributed in continental margins throughout the world (Judd, 2003; Suess, 2014), which are of great significance for the scientific communities related to marine biodiversity, seabed tectonics, and fluid geology. Submarine cold seeps are a marine geological phenomenon formed by cryogenic gases or fluids (e.g., water, hydrocarbons, hydrothion, and fine-grained sediments), which escape from subsurface sediments at water depths of 200–3 500 m through the seabed by expulsion or leakage and produce a series of physical, chemical, and biological effects (Chen et al., 2002; Judd and Hovland, 2007). They are believed to be a significant source of methane and other greenhouse gases released into the ocean and the atmosphere (Judd et al., 2002; Campbell, 2006; Judd and Hovland, 2007; Naudts et al., 2010), which potentially contributes to global warming, ocean acidification, and therefore affects the global carbon cycle (Wei et al., 2020).
Submarine seep plumes are formed by bubbles of free gas rising through the water column and occur above active submarine cold seeps. Depending on the characteristic of submarine seep plumes, they have been detected by high-frequency acoustic methods (Greinert et al., 2006; Naudts et al., 2010) through the identification of hydroacoustic plumes in the water column (i.e., strong backscatter signals with a flare-like shape). Hydroacoustic plumes are often rooted in the seafloor and have become the most evidence of the presence of an active submarine cold seep (Sassen et al., 2001; Kruglyakova et al., 2002; Luan et al., 2010; Li et al., 2013; Chen et al., 2017). A large number of observations have found that many continuously developed submarine seep plumes are closely associated with gas hydrate decomposition (Chen et al., 2007; Berndt et al., 2014). Accordingly, submarine seep plumes are a good indication of the spatial extent of gas hydrate stability zone (GHSZ) at the seafloor (Westbrook et al., 2008; Thatcher et al., 2013), which can indirectly indicate that there may be gas hydrate accumulations in the subsurface sediments (Li et al., 2013). The ability to model and characterize the characteristics of submarine plumes indirectly from seismic oceanography data might be the key to predicting the spatial distribution of gas hydrates and understanding their generation, migration, and accumulation mechanisms.
The seismic responses produced by submarine seep plumes attracted much attention (Garcia-Gil et al., 2002; Kruglyakova et al., 2002; Luan and Qin, 2005; Gu et al., 2006, 2008; Luan et al., 2008), but seismic reflection characteristics have been simply analyzed and interpreted from a qualitative perspective, without detailed quantitative modeling. On the other hand, seismic reflection data has been widely applied in oil and gas exploration for quantitative interpretation and subsurface modeling and characterization with different applications (e.g., hydrocarbon and CO2 reservoirs). The same method has been applied to image water column features (i.e., seismic oceanography) (Holbrook et al., 2003).
In seismic oceanography, the reflectors identified in the data are associated with the water column thermohaline fine structures such as internal waves and intrusions (on a horizontal scale of ~10–50 m) associated with ocean mixing. Also, these data provide a synoptic image of the ocean as they cover large spatial extents and therefore image larger-scale oceanographic features such as ocean currents, water-mass boundaries, eddies, meddies, and fronts (Holbrook et al., 2003; Ruddick et al., 2009). Therefore, the basic principle of seismic reflection can be applied to the quantitative modeling of physical oceanographic phenomena. The images provided by seismic oceanography can be viewed as the filtering of the true acoustic impedance field, which, on the scales that matter, is primarily (but not completely) associated with temperature variations (Ruddick et al., 2009). Furthermore, it indicates that seismic oceanography can provide an effective quantitative estimation method for oceanographic features and processes (e.g., Papenberg et al., 2010; Azevedo et al., 2021). Compared to conventional high-frequency acoustics and other acoustic oceanographic methods, quantitative interpretation of seismic oceanography data might unlock a new realm of possibilities in the study of the ocean. An example is the possibility to estimate the bubble volume fraction of submarine seep plumes.
In this work, based on the acoustic characteristic of the bubble-bearing water column, we numerically model submarine seep plumes using several theoretical models. We consider that different bubble volume fractions are consistent with the appearance and inherent properties of real submarine plumes (Chen et al., 2020). Different scenarios have been established to study the effect of bubble volume fraction changes on seismic response characteristics. Subsequently, synthetic seismic reflection sections with different dominant frequencies are calculated with numerical simulation. These sections mimic real seismic oceanography data and allow the identification of the seismic response characteristic of submarine seep plumes. Seismic attributes are extracted from these synthetic sections, and the quantitative empirical relationships between seismic attributes and bubble volume fractions are established. The resulting relationships are used to study the seismic response characteristic of submarine seep plumes, to estimate the bubble volume fraction of submarine seep plumes and the methane gas flux of submarine seep plumes per unit time, and to evaluate submarine gas hydrate reserves.
2 MATERIAL AND METHODSubmarine plumes have many components, such as bubbles, gas hydrate and sediment particles, oil droplets and low-density water columns (Merewether et al., 1985; Paull et al., 1995; Leifer and MacDonald, 2003). The physical properties of these components differ significantly from those of seawater, so the acoustic properties of submarine plume regions will usually be significantly different from the surrounding seawater, causing an acoustic impedance contrast. Methane gas bubbles are taken as an example to study the acoustic characteristics of submarine plume regions, and the whole workflow of linking bubble volume fraction to seismic response characteristics is shown in Fig. 1. Chen et al. (2020) demonstrated the ability to model and detect submarine bubble plumes using seismic oceanography, and the study showed herein built upon this previous work. Here we present a brief summary of the method.

|
| Fig.1 Schematic representation of the workflow followed in this work to link quantitatively submarine seep plumes and seismic response characteristics The dotted box indicates technical methods, and the solid box is data information and calculation results. |
Submarine seep plumes are characterized by a flare-like bubble-bearing region surrounded by seawater (Naudts et al., 2010). We use the seawater state equation (IOC et al., 2010) and the sound velocity empirical equation (Wilson, 1962) to establish the initial seawater model. These equations are based on analysis of the physical properties and acoustic characteristics of seawater from physical oceanographic data. Then, the sound velocity and density characteristics of gas bubbles are studied and analyzed in detail, and the acoustic characteristic of the bubble-bearing medium region is derived. The modified gas equation of state (Xie and Zhang, 2014) is used within a bubble dissolution model described by Chen et al. (2020), which is based on pre-defined bubble size models (Leifer and Patro, 2002; McGinnis et al., 2006). These are combined to calculate the density and the sound velocity in gas bubbles, and then the bubble model is established. Afterwards, the initial seawater model and the bubble model are coupled to establish a global submarine seep plume model. The resulting model is a critical data foundation to compute synthetic seismic reflection data, which mimics real seismic oceanography data, used in seismic attribute analysis (i.e., seismic response characteristics) (Chen et al., 2020). To study the influence of bubble volume fraction on seismic response characteristics, submarine seep plume models with different bubble volume fractions are established. The specification of each model is shown in Fig. 2. From this model, we created twenty scenarios where bubble volume fraction varied. The information regarding these scenarios is summarized in Table 1.

|
| Fig.2 The established submarine seep plume theoretical model Submarine seep plume bubble volume fraction model (a), sound velocity model (b), and density model (c); d. Ⅰ: bubble volume fraction parameter profile, see (a) for location (solid yellow line); Ⅱ : sound velocity parameter profile, see (b) for location (solid yellow line); Ⅲ : density parameter profile, see (c) for location (solid yellow line). The white box in (a–c) is the enlarged image of the plume at a distance of 1 000 m. |

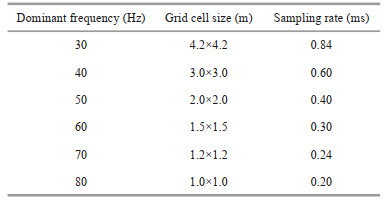
The seismic response characteristic of submarine seep plume models with different bubble volume fractions is computed numerically by solving the two-dimensional acoustic wave equation with the finite-difference method (Madariaga, 1976; Frankel and Clayton, 1984, 1986). This numerical wave simulator models the high order wave phenomena (i.e., implicitly including mode conversions, diffractions, scattering, and evanescent waveforms) associated with complex velocity and density structures (Kelly et al., 1976; Swift et al., 1990). To assess the impact of different source wavelets, we consider a set of Ricker wavelets with different dominant frequencies. Reverse-time migration has been applied to synthetic seismic shot records of the submarine seep plume model to obtain processed seismic sections reflecting the characteristic of the water column and similar to field seismic data (Baysal et al., 1983; Chattopadhyday and McMechan, 2008; Deng and McMechan, 2008) (Fig. 3b). The main acquisition parameters for numerical simulation are summarized in Table 2. Seismic waves are received at full arrays, the receiver interval is 1 m, and 21 shots are stimulated at equal intervals. The synthetic seismic response depends on the dominant frequency used in numerical simulation and consequent spatial resolution.

|
| Fig.3 The synthetic seismic section and seismic attribute section of the submarine seep plume obtained by numerical modeling and the quantitative schematic diagram a. the submarine seep plume bubble volume fraction model; b. synthetic seismic section with the dominant frequency of 50 Hz; c. instantaneous amplitude section in (b); d. instantaneous frequency section in (b); e. instantaneous phase section in (b); f. schematic diagram of fitting parameter extraction and quantitative relationship analysis. Squares with arrows represent extracted seismic attribute values (yellow and dark blue squares) and bubble volume fraction values (black and red squares). The white boxes in (a–e) are enlarged images of the plume at a distance of 1 000 m. |
We extracted instantaneous amplitude, instantaneous frequency, and instantaneous phase seismic attributes from all the synthetic seismic samples modeled numerically (Table 2). The instantaneous amplitude is a measure of reflection strength, depicting the extent of submarine seep plumes along the seismic section (Chen et al., 2020). Frequency-derived attributes are usually related to the attenuation of the acoustic wave field. The attenuation attribute is a powerful tool to detect the presence of hydrocarbon accumulation, mainly gas, in the subsurface. The most common attribute in the frequency class is the instantaneous frequency, a good indicator of a chaotic reflection zone (e.g., acoustic turbidity), such as a gas-bearing zone (You et al., 2015). The instantaneous phase is independent of amplitude and highlights the presence of continuous or discontinuous events. It detects phase changes associated with lateral fluid content or lithological changes (You et al., 2015; Chen et al., 2020). After time-to-depth conversion, seismic attribute sections are finally obtained (Fig. 3c–e).
2.4 Quantitative analysisTo establish a quantitative empirical relationship between the seismic response characteristic and bubble volume fraction, we computed the mean attribute within a moving window that scans all the positions of the submarine plume. This task was performed for each section of the seismic attribute considered (squares with arrows in Fig. 3). The pairs of known bubble volume fraction, computed from the true submarine seep plume bubble volume fraction model, and each seismic attribute are plotted in a two-dimensional domain where the horizontal axis is the bubble volume fraction, and the vertical one is the value of each seismic attribute considered (Fig. 3f). From these two-dimensional domains, we developed empirical functional equation relationships between the seismic attribute value and the submarine seep plume model.
The instantaneous amplitude and the instantaneous frequency can be directly extracted from seismic attribute sections using the method described above, allowing the quantitative relationship between them and bubble volume fraction. When the seismic wave propagates through the interface between seawater and bubbles, there is a phase change, which causes staggering events, but the continuity of events of the seawater layer without bubbles is not affected (Chen et al., 2020). Consequently, it is necessary to introduce a variable to quantify the degree of redundancy (or variability) of the instantaneous phase and then study the quantitative relationship between it and bubble volume fraction. Entropy refers to a measure of the state of specific material systems, and its essence is the degree of chaos inherent in a system. Information entropy (Eq.1) is a concept used to measure the amount of information and measure the degree of order in a system (Shannon, 1948a, b). In this study, information entropy quantifies the internal variability of the instantaneous phase within the submarine seep plume region.
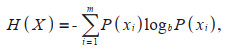 (1)
(1)where X is a random variable, P(xi) is the probability mass function of xi, and b=2 is the logarithm base. When using Eq.1, it is necessary to make a horizontal difference of the dataset within the moving window first.
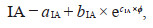
3 RESULT 3.1 Instantaneous amplitudeBased on seismic sections obtained by numerical simulation considering different dominant frequencies, the influence of bubble volume fraction on instantaneous amplitude is analyzed. Figure 4 shows that instantaneous amplitude (IA) increases with the increase of bubble volume fraction. This behavior is consistent at different dominant frequencies. We modeled this relationship with an exponential function (Eq.2), in which the regression coefficient of determination is higher than 0.95, indicating a strong correlation between the two variables and a good fit of degree. The quantitative analysis of the relationship between instantaneous amplitude and bubble volume fraction shows that there is a positive correlation between the two:
 (2)
(2)

|
| Fig.4 Relationship between IA and bubble volume fraction with the dominant frequency of 30 Hz (a), 40 Hz (b), 50 Hz (c), 60 Hz (d), 70 Hz (e), and 80 Hz (f) |
where ϕ is bubble volume fraction, aIA, bIA, and cIA are fitting parameters whose specific values are shown in Table 3.
|
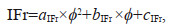
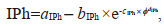
The relationship between instantaneous frequency (IFr) and bubble volume fraction is shown in Fig. 5. From Fig. 5, the instantaneous frequency tends to decrease with increasing bubble volume fraction. For this seismic attribute, we fit a quadratic polynomial function (Eq.3), in which the regression coefficient of determination is higher than 0.88. With the gradual increase of bubble volume fraction, the changing trend of instantaneous frequency is opposite to the one obtained for instantaneous amplitude. The relationship between instantaneous frequency and bubble volume fraction is a negative correlation:
 (3)
(3)

|
| Fig.5 Relationship between IFr and bubble volume fraction with the dominant frequency of 30 Hz (a), 40 Hz (b), 50 Hz (c), 60 Hz (d), 70 Hz (e), and 80 Hz (f) |
where ϕ is bubble volume fraction, aIFr, bIFr, and cIFr are fitting parameters whose specific values are shown in Table 4.
|
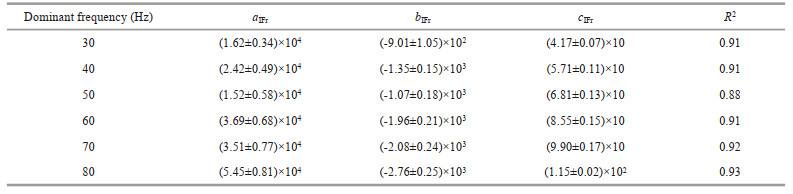
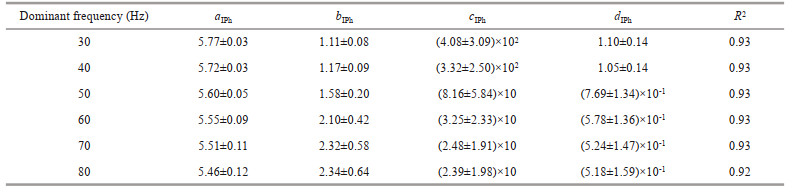
With the increase of bubble volume fraction, the trend of information entropy calculated over the instantaneous phase (IPh) section at different dominant frequencies shows similar characteristics (Fig. 6). There is an "inflection point" in the relationship between information entropy of the instantaneous phase and bubble volume fraction. When the bubble volume fraction is less than approximately 5.0×10⁻³, the information entropy of the instantaneous phase increases rapidly as the bubble volume fraction increases. Nevertheless, when the bubble volume fraction is larger than approximately 5.0×10⁻³, the information entropy of the instantaneous phase shows a slight upward trend as the bubble volume fraction increases, finally reaching a plateau. Equation 4 describes the relationship between the information entropy of the instantaneous phase and bubble volume fraction, in which the regression coefficient of determination is higher than 0.92:
 (4)
(4)

|
| Fig.6 Relationship between information entropy of the IPh and bubble volume fraction with the dominant frequency of 30 Hz (a), 40 Hz (b), 50 Hz (c), 60 Hz (d), 70 Hz (e), and 80 Hz (f) |
where ϕ is bubble volume fraction, aIPh, bIPh, cIPh, and dIPh are fitting parameters whose specific values are shown in Table 5.
|
With the increase of bubble volume fraction, the three seismic attributes change significantly and consistently for all the dominant frequencies considered, indicating that a change of bubble volume fraction has an impact on seismic response characteristics. The reason is that the change of bubble volume fraction impacts the sound velocity and density of the medium (i.e., ocean water), resulting in apparent changes in seismic response characteristics of the submarine seep plume. Additionally, the bubble volume fraction increases, which leads to increased seismic waves and energy scattering. The leading cause of internal scattering in the submarine seep plume is due to the seismic wavelength being longer than the bubble (cluster) size. The seismic scattering phenomenon significantly depends on the relationship between the characteristic heterogeneity size, the propagation distance, and the wavelength (Aki and Richards, 1980). Wu and Aki (1988) categorized the scattering attenuation into several domains according to the product of the wavenumber k and the characteristic heterogeneity length a, which can represent the effects of heterogeneity size on seismic wave propagation. The heterogeneity size considered for the study is 2 m, and the dominant wavelength is around 12–50 m. The product between k and a varies from 0.3 to 1.0. Following the criterion of Wu and Aki (1988), the numerical models utilized herein are classified as being valid in the "Mie scattering regime", where significant scattering may occur. As described above, in Fig. 3b, the seismic waveforms exhibit the signature of a loss of spatial coherence, and seismic events show chaotic features (Sakakibara and Matsushima, 2019).
Instantaneous amplitude increases with increasing bubble volume fraction. This relationship might be related to an increase in the wave impedance contrast between different water layers in the submarine seep plume. This increase is due to the presence of bubbles that cause the scattering of seismic waves. Also, the strength of the scattering of seismic waves increases with increasing bubble volume fraction. Because the scattering effect of bubbles increases with the increase of bubble volume fraction, this causes the high-frequency energy to attenuate considerably and rapidly, resulting in a significant decrease in the instantaneous frequency. Additionally, it leads to a decrease in density, which is another reason for the drop in the instantaneous frequency. The main findings of our work are consistent with previous results obtained by You et al. (2015) and Yang (2019). However, the work presented herein goes a step further by the establishment of quantitative empirical relationships between seismic response characteristics and bubble volume fraction utilizing function equations.
The instantaneous phase and bubble volume fraction cannot be directly expressed by an empirical relationship, so the influence of the change of bubble volume fraction on seismic response characteristics cannot be studied directly. This work innovatively introduces information entropy as a proxy to associate bubble volume fraction with instantaneous phase, and then the relationship between information entropy of the instantaneous phase and bubble volume fraction can be studied quantitatively. When bubbles begin to appear in seawater, due to their random spatial distribution and differences in physical properties, the continuity of events of the seawater layer is staggered, which in turn causes the instantaneous phase to change. As the number of bubbles increases, the bubble volume fraction increases and the information entropy of the instantaneous phase increases rapidly. However, when the bubble volume fraction increases up to a certain level, the event has a large chaotic component, and the instantaneous phase can no longer identify the change of events. Therefore, the information entropy of the instantaneous phase tends to stabilize.
From the seismic scattering phenomenon, the study carefully examines the frequency dependency of the relationship between the seismic response characteristics based on seismic attributes and bubble volume fraction. From the relationship between instantaneous amplitude and bubble volume fraction, it can be found that as the dominant frequency increases, the corresponding instantaneous amplitude value at the same bubble volume fraction shows a decreasing trend (Fig. 4). It is hypothesized that as the dominant frequency of the seismic wavelet increases, the wavelength becomes shorter, resulting in the wavelength being closer to the heterogeneity size, which makes the scattering attenuation of the seismic wave enhancement. In the relationship between instantaneous frequency and bubble volume fraction, the instantaneous frequency decreases faster with the increase of dominant frequency (Fig. 5). The reason is that the energy of the seismic wave is significantly attenuated at high-frequency due to scattering caused by the inhomogeneous medium. Simultaneously, in the relationship between information entropy of the instantaneous phase and bubble volume fraction, the resolution is improved due to the increase of the dominant frequency, and a smaller bubble volume fraction can be detected by the seismic wave field. Consequently, under the same bubble volume fraction, the higher the dominant frequency of the seismic wavelet, the smaller the information entropy of the instantaneous phase (Fig. 6), which reflects a finer characterization of the random medium. The apparent attenuation can lead to the disturbance of frequency contents and phase information. Comparing the instantaneous frequency and instantaneous phase at the same depth of seawater and seep plume, it is found that the instantaneous frequency at the bubble-bearing medium (seep plume) is lower than that at seawater due to scattering attenuation and has a further decreasing trend with the increase of bubble volume fraction. The energy lost when the seismic wave propagates through a random medium becomes the coda wave and the randomness of the scattered wave phase so that the information entropy of the instantaneous phase at the seep plume is higher than that at the seawater. Consequently, the disturbances mentioned above might be associated with the internal scattering caused by an aggregation of seep plumes in the water column, which can quantitatively estimate the bubble volume fraction of submarine seep plumes (Sakakibara and Matsushima, 2019).
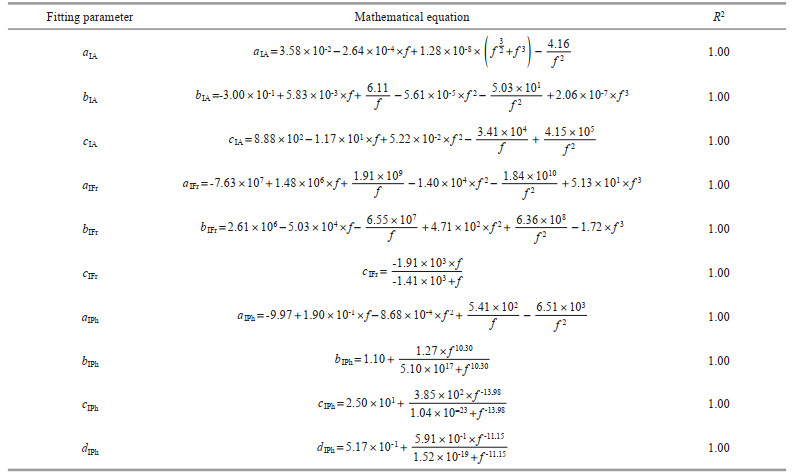
4.2 Estimation of bubble volume fraction from field seismic oceanography dataThe statistical analysis presented herein found empirical relationships between seismic response characteristics (e.g., instantaneous amplitude, instantaneous frequency, and instantaneous phase) and bubble volume fraction. We fitted experimental regressions to describe the variation of fitting parameters in Eqs.2–4 with the dominant frequency. The mathematical relations between fitting parameters in Eqs.2–4 and the dominant frequency are shown in Fig. 7 and Table 6. Moreover, all the mathematical relations between fitting parameters in Eqs.2–4 and the dominant frequency are well described (i.e., all R2 values are approximately equal to 1.00, as shown in Table 6). The results indicate that there is a strong correlation between the fitting parameters describing these empirical relationships and the dominant frequency.

|
| Fig.7 Relationship between the fitting parameters in Eqs.2–4 and the dominant frequency |
|
Based on the submarine seep plume seismic section obtained from field seismic oceanography data, the bubble volume fraction can be roughly estimated using the method proposed herein. This information can be used to predict the methane gas flux of the plume at the vent of the submarine cold seep. The capability might open the door to estimate the gas hydrate reserves below the seafloor. According to the dominant frequency information in field seismic oceanography data and mathematical relations in Table 6, the fitting parameters in Eqs.2–4 can be obtained. The results are substituted into the functional equations (Eqs.2–4), and the bubble volume fraction can be estimated by combining seismic attribute sections with a deterministic and empirical mathematical model. As consequence, the quantitative empirical relationship between seismic response characteristics and bubble volume fraction in field seismic oceanography data can be established by the above method.
This study is aimed at quantitatively analyzing the relationship between seismic response characteristics and bubble volume fraction to establish the bubble volume fraction in the submarine seep plume that can be inverted and predicted from field seismic oceanography data. If only one attribute is used to invert the bubble volume fraction, it will produce a potentially large error. Therefore, we jointly integrate instantaneous amplitude, instantaneous frequency, and instantaneous phase to improve the estimation accuracy, reduce the uncertainty of estimating bubble volume fraction, and obtain more reliable results.
The instantaneous phase changes drastically when the bubble volume fraction is small, and when it is larger than 2.0×10⁻², its change tends to be stable. Consequently, it is sensitive to small bubble volume fractions, so it can be used to detect seismic response characteristics of submarine plumes with small bubble volume fractions. It can be seen from Fig. 5 that when the bubble volume fraction is in the middle position of the range of values considered, there is a strong negative correlation between instantaneous frequency and bubble volume fraction, which has the characteristic of monotonous change. Therefore, the instantaneous frequency can quantitatively estimate the bubble volume fraction in this interval. The instantaneous amplitude has a good relationship with the full range of bubble volume fractions considered. However, when the bubble volume fraction is larger than 2.0×10⁻², the changing trend of instantaneous amplitude under different dominant frequencies shows apparent discrepancies. Therefore, the instantaneous amplitude has advantages in detecting high bubble volume fractions. It is found that different seismic attributes have different sensitivity to bubble volume fractions through statistical analysis. As a result, the advantages of different seismic attributes can comprehensively estimate the bubble volume fraction in the submarine seep plume from field seismic oceanography data. The bubble volume fraction at the same position of the submarine seep plume can be estimated using three seismic attributes. To reduce the error of the calculation, the bubble volume fraction obtained by the estimation from each attribute might be weighted average to enhance the plausibility of the results.
5 CONCLUSIONThis work assesses the possibility to quantitatively estimate the bubble volume fraction of submarine seep plumes from field seismic oceanography data. To attain this objective, we combined numerical simulation and seismic attribute analysis with the establishment of submarine seep plume parameter models. Then, we derived quantitative empirical relationships between seismic response characteristics (e.g., instantaneous amplitude, instantaneous frequency, and instantaneous phase) of the submarine seep plume and bubble volume fraction, and established functional equations between them. As the bubble volume fraction increases, the instantaneous amplitude increases significantly, while the instantaneous frequency decreases, and the information entropy of the instantaneous phase initially increases rapidly, then shows a slight upward trend, and finally stabilizes.
This study proposes a method to estimate the bubble volume fraction in the submarine seep plume by using multi-attributes inversion from field seismic oceanography data, which lays the foundation for the next step of estimating the methane gas flux of submarine plumes per unit time and evaluating the reserves of submarine gas hydrate. The quantitative empirical relationship between seismic response characteristics and bubble volume fraction in this work is a preliminary result, and it's practically needs to be further discussed and verified. To achieve this goal, one possibility is to apply this method to a real seismic oceanography dataset. Nevertheless, this work represents significant progress in acoustic research on submarine seep plumes. The inverted sections obtained with the proposed method can, for example, be used as an initial model for full inversion algorithms of the multi-channel seismic reflection data.
6 DATA AVAILABILITY STATEMENTThe raw data supporting the conclusions of this article will be made available by the authors, without undue reservation, to any qualified researcher.
Aki K, Richards P G. 1980. Quantitative Seismology: Theory and Methods. W. H. Freeman and Co., San Francisco, California. 557p.
|
Azevedo L, Matias L, Turco F, et al. 2021. Geostatistical seismic inversion for temperature and salinity in the Madeira Abyssal Plain. Frontiers in Marine Science, 8: 685007.
DOI:10.3389/fmars.2021.685007 |
Baysal E, Kosloff D D, Sherwood J W C. 1983. Reverse time migration. Geophysics, 48(11): 1514-1524.
DOI:10.1190/1.1441434 |
Berndt C, Feseker T, Treude T, et al. 2014. Temporal constraints on hydrate-controlled methane seepage off Svalbard. Science, 343(6168): 284-287.
DOI:10.1126/science.1246298 |
Campbell K A. 2006. Hydrocarbon seep and hydrothermal vent paleoenvironments and paleontology: past developments and future research directions. Palaeogeography, Palaeoclimatology, Palaeoecology, 232(2-4): 362-407.
DOI:10.1016/j.palaeo.2005.06.018 |
Chattopadhyday S, McMechan G A. 2008. Imaging conditions for prestack reverse-time migration. Geophysics, 73(3): S81-S89.
DOI:10.1190/1.2903822 |
Chen D F, Chen X P, Chen G Q. 2002. Geology and geochemistry of cold seepage and venting-related carbonates. Acta Sedimentologica Sinica, 20(1): 34-40.
(in Chinese with English abstract) DOI:10.3969/j.issn.1000-0550.2002.01.007 |
Chen J X, Song H B, Guan Y X, et al. 2017. A preliminary study of submarine cold seeps applying Seismic Oceanography techniques. Chinese Journal of Geophysics, 60(2): 604-616.
(in Chinese with English abstract) DOI:10.6038/cjg20170215 |
Chen J X, Tong S Y, Han T G, et al. 2020. Modelling and detection of submarine bubble plumes using seismic oceanography. Journal of Marine Systems, 209: 103375.
DOI:10.1016/j.jmarsys.2020.103375 |
Chen Z, Yang H P, Huang Q Y, et al. 2007. Characteristics of cold seeps and structures of chemoauto-synthesis-based communities in seep sediments. Journal of Tropical Oceanography, 26(6): 73-82.
(in Chinese with English abstract) DOI:10.3969/j.issn.1009-5470.2007.06.013 |
Deng F, McMechan G A. 2008. Viscoelastic true-amplitude prestack reverse-time depth migration. Geophysics, 73(4): S143-S155.
DOI:10.1190/1.2938083 |
Frankel A, Clayton R W. 1984. A finite-difference simulation of wave propagation in two-dimensional random media. Bulletin of the Seismological Society of America, 74(6): 2167-2186.
|
Frankel A, Clayton R W. 1986. Finite difference simulations of seismic scattering: implications for the propagation of short-period seismic waves in the crust and models of crustal heterogeneity. Journal of Geophysical Research: Solid Earth, 91(B6): 6465-6489.
DOI:10.1029/JB091iB06p06465 |
Garcia-Gil S, Vilas F, Garcia-Garcia A. 2002. Shallow gas features in incised-valley fills (Ría de Vigo, NW Spain): a case study. Continental Shelf Research, 22(16): 2303-2315.
DOI:10.1016/S0278-4343(02)00057-2 |
Greinert J, Artemov Y, Egorov V, et al. 2006. 1300-m-high rising bubbles from mud volcanoes at 2080 m in the Black Sea: hydroacoustic characteristics and temporal variability. Earth and Planetary Science Letters, 244(1-2): 1-15.
DOI:10.1016/j.epsl.2006.02.011 |
Gu Z F, Liu H S, Zhang Z X. 2008. Acoustic detecting method for bubbles from shallow gas to sea water. Marine Geology & Quaternary Geology, 28(2): 129-135.
(in Chinese with English abstract) DOI:10.16562/j.cnki.0256-1492.2008.02.004 |
Gu Z F, Zhang Z X, Liu H S. 2006. Seismic features of shallow gas in the western area of the Yellow Sea. Marine Geology & Quaternary Geology, 26(3): 65-74.
(in Chinese with English abstract) DOI:10.16562/j.cnki.0256-1492.2006.03.010 |
Holbrook W S, Páramo P, Pearse S, et al. 2003. Thermohaline fine structure in an oceanographic front from seismic reflection profiling. Science, 301(5634): 821-824.
DOI:10.1126/science.1085116 |
IOC, SCOR, IAPSO. 2010. The International Thermodynamic Equation of Seawater-2010: calculation and use of Thermodynamic Properties. Intergovernmental Oceanographic Commission, Manuals and Guides No. 56. UNESCO, 196p.
|
Judd A, Hovland M. 2007. Seabed Fluid Flow: The Impact on Geology, Biology and the Marine Environment. Cambridge University Press, Cambridge, United Kingdom. 408p.
|
Judd A G. 2003. The global importance and context of methane escape from the seabed. Geo-Marine Letters, 23(3-4): 147-154.
DOI:10.1007/s00367-003-0136-z |
Judd A G, Hovland M, Dimitrov L I, et al. 2002. The geological methane budget at continental margins and its influence on climate change. Geofluids, 2(2): 109-126.
DOI:10.1046/j.1468-8123.2002.00027.x |
Kelly K R, Ward R W, Treitel S, et al. 1976. Synthetic seismograms: a finite-difference approach. Geophysics, 41(1): 2-27.
DOI:10.1190/1.1440605 |
Kruglyakova R, Gubanov Y, Kruglyakov V, et al. 2002. Assessment of technogenic and natural hydrocarbon supply into the Black Sea and seabed sediments. Continental Shelf Research, 22(16): 2395-2407.
DOI:10.1016/S0278-4343(02)00064-X |
Leifer I, MacDonald I. 2003. Dynamics of the gas flux from shallow gas hydrate deposits: interaction between oily hydrate bubbles and the oceanic environment. Earth and Planetary Science Letters, 210(3-4): 411-424.
DOI:10.1016/S0012-821X(03)00173-0 |
Leifer I, Patro R K. 2002. The bubble mechanism for methane transport from the shallow sea bed to the surface: a review and sensitivity study. Continental Shelf Research, 22(16): 2409-2428.
DOI:10.1016/S0278-4343(02)00065-1 |
Li C P, Liu X W, Gou L M, et al. 2013. Numerical simulation of bubble plumes in overlying water of gas hydrate in the cold seepage active region. Science China Earth Sciences, 56(4): 579-587.
DOI:10.1007/s11430-012-4508-y |
Luan X W, Liu H, Yue B J, et al. 2010. Characteristics of cold seepage on side scan sonar sonogram. Geoscience, 24(3): 474-480.
(in Chinese with English abstract) DOI:10.3969/j.issn.1000-8527.2010.03.009 |
Luan X W, Qin Y S. 2005. Gas seepage on the sea floor of Okinawa Trough Miyako section. Chinese Science Bulletin, 50(13): 1358-1365.
DOI:10.1360/04wd0257 |
Luan X W, Jin Y K, Obzhirov A, et al. 2008. Characteristics of shallow gas hydrate in Okhotsk Sea. Science in China Series D: Earth Sciences, 51(3): 415-421.
DOI:10.1007/s11430-008-0018-3 |
Madariaga R. 1976. Dynamics of an expanding circular fault. Bulletin of the Seismological Society of America, 66(3): 639-666.
DOI:10.1785/BSSA0660030639 |
McGinnis D F, Greinert J, Artemov Y, et al. 2006. Fate of rising methane bubbles in stratified waters: how much methane reaches the atmosphere?. Journal of Geophysical Research: Oceans, 111(C9): C09007.
DOI:10.1029/2005JC003183 |
Merewether R, Olsson M S, Lonsdale P. 1985. Acoustically detected hydrocarbon plumes rising from 2-km depths in Guaymas Basin, Gulf of California. Journal of Geophysical Research: Solid Earth, 90(B4): 3075-3085.
DOI:10.1029/JB090iB04p03075 |
Naudts L, Greinert J, Poort J, et al. 2010. Active venting sites on the gas-hydrate-bearing Hikurangi Margin, off New Zealand: diffusive- versus bubble-released methane. Marine Geology, 272(1-4): 233-250.
DOI:10.1016/j.margeo.2009.08.002 |
Papenberg C, Klaeschen D, Krahmann G, et al. 2010. Ocean temperature and salinity inverted from combined hydrographic and seismic data. Geophysical Research Letters, 37(4): L04601.
DOI:10.1029/2009GL042115 |
Paull C K, Ussler III W, Borowski W S, et al. 1995. Methane-rich plumes on the Carolina continental rise: associations with gas hydrates. Geology, 23(1): 89-92.
DOI:10.1130/0091-7613(1995)023<0089:MRPOTC>2.3.CO;2 |
Ruddick B, Song H B, Dong C Z, et al. 2009. Water column seismic images as maps of temperature gradient. Oceanography, 22(1): 192-205.
DOI:10.5670/oceanog.2009.19 |
Sakakibara Y, Matsushima J. 2019. Wrapround multiple reflectors over the seafloor in the gas hydrate area: a possible indicator of methane plume. Ocean Science Journal, 54(4): 621-633.
DOI:10.1007/s12601-019-0040-8 |
Sassen R, Losh S L, Cathles III L, et al. 2001. Massive vein-filling gas hydrate: relation to ongoing gas migration from the deep subsurface in the Gulf of Mexico. Marine and Petroleum Geology, 18(5): 551-560.
DOI:10.1016/S0264-8172(01)00014-9 |
Shannon C E. 1948a. A mathematical theory of communication. The Bell System Technical Journal, 27(3): 379-423.
DOI:10.1002/j.1538-7305.1948.tb01338.x |
Shannon C E. 1948b. A mathematical theory of communication. The Bell System Technical Journal, 27(4): 623-656.
DOI:10.1002/j.1538-7305.1948.tb00917.x |
Suess E. 2014. Marine cold seeps and their manifestations: geological control, biogeochemical criteria and environmental conditions. International Journal of Earth Sciences, 103(7): 1889-1916.
DOI:10.1007/s00531-014-1010-0 |
Swift S A, Dougherty M E, Stephen R A. 1990. Finite difference seismic modeling of axial magma chambers. Geophysical Research Letters, 17(12): 2105-2108.
DOI:10.1029/GL017i012p02105 |
Thatcher K E, Westbrook G K, Sarkar S, et al. 2013. Methane release from warming-induced hydrate dissociation in the West Svalbard continental margin: timing, rates, and geological controls. Journal of Geophysical Research: Solid Earth, 118(1): 22-38.
DOI:10.1029/2012JB009605 |
Wan Z F, Chen C M, Liang J Q, et al. 2020. Hydrochemical characteristics and evolution mode of cold seeps in the Qiongdongnan Basin, South China Sea. Geofluids, 2020: 4578967.
DOI:10.1155/2020/4578967 |
Wei J G, Wu T T, Deng X G, et al. 2020. Acoustic characteristics of cold-seep methane bubble behavior in the water column and its potential environmental impact. Acta Oceanologica Sinica, 39(5): 133-144.
DOI:10.1007/s13131-019-1489-0 |
Westbrook G K, Chand S, Rossi G, et al. 2008. Estimation of gas hydrate concentration from multi-component seismic data at sites on the continental margins of NW Svalbard and the Storegga region of Norway. Marine and Petroleum Geology, 25(8): 744-758.
DOI:10.1016/j.marpetgeo.2008.02.003 |
Wilson W D. 1962. Extrapolation of the equation for the speed of sound in sea water. The Journal of the Acoustical Society of America, 34(6): 866.
DOI:10.1121/1.1918215 |
Wu R S, Aki K. 1988. Introduction: seismic wave scattering in three-dimensionally heterogeneous earth. Pure and Applied Geophysics, 128(1-2): 1-6.
DOI:10.1007/BF01772587 |
Xie G, Zhang X Y. 2014. New model of natural gas pressure and density and its application. Journal of Oil and Gas Technology, 36(8): 116-120.
(in Chinese with English abstract) DOI:10.3969/j.issn.1000-9752.2014.08.026 |
Yang S X. 2019. Research on Gas Hydrate Accumulation in South China Sea. Science Press, Beijing, China. p. 360-409.
(in Chinese)
|
You J C, Li C P, Cheng L F, et al. 2015. Numerical simulation of methane plumes based on effective medium theory. Arabian Journal of Geosciences, 8(11): 9089-9100.
DOI:10.1007/s12517-015-1916-2 |