 2023, Vol. 41
Institute of Oceanology, Chinese Academy of Sciences
Article Information
- HAN Bing, ZHAO Zhongxian, WANG Xiaofang, SUN Zhen, LI Fucheng, ZHU Benduo, YAO Yongjian, LIU Liqiang, PENG Tianyue, LONG Genyuan
- Formation of the Zengmu and Beikang Basins, and West Baram Line in the southwestern South China Sea margin
- Journal of Oceanology and Limnology, 41(2): 592-611
- http://dx.doi.org/10.1007/s00343-022-1430-9
Article History
- Received Dec. 17, 2021
- accepted in principle Mar. 10, 2022
- accepted for publication Apr. 16, 2022


2 Key Laboratory of Marine Mineral Resources, Ministry of Natural Resources, Guangzhou 511458, China;
3 Southern Marine Science and Engineering Guangdong Laboratory (Guangzhou), Guangzhou 511458, China;
4 Guangzhou Marine Geological Survey, China Geological Survey, Ministry of Natural Resources, Guangzhou 511458, China;
5 University of Chinese Academy of Sciences, Beijing 100049, China;
6 Hainan Key Laboratory of Marine Geological Resources and Environment, Haikou 570206, China
The South China Sea (SCS) in SE Asia is significantly affected by the interaction of the Eurasian, Pacific, and Australia-India plates (Morley, 2002; Cullen et al., 2010). The northern SCS develops a classical passive continental margin (Taylor and Hayes, 1983), however, the conjugate southern margin is more complex, where continental rifting, strike-slip faulting and terrain collision occurred simultaneously or successively (Hutchison, 1996, 2004; Sun et al., 2009; Cullen, 2010; Madon et al., 2013). In the southwestern SCS margin, the Zengmu Basin is located on the Luconia Block, and the neighboring Beikang Basin is on the Dangerous Grounds (Fig. 1). The two basins are separated by the WBL, a term widely used in the geology of Borneo to denote a roughly linear zone that separates distinct geological units. However, the basins have significantly different geological and geophysical features (Figs. 1–2). To the southwest of the WBL, the Zengmu Basin (also called Sarawak Basin by Madon et al. (2013) or Luconia-Balingian Basin by Cullen et al. (2010) is in shallow water and gas-prone (Fig. 1), which is characterized by low gravity signals (Fig. 2a) (Sandwell et al., 2014), positive magnetic intensity (Fig. 2b) (Maus et al., 2009), high heat flow (> 100 mW/m2, Fig. 2c) (He et al., 2001), and thick layers of sedimentary rocks with few basement faults (Madon et al., 2013). In contrast to the Zengmu Basin, the neighboring Beikang Basin, to the NE of the WBL, is located in deep water and oil-dominated (Fig. 1), featured by a NE-trending gravity anomaly (Fig. 2a), negative magnetic intensity (Fig. 2b), relatively low heat flow (~60 mW/m2, Fig. 2c), and intense basement faults (Madon et al., 2013). These distinct geological and geophysical features across the WBL imply that the two basins may have different origins. The Beikang Basin is usually considered as a rift basin under the regional extensional stress (Liu and Guo, 2003; Madon et al., 2013), while the origin of the Zengmu Basin is debated (Zhong et al., 1994; Wu, 1997; Madon et al., 2013; Xu et al., 2020). Based on the previous seismic interpretation, the Zengmu Basin was suggested to be a Neogene trans-extensional basin controlled by a NW trending strike-slip fault (Zhong et al., 1994). However, Madon et al. (2013) inferred that the Zengmu Basin was initiated as a foreland basin as a result of the collision of the Luconia continental block with Borneo. Wu (1997) proposed that the Zengmu basin was first a foreland basin, and later influenced by the strike-slip faults (Wu, 1997). Xu et al. (2020) argued that the Zengmu Basin comprises several superposed basins, and could be divided into rift basin, peripheral foreland basin, and passive continental margin basin from bottom to top. Moreover, the WBL is another prominent structure, across which the terrain collision between the southern margin and the Borneo after the subduction of the Paleo-SCS occurred earlier in the west than that in the east (Hutchison, 1996; Hall, 2002; Cullen, 2010). However, the nature of the WBL is also unclear. Some authors proposed that the WBL represents a dextral transform fault that accommodated passage of the paleo-SCS during the Eocene to Early Miocene subduction beneath the NW Borneo (Hutchison, 2004; Clift et al., 2008). However, alternative explanation argued that, rather than a major transform boundary, the WBL marks the boundary between domains of continental crust that underwent differential extension in the Eocene (Cullen, 2014). In this study, the stratigraphic and structural interpretation, faults and subsidence analysis, and lithospheric finite extension modelling were carried out using the seismic reflection data to further explore the origin of the Zengmu and Beikang Basins and the nature of the WBL.

|
| Fig.1 The geography and geological maps of the study area In (a), the upper-right corner: regional map showing the location of the study area; lower-left yellow outline: the study area that is located in the southwestern SCS margin, bounded by the surrounding Sundaland by the steep western SCS transform zone and the Lupar Line (Clift et al., 2008) and by the SCS Oceanic basin beside the continent ocean boundary (blue dashed line) (Li et al., 2008). The magnetic lines in the SCS Oceanic basin are modified from Briais et al. (1993). The southern SCS margin is now colliding with the NW Borneo. The Ulugan fault, the Balabac fault, the WBL, and the Lupar Line are modified from the previous studies (Taylor and Hayes, 1980; Clift et al., 2008; Sun et al., 2011a; Zhao et al., 2011; Sibuet et al., 2016). PC: the Palawan-Calamian block; RB: the Reed Bank; DG: the Dangerous Grounds; LB: the Luconia Block. The shallow water Zengmu Basin and the deep water Beikang Basin in the study area are bounded by the WBL. The seismic profiles (light grey lines) and the available two industrial wells Mulu-1 and bako-1 (white circle) (Madon et al., 2013) are present. The blue seismic Lines 1 with 10 pseudo-wells are selected to conduct detailed subsidence and fault activity analysis, Line 2 is the seismic line from Cullen (2014), Line 3 is the seismic line from Clift et al. (2008), and Line 4 is from Madon et al. (2013). The overprinted orange lines are interpreted basement faults on the basis of seismic lines. The distribution of the length and strike of the faults are plotted in the Zengmu Basin (b) and the Beikang Basin (c). |

|
| Fig.2 The distinct contrast of Zengmu and Beikang Basins separated by the WBL a. the free-air gravity anomaly (Sandwell et al., 2014); b. the total magnetic intensity (Maus et al., 2009); c. the heat flow (mW/m2) (He et al., 2001). In the Zengmu Basin, the gravity signals are positive, low, and smooth, the magnetic intensity is also mostly positive, and the heat flow is extremely high of ~80-150 mW/m2 increasing from the WBL to the Lupar Line. In the Beikang Basin, the gravity signals are NE-SW linearly arranged, the magnetic intensity is mostly negative, and the heat flow is generally less than 100 mW/m2 decreasing significantly northeastwards as the location is away from the WBL. For the pseudo-wells P1–P5, the observed heat flow varies between 80 and 100 mW/m2, while they are 50-70 mW/m2 for P6–P10. |
The SCS is a young, large marginal basin in the western Pacific region, formed as a result of multiple continental rifting of the South China block (Ru and Pigott, 1986; Cullen et al., 2010). The rifting first initiated along a former NE-SW trending Yanshan volcanic arc in the Late Cretaceous to early Paleocene (~65±10 Ma) (Holloway, 1982; Taylor and Hayes, 1983; Su et al., 1989; Schlüter et al., 1996; Clift et al., 2002; Cullen et al., 2010). Then rifting propagated westwards in the Middle Eocene (~45 Ma) (Franke et al., 2014). In the early Oligocene (~33 Ma), lithospheric breakup and seafloor spreading first took place in the east SCS sub-basin (Taylor and Hayes, 1983; Briais et al., 1993; Li et al., 2015; Sun et al., 2018) and thereafter propagated to the SW sub-basin in the Early Miocene (~23 Ma) (Briais et al., 1993; Li et al., 2014, 2015; Ding et al., 2018). After the cessation of the seafloor spreading in the Middle Miocene (~15–16 Ma) (Li et al., 2015), the SCS started to subduct beneath the Philippine island along the Manila trench (Briais et al., 1993; Li et al., 2014, 2015).
As the ongoing continental rifting and SCS spreading, the southern SCS margin is eventually moved to its present location between the SCS oceanic basin and the Borneo (Fig. 1) (Holloway, 1982; Kudrass et al., 1986; Yan et al., 2010). The southern SCS margin is bounded from the surrounding Sundaland by the Lupar Line in the west (Morley, 2002; Clift et al., 2008) and the Nansha trough in the south (Hinz et al., 1989) (Fig. 1). In addition to the continental rifting, the southern SCS margin is also affected by strike-slip faulting, subduction of the paleo-SCS, and collision between the southern SCS margin and the Borneo (Hutchison, 1996, 2004; Sun et al., 2009; Cullen, 2010; Madon et al., 2013). Structurally, the southern SCS margin can be divided into four continental blocks including the northern Palawan-Calamian Block, the Reed Bank, the Dangerous Grounds, and the Luconia Block from east to west, which are separated by the Ulugan Fault (Taylor and Hayes, 1980), the Balabac Fault, the WBL, and the Lupar Line, respectively (Fig. 1) (Clift et al., 2008; Sun et al., 2011a; Zhao et al., 2011; Sibuet et al., 2016).
Continental rifting in the southern SCS margin commenced in the Eocene (Madon et al., 2013), where NE-SW trending normal faults are developed but usually found to the east of the WBL (Sun et al., 2011a). The crust is widely extended and the Moho depth is ~22–30 km (Lei et al., 2016). Several sedimentary basins with prolific hydrocarbon resources are formed, such as the Liyue, Beikang, and Zengmu Basins (Fig. 1). The Zengmu Basin is located on the Luconia Block, and the neighboring Beikang Basin is located on the Dangerous Grounds (Fig. 1). The basins are separated by the WBL; however, they show significantly different geological and geophysical features (Fig. 2). Moreover, as the southern SCS margin moved southward, the closure of the paleo-SCS and the terrain collision between the southern margin and the Borneo also occurred first in the west and later in the east across the WBL (Hutchison, 1996; Hall, 2002; Cullen, 2010).
In the west of the WBL, the southward subduction of the paleo-SCS occurred during the Late Cretaceous to Eocene (Hutchison, 1996; Hall, 2002; Cullen, 2010). Then the Luconia Block started to collide with the SW Borneo (Holloway, 1982) and a major mid-Eocene collision unconformity was recorded on land Sarawak (so called "Sarawak Orogeny") (Hutchison, 1996), where the Rajang fold and thrust belt with Late Cretaceous-Eocene deep marine sediments (flysch dominated deposits) in the Sibu Zone is partly overlaid by less deformed OligoceneRecent fluvial to shallow marine sediments ("molasse" deposits) in the Miri zone (Madon et al., 2013). Cullen (2010) proposed that the "Sarawak Orogeny Unconformity" might extend into the Sabah and Palawan regions to the east. The Zengmu Basin within the Luconia Block has received ~12-km thick siliciclastic and carbonate sediments (Madon et al., 2013).
In the east of the WBL, a second collisional event between the Dangerous Grounds and the Sabah occurred in the Miocene resulting in the closure of the Paleo-SCS, the episodic uplift of the Eocene to Lower Miocene turbidites in the west Crocker and the cessation of the SCS spreading (Hutchison, 1996). These Miocene events was prominent on land Sabah and was called "Sabah Orogeny" (Hutchison, 1996). The dramatic uplift in the Western Cordillera of Sabah was suggested to occur in the Middle to Upper Miocene (15–8 Ma) (Hutchison et al., 2000). On the Sabah shelf, the Deep Regional Unconformity (DRU, 15 Ma, the Middle Miocene) and the Shallow Regional Unconformity (SRU, 9 Ma, the Upper Miocene) of the Crocker Formation were thought to be related to the Sabah Orogeny (Tan and Lamy, 1990; Hazebroek and Tan, 1993), and occurred at the Sarawak margin (Mat-Zin and Tucker, 1999). In the southern SCS margin, the Miocene unconformity is also widely observed, which was first termed the Middle Miocene Unconformity (MMU) (Hutchison, 2004). Late it was interpreted as the "break-up unconformity". It demonstrated the transition from active continental rifting to sea-floor spreading of the SCS, and thus was termed the SCS Unconformity (SCSU), which is strongly diachronous and ranges from ~10-Ma gap with up to 2.6 km of section removed to a paraconformity (Cullen et al., 2010). Moreover, in the southern SCS margin, a base-Miocene Unconformity (H160) was identified with the age of late Early Miocene (~17–19 Ma) (Krebs, 2011), and it was inferred to be related to the Sabah Orogeny and was termed the "Early Miocene Unconformity" (EMU) (Madon et al., 2013). These complex tectonic events may have merged in the Miocene, and make each Miocene unconformity difficult to be identified and distinguished (Sun et al., 2011a).
2.2 Stratigraphy and depositional settingThe stratigraphic framework of the Zengmu and Beikang Basins was previously studied (Fig. 3) (Fui, 1978; Mohammad and Wong, 1995; Mat-Zin and Tucker, 1999; Sun et al., 2011b). In the Zengmu Basin, the earliest work divided the Upper Eocene to Pleistocene succession into eight sedimentary cycles (Fui, 1978). Subsequently, an alternative stratigraphic scheme was proposed based on the sequence stratigraphic concepts (Mat-Zin and Tucker, 1999). In the neighboring Beikang Basin, a workable chronostratigraphic chart was developed and four mega/supersequences were proposed through interpretation of seismic sequence stratigraphy (Mohammad and Wong, 1995). In the entire southern SCS margin, Sun et al. (2011b) divided the stratigraphy into three tectonic periods and four stages based on the rifting unconformity, breakup unconformity and rifting-depressing unconformity (Sun et al., 2011b). Combined with the studies (Fui, 1978; Mohammad and Wong, 1995; Mat-Zin and Tucker, 1999; Sun et al., 2011b), and on basis of the industrial wells, Mulu-1 and Bako-1 (Madon et al., 2013), and the seismic lines (Fig. 1), seven prominent seismic reflectors Tg (45 Ma), T5 (40.4 Ma), T4 (30 Ma), T31 (23 Ma), T3 (16.4 Ma), T2 (5.2 Ma), and T1 (1.8 Ma) are identified and used here (Fig. 3) (Yao et al., 2013). The seismic horizons are well correlated with the previous strata divisions (e.g., Line 4 in Madon et al. (2013) (Fig. 4). It is notable that the seismic reflector T3 (16.4 Ma) at the base of the Middle Miocene is the strongest unconformity, which separates the lower strongly deformed sequences from the upper less deformed sequences (Figs. 3 & 4) (Hutchison, 2004; Madon et al., 2013; Yao et al., 2013).

|
| Fig.3 The stratigraphic framework in the study area (Fui, 1978; Mohammad and Wong, 1995; Mat-Zin and Tucker, 1999; Sun et al., 2011b) The global sea level of Haq et al. (1987) is illustrated with the ages calibrated on basis of the new geological timescale summarized by Zhao et al. (2018b). |

|
| Fig.4 The seismic profiles and the interpretations a. the uninterpreted seismic reflection Line 1; b. the interpreted stratigraphic horizons and faults (see location in Fig. 1b). The interpreted horizons are correlated well with the seismic Line 4 from a previous study (Madon et al., 2013). Faults F1–F3 are located in the Zengmu Basin. Faults F4–F7 are probably the component of the WBL. F8–F11 are located in the Beikang Basin; c. the gravity inversed Moho depth (Lei et al., 2016) and the crustal thickness between the sedimentary basement (~45 Ma) and the Moho; d. the close-up seismic profile showing the erosional truncation of the Early Miocene strata (see location in Fig. 4a). "Diapir?" in (b) denotes mud diapirs explained from seismic reflection features, not confirmed by drilling. |
In the Zengmu Basin, it began with non-marine to coastal plain environment in the upper Eocene to the lower Miocene and then became shallower marine upwards (Fui, 1978; Guo et al., 2016). The carbonate platforms were widely formed in the Middle Miocene with ~200 buildups, and were subsequently buried by an Upper Miocene influx of shale from nearby Sarawak when the environment changed to an open marine shelf (Hutchison, 2014). In the Beikang Basin, the wells data of Mulu-1 and Bako-1 and seismic data show a deep marine in the Early Oligocene, and then it shifted to shallow to marginal marine in the Early Miocene (Wang et al., 2002; Madon et al., 2013). Sediment supply from the Zengmu Basin also increased in this period (Lei et al., 2020). From the Middle Miocene to the recent, the water deepened to outer shelf and deep marine environment (Mohammad and Wong, 1995; Lei et al., 2020). Most carbonate platforms are developed in the Middle Miocene along the NE-SW trending structural highs and faults, and drowned in the Late Miocene with only a small number of isolated carbonate buildups presently active (Hutchison, 2014; Yan et al., 2018).
3 DATA AND METHOD 3.1 DataThe 50 seismic reflection lines in the Zengmu and Beikang Basins acquired by the Guangzhou Marine Geological Survey (GMGS) are compiled (Fig. 1). The composite deep-reflection seismic Line 1, running across the eastern Zengmu Basin, the West Baram Line, and the middle of Beikang Basin (Fig. 1), is used to conduct the stratigraphic and structural interpretation, faults and subsidence analysis, as well as lithospheric finite extension modeling. The composite line has a total length of 460 km (Fig. 1), which was acquired in 1987 and 1999, respectively, using a 3.3-km cable streamer with 120 channels and a hydrophone group at the interval of 26 m. The data were shot at every 53 m and recorded in SEG-D format at a sample rate of 2 ms. Then the seismic data was reprocessed through pre-stack migration processing, during which the seismic interval velocity was obtained and was used to analyze the seismic facies and lithologies.
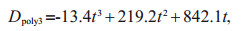
3.2 Time-depth conversionAlong seismic Line 1, the seismic interval velocity obtained during the seismic processing (Fig. 5a) is used to convert the time to depth (Fig. 4b). Generally, the interval velocity increases from ~1 700 to 4 000 m/s as the strata bury deeper (Fig. 5a). Furthermore, the time-depth function in the form of three-order polynomial (Eq.1) is also fitted using the previous method (Zhao et al., 2015) on basis of the seismic velocities of the 50 seismic lines (Fig. 1), which can be used to conduct time-depth conversion to seismic profiles where lack well control.
 (1)
(1)

|
| Fig.5 The variations in seismic interval velocity, estimated paleo water depth, and sand content a. the seismic interval velocity of the five strata with the ages of 45-30, 30-16.4, 16.4-5.2, 5.2-1.8, and 1.8-0 Ma (see location in Fig. 1b). The interval velocity increases systematically from 1 700 to 4 300 km/s with increasing age and buried depth; b. the estimated paleo water depth on basis of the sedimentary facies (Fui, 1978; Wang et al., 2002; Madon et al., 2013; Hutchison, 2014; Guo et al., 2016; Yan et al., 2018; Lei et al., 2020) progressively deepens from the Zengmu to Beikang Basins. In the Zengmu Basin, the paleo-water depth is less than ~200 m. In the Beikang Basin, less than ~400-600 m prior to ~16.4 Ma. Since the Middle Miocene, the water depth increased significantly to ~1 300-2 000 m; c. the sand content shows a decreasing trend with increasing water depth from 45-0 Ma. |
where Dpoly3 is depth in meter below seafloor and t is the two-way travel time in second below seafloor.
3.3 BackstrippingBasin subsidence usually contains the tectonic subsidence and the sediment and water loaded subsidence (Zhao et al., 2013). Through backstripping technique, the tectonic uplift and subsidence processes can be readily derived (Watts and Ryan, 1976; Steckler and Watts, 1978; Sclater and Christie, 1980; Zhao et al., 2013). Previous studies have offered the method to calculate the water-loaded tectonic subsidence (Watts and Ryan, 1976; Steckler and Watts, 1978; Sclater and Christie, 1980). Zhao et al. (2013) developed an innovated mathematical model to calculate the tectonic subsidence without the load effect of filled water. Considering the high heat flux (He et al., 2001) and low flexural rigidity (Clift et al., 2002) in the study area, the unloaded tectonic subsidence along Line 1 is calculated based on the assumption of local isostatic compensation with Eq.2 (Zhao et al., 2013).
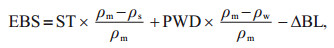 (2)
(2)where ρw, ρs, and ρm are the average density of water (~1 030 kg/m3), sediment (~2 400 kg/m3), and the asthenospheric mantle (~3 184 kg/m3), respectively. EBS is the unloaded tectonic subsidence, ST is the decompacted sediment thickness, PWD is the paleowater depth, and ΔBL is the change in the base level between different stages.
The subsidence rate between any two time (k and n, k > n) are given in Eq.3 (Zhao et al., 2013).
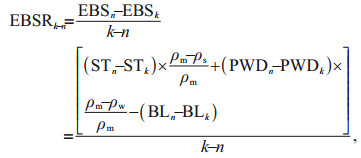 (3)
(3)where EBSRk–n represents the subsidence rate between timestamp k and timestamp n.
During the subsidence calculation, the base level, the decompacted sediment thickness, and the estimated paleo-water depth are critical parameters. The base level is the reference height for all subsidence calculation (Zhao et al., 2018b). The third order global sea level, by Haq et al. (1987), with the ages calibrated based on the new geological timescale (Fig. 3) is used. The lithological composition of each sequence and the porosity-depth relationship are required in order to obtain the decompacted sediment thickness (Zhao et al., 2015). Previous studies showed that the basin is filled with mainly siliciclastics and only partly carbonate in the Middle Miocene (Fui, 1978; Mohammad and Wong, 1995; Mat-Zin and Tucker, 1999; Sun et al., 2011b; Madon et al., 2013). Along Line 1, the sand content of each sequence (Fig. 5c) was converted from the seismic interval velocity using the equation Ps=[vn(t0)–vn1(t0)]/[vn2(t0)–vn1(t0)], where t0 is the two-way travel time, vn(t0) is the seismic interval velocity, vn1(t0) is the mudstone interval velocity, and vn2(t0) is the sandstone interval velocity. The sand content reduces upwards and northwards as water depth increases (Fig. 5c). The Middle Miocene limestone content is ~5%–13% in reference to wells Mulu-1 and Bako-1, and the adjacent Wanan basin (Yao et al., 2018). Here, the porosity-depth relationship of Eq.4 (Athy, 1930) and the compaction parameters of sandstone, mudstone, and limestone listed in Table 1 (Sclater and Christie, 1980; Zhao et al., 2015) are used to decompact the buried sediment.
 (4)
(4)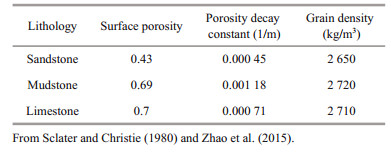
where, ϕ(z) is the porosity at depth z, ϕ0 is the porosity at surface, c is compaction coefficient.
However, the biggest uncertainty in calculating the tectonic subsidence is caused by the estimated paleo-water depth. The uncertainties become larger as water depth increases and can reach kilometers in bathyal or abyssal environments (Sclater and Christie, 1980; Zhao et al., 2013; Xie et al., 2014; Zhao et al., 2018b). Here, the paleo-water depth is determined on basis of previous depositional environment studies (Fui, 1978; Wang et al., 2002; Madon et al., 2013; Hutchison, 2014; Guo et al., 2016; Yan et al., 2018; Lei et al., 2020) and the sedimentary facies interpretation from the seismic Line 1 (Fig. 5a). Then the paleo-water depth along Line 1 (Fig. 5b) was determined according to Table 2. Generally, the paleowater depth in most part of the Zengmu Basin varies between 0 to 200 m, while in the Beikang Basin the water depth increases considerably to ~1 500–2 000 m since the Middle Miocene (Fig. 5b).

|
The decompacted sedimentation rates and the calculated unloaded tectonic subsidence are shown in Figs. 6 & 7, respectively. Moreover, the 10 pseudo-wells along Line 1 (Figs. 1 & 4) were also chosen to conduct the detailed subsidence analysis (Fig. 8).

|
| Fig.6 The decompacted sedimentation rates during different periods a. during 45-23 Ma along Line 1 (see location in Fig. 1b); b. during 23-0 Ma. In the Zengmu Basin, the sedimentation rate is ~50-250 m/Ma during 40.4-5.2 Ma, ~50-500 m/Ma in 5.2-1.8 Ma, and ~50-100 m/Ma in 1.8-0 Ma. In the Beikang Basin, the sedimentation rate is ~100-400 m/Ma during 45-23 Ma, ~0 m/Ma in 23-16.4 Ma, and ~50-200 m/Ma in 16.4-0 Ma. |

|
| Fig.7 The unloaded tectonic subsidence rate along Line 1 (see location in Fig. 1b) during different periods a. during 45-30 Ma; b. during 30-16.4 Ma; c. during 16.4-0 Ma. The Zengmu Basin has two stages of subsidence. The subsidence rate is high of ~50-90 m/Ma in 40.4-30 Ma and slow of ~20 m/Ma in 30-0 Ma except the 5.2-1.8 Ma during which the subsidence rate is ~20-100 m/Ma. The Beikang Basin shows three stages of subsidence, the subsidence rate is high of ~50-150 m/Ma in 45-30 Ma, declines to -20 m/Ma in 30-16.4 Ma and increases to 70-110 m/Ma in 16.4-0 Ma. |

|
| Fig.8 The backstripped unloaded subsidence (solid line) and the modelled subsidence (dashed line) for 10 pseudo-wells (see locations in Figs. 1 & 4) with the vertical bars showing the water depth uncertainty, the predicted surface heat flow, and the fault growth rate in each basin a. Zengmu Basin; b. Beikang Basin; c. the predicted surface heat flow in Zengmu Basin is ~50 mW/m2, much less than that observed of ~100 mW/m2 (Fig. 2c); d. the predicted surface heat flow in the Beikang Basin is ~60 mW/m2, close to that observed (Fig. 2c); e. faults growth rates of F1–F5 and the maximum value of the vertical axis is 80 m/Ma; f. faults growth rates of F6–F11 and the maximum value of the vertical axis is 320 m/Ma. |
The 1-D uniform basin- and lithosphere-scale coupled finite extension model, modified from previous studies (Jarvis and McKenzie, 1980; White, 1994; Rupke et al., 2008; Theissen and Rupke, 2010; Zhao, 2021), is used herein to predict the tectonic subsidence and heat flow for the pseudo-wells (Eqs.5–9, Fig. 8).
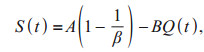 (5)
(5) (6)
(6) (7)
(7) (8)
(8) (9)
(9)where S(t) is unloaded tectonic subsidence, t is time, β is extension factor, tc is crustal thickness, α is thermal expansion coefficient, ρc and ρm are crust and mantle density at 0 ℃, ρa is the asthenosphere density at 1 333 ℃; Q(t) is a measure of the difference between the perturbed and equilibrium temperature structure; A, B, and Q(t) can be calculated with Eqs.6–8, respectively. q is heat flow, k is thermal conductivity, T is temperature of lithosphere, z is lithosphere thickness that is initially set to be 110 km (Tang et al., 2014). Here, T(z, t) is the temperature of the lithosphere as a function of depth and time, T(z, ∝) is the equilibrium temperature structure of the lithosphere. The initial temperature is set to increase linearly from top (0 ℃) to bottom (1 333 ℃). Other parameter values used here see Table 2 in Zhao (2021).
The syn-rift average strain rate G is obtained from the whole crustal extension factor βwc (Fig. 9) with Eq.10, where Δt is the time duration of the synrift period (45–16.4 Ma). In the post-rift period, the average strain rate G is set zero.
 (10)
(10)

|
| Fig.9 The faults-derived extension factors and the whole crustal extension factors along Line 1 (see location in Fig. 1b) |
The whole crustal extension factor (Fig. 9) is the ratio of the initial crustal thickness (assumed to be 32 km) (Nissen et al., 1995; Hayes and Nissen, 2005) to the present crustal thickness (Fig. 4c), the part between the sedimentary basement (Fig. 4b) and the gravity inversed Moho (Lei et al., 2016). Considering the thermal effect of the sediment on the basement subsidence and the heat flux, the sedimentation rates of each stage (Fig. 6) are also coupled into the finite extension model, which can simultaneously resolve the basin-scale processes (deposition, compaction, stretching, and heat transfer) and the lithosphere-scale processes (stretching, heat transfer, and local isostatic response).
3.5 Fault analysesA total of 95 basement faults are interpreted from the 50 seismic lines (Fig. 1). The length and strike of the faults in Zengmu and Beikang Basins are analyzed, respectively (Fig. 1c & d). Along Line 1, there are 11 large normal basement faults (Fig. 4). The growth rates of the faults are calculated for the six phases (45–40.4, 40.4–30, 30–23, 23–16.4, 16.4–5.2, and 5.2–1.8 Ma) using Eq.11, with the results illustrated in Fig. 8e and f for the Zengmu and the Beikang Basins, respectively.
 (11)
(11)where Hhangingwall and Hfootwall are the strata thickness of the haningwall and footwall, respectively, ΔH is the difference between them, and Δt is the time interval of each strata.
Furthermore, the faults derived extension factors βf along Line 1 (Fig. 9) were calculated with Eqs.12–13 using the horizontal offsets of the 11 basement faults (Fig. 4) (Davis and Kusznir, 2004).
 (12)
(12) (13)
(13)where E is fault horizontal extension, x is the coordinate, and W is the fault deformation width (75 km). The coefficient c in Eq.13 can be determined numerically by substituting Eq.13 into Eq.12.
4 RESULT 4.1 Basin structures in the Zengmu and Beikang BasinsThe Zengmu and Beikang Basins show different seafloor topography along Line 1 (Figs. 1b & 4). The Zengmu Basin is in shallow water less than ~200 m in depth, while the Beikang Basin is in deep water with the water depth ranging from ~200 to 2 000 m. In Line 1, the Cenozoic sediment accumulated in the two basins reaches ~3 to 7 km thick (Fig. 4). Detailed stratigraphic analysis further shows that the lower sedimentary layer (45–16.4 Ma) in the Beikang Basin is significantly thicker than the upper part (16.4–0 Ma), yet the Zengmu Basin has no such difference (Fig. 4). The gravity inversed Moho shoals from ~29 km in the Zengmu Basin to ~22 km in the Beikang Basin (Lei et al., 2016) (Fig. 4c). Thus, the crustal thickness between the sedimentary basement and the Moho decreases from ~28–23 km in the Zengmu Basin to ~20–14 km in the Beikang Basin (Fig. 4c).
The two basins also show considerably different structures across the WBL (Fig. 4). In the Zengmu Basin, only faults F1–F3 are identified cutting into the basement (Fig. 4). Faults F1–F3 have small offsets with horizontal displacement of ~1.7, 1.2, and 4.2 km, respectively (Fig. 4). Although the faults remain active from the Late Eocene to the Late Miocene (40.4–5.2 Ma, Figs. 4 & 8e), they are only located at the edge of the basin. Moreover, they are too weak with the faults growth rates of less than ~55 m/Ma (Fig. 8e) to thin the crust or control the strongly synformal geometry of the basin (Fig. 4). In the Zengmu Basin, the Late Eocene to Late Miocene (40.4–5.2 Ma) strata are obviously folded, but only strata in the Middle to Late Miocene are remarkably thickened (16.4–5.2 Ma, Fig. 4). Since the Pliocene (~5.2–0 Ma), sediments progressed northwards to form the shelf-slope topography (Fig. 4). In the Beikang Basin, however, large normal faults (F8–F11) are developed to thin the basement and form a series of tilted fault blocks and half grabens (Fig. 4). These faults are north dipping with planar or listirc geometry (Fig. 4). The horizontal offsets of faults F8 to F11 are ~10 km, 5.7 km, 22.9 km, and 10.4 km, respectively (Fig. 4), and the average faults growth rates are ~150–300 m/Ma (Fig. 8f). The faults remain active in the Late Eocene to the Middle Miocene (45–16.4 Ma) and ceased activity against the 16.4 Ma unconformity (Fig. 4). Below the unconformity, the sediment is ~6 km thick and focused in the half grabens (Fig. 4). Most of the strata in the Early Miocene (23–16.4 Ma) are missing (Fig. 4). The strata in the Late Oligocene (~30–23 Ma) in the hangingwall of fault F10 are obviously folded and thickened (Fig. 4). The oldest Middle Eocene (45–40.4 Ma) strata are sporadically distributed in the Beikang Basin, but not found in the Zengmu Basin (Fig. 4).
The basement faults in the study area mainly trend NE-SW and NNW-SSE (Fig. 1). Specifically, the NNW-SSE trending faults predominately occur in the Zengmu Basin to the SW of the WBL with an average length of ~80 km (Fig. 1c). In the Beikang Basin, however, the faults trend dominantly NE-SW with an average length of ~50 km (Fig. 1d).
4.2 West Baram LineThe West Baram Line separating the Zengmu and Beikang Basins has a complex structure (Fig. 10). From NW to SE, the West Baram Line is less developed along Line 3 (Fig. 10d) (Clift et al., 2008), and shows minus flower structures along line 5 (Fig. 10b). Along Line 1, it is a fault zone comprising F4 to F7, which are located beneath the shelf slope break and active from the Late Eocene to the Pliocene with horizontal offsets of ~5.1, 3.1, 4, and 2.9 km, respectively (Figs. 4, 8, & 10a). Along Line 2, the West Baram Line consists of a series of tilted faults, but ceased activities in the Early Miocene (Fig. 10c) (Cullen, 2014).

|
| Fig.10 Detailed structures of the West Baram Line a. the seismic profile along Line 1 (see the black box in Fig. 4a); b. Line 5 across the Baram Line (see its location in Fig. 1b); c. Line 2 modified from Cullen (2014) (see its location in Fig. 1b); d. Line 3 modified from Clift et al. (2008) (see its location in Fig. 1b). The horizontal scale bar is placed on top of Fig. 10d. "Diapir?" in (a) denotes mud diapirs explained from seismic reflection features, not confirmed by drilling; "Lupar line?" in (d) denotes inferred location of the Lupar Line. |
Along Line 1, the decompacted sedimentation rate in the Zengmu Basin is ~50–250 m/Ma in 40.4–5.2 Ma, ~50–500 m/Ma in 5.2–1.8 Ma, and ~50–100 m/Ma in 1.8–0 Ma (Fig. 6). In the Beikang Basin, sedimentation rate is ~100–400 m/Ma in 45–23 Ma in isolated sub-basins, non-deposition in 23–16.4 Ma, and ~50–200 m/Ma in 16.4–0 Ma (Fig. 6).
The tectonic subsidence curve along Line 1 (Fig. 7) and at the 10 pseudo wells (Fig. 8a–b) show different patterns between the Zengmu and Beikang Basins. There are two stages of tectonic subsidence in the Zengmu Basin (Figs. 7 & 8a). A fast subsidence rate of ~50–90 m/Ma occurred in 40.4–30 Ma and a slow rate of ~20 m/Ma occurred in 30–0 Ma except the period of 5.2–1.8 Ma during which the subsidence rate increased to ~20–100 m/Ma (Figs. 7–9a). Furthermore, the basement subsidence gradually increases from south to north along Line 1 (Fig. 7), and increases from P1 to P5 as the location of the pseudo wells get closer to the WBL (Fig. 8a). Different from Zengmu Basin, there are three stages of tectonic subsidence in the Beikang Basin (Figs. 7 & 8b). In the isolated sub-basins, the subsidence rate started with ~50–150 m/Ma in isolated sub-basins in 45–30 Ma, then the basement uplifted at a rate of ~20 m/Ma in 30–16.4 Ma, and subsequently the subsidence rate increased to ~70–110 m/Ma in 16.4–0 Ma.
The crustal extension factors were also calculated according to the crustal thickness variation (Fig. 9), on basis of which, the modelled tectonic subsidence at the 10 pseudo-wells are ~600–900 m less than the backstripped result in both the Zengmu and Beikang Basins (Fig. 8a & b).
4.4 Modeled and observed heat flowThe heat flow of the Zengmu Basin was as high as ~80–150 mW/m2, and increased southwestwards from the WBL to the Lupar Line (Fig. 2c) (He et al., 2001). In the Beikang Basin, the heat flow is ~50–100 mW/m2 and rises significantly toward the WBL (Fig. 2c) (He et al., 2001). For P1 to P5 in the Zengmu Basin, the observed heat flow is between 80 and 100 mW/m2 (Fig. 4). However, the predicted value on the basis of the crustal thinning is only ~50 mW/m2 (Fig. 8c). For P6 to P10 in the Beikang Basin, the observed value of heat flow is 50–70 mW/m2 (Fig. 2c), which is much close to the modelled value of ~60 mW/m2 (Fig. 8d).
4.5 Strain accommodation within the crustThe extension factors of the brittle upper crust calculated from the measured fault offsets are generally less than that of the whole crust along Line 1 (Fig. 9). The extension factors, calculated based on the horizontal offsets of the 11 basement faults along Line 1 (Fig. 4) are ~1–1.2 in the Zengmu Basin and ~1.2–1.5 in the Beikang Basin (Fig. 9). The whole crustal extension factors, obtained by the crustal thickness variation, are ~1.2–1.5 in the Zengmu Basin and ~1.5–2.4 in the Beikang Basin (Fig. 9).
As the ~40% subseismic faulting (Walsh et al., 1991) is added to the measured faults offsets to calculate the extension factors, it is shown that the extension factors derived from the faults offsets are pretty close to the whole crustal extension factors (Fig. 9). Only at the distance of 300–450 km along the line, the extension factors derived from the faults offsets are smaller than the whole crustal extension factors (Fig. 9), showing the continental extension (thinning) discrepancy. The continental extension discrepancy was widely revealed in the SCS conjugated margins, such as the Qiongdongann Basin (Zhao et al., 2018a), the Zhujiang (Pearl) River Mouth basin (Clift et al., 2002; Davis and Kusznir, 2004) in the northern SCS margin, and the Liyue basin and the Dangerous Grounds in the southern SCS margin (Clift et al., 2002; Ding and Li, 2011), which probably indicate the preferential lower crustal extension due to lower crustal flow (Clift et al., 2002; Zhao et al., 2018a; Deng et al., 2020).
5 DISCUSSION 5.1 Nature of the West Baram LineThe term "Line" in the Borneo's geology is used to denote linear zone across which structure and/or stratigraphy change significantly but lack a clear explanation (Cullen, 2014). The WBL separates the Zengmu Basin from the Beikang Basin, and marks an abrupt change in bathymetry, hydrocarbon system, structures, heat flow, gravity, and magnetic anomaly (Fig. 2). However, its nature is still unclear. It was proposed as a dextral transform fault during the Eocene to Early Miocene on basis of seismic interpretation in the NW part of the WBL (e.g., Line 3 in Fig. 1) (Clift et al., 2008). However, only few small faults are imaged along line 3, which is difficult to define the nature of the WBL (Fig. 10d). Alternatively, it was suggested that the WBL comprises a series of simple normal faults active in the Eocene to Early Miocene along Line 2 in the SE part of the WBL (Fig. 10c) (Cullen, 2014). In the middle part of the WBL, minus flower structures along Line 5 (Fig. 10b) and a fault zone comprising a series of extensional faults (F4–F7) along Line 1 (Fig. 10a) are revealed, which are principally active in the Late Eocene to Early Miocene. Thus, the structural features of the above seismic lines infer that the WBL is probably a trans-extensional fault zone mainly active in the Eocene to Early Miocene (Fig. 10). In the plain view map (Fig. 1), the acute angles between the strikes of the faults and the WBL indicate that the WBL has a feature of dextral strikeslip.
5.2 Formation of the Zengmu BasinThe Zengmu Basin is located between the WBL and the Lupar Line, where the dominant faults trend in the direction of NW-SE (Fig. 1c). However, the origin of the Zengmu Basin remains debated, which was suggested to be a Neogene trans-extensional basin (Zhong et al., 1994), a foreland basin (Madon et al., 2013), firstly a foreland basin and later influenced by the strike-slip faults (Wu, 1997), or several superposed basins including the rift subbasin, peripheral foreland sub-basin, and passive continental margin sub-basin from bottom to top (Xu et al., 2020). Here along the Line 1, the overall synformal basin geometry, the thick folded sediment in the Late Eocene to Late Miocene (40.4–5.2 Ma) (Fig. 4), and pretty few and weak faults only at the basin edge (Figs. 4 & 9e) infer that the Zengmu Basin is probably a foreland basin under a strong compression. Moreover, the basin has a fast subsidence in the late Eocene-Early Oligocene (40.4–30 Ma), and a slow subsidence since the late Oligocene (30–0 Ma) (Figs. 7 & 8a). Although the fast–slow subsidence pattern is usually an indicator of a rift basin (McKenzie, 1978; Jarvis and McKenzie, 1980), the modeled subsidence based on the crustal thinning is far less than that backstripped (Fig. 8a), and the molded surface heat flow of ~50 mW/m2 (Fig. 8c), based on the uniform lithospheric stretching model, is also significantly less than that observed of ~100 mW/m2 (Fig. 2c), showing that the basin subsidence and heat flow are unable to be explained by assuming that the Zengmu Basin is formed through rifting alone. In the onland Sarawak, a major collision event has been recorded between the Luconia and the SW Borneo in the Eocene (Holloway, 1982; Hutchison, 1996; Madon et al., 2013), which probably be the main cause for the synformal geometry and the folded strata in the Zengmu Basin. As the paleo-SCS closed in the Late Eocene and the collision started between the Loconia block and the Borneo in the Sarawak region, the Zengmu Basin begun to bend flexurally downward under the fold-thrust load to cause a period of initial rapid subsidence in the Late Eocene to the Early Oligocene (Figs. 7 & 8a). Then the subsequent slow subsidence since the Late Oligocene (Figs. 7 & 8a) probably reflects the weakening terrane collision.
Furthermore, the tectonic subsidence along Line 1 increases toward the WBL (Figs. 7 & 8a). This is consistent with crust thickness variation, which also thins toward the WBL from ~28 to 23 km (Fig. 4c) (Lei et al., 2016), implying that the crustal thinning and the subsidence increasing are linked with the WBL.
5.3 Formation of the Beikang BasinThe Beikang Basin is previously considered as a rift basin (Liu and Guo, 2003; Madon et al., 2013), but the results of this study show that the basin is also influenced by the subduction of the Paleo-SCS and the collision between the Dangerous Grounds and the Borneo in the Sabah region to the east of the WBL. In the Beikang Basin, a series of large normal faults trend in the NE-SW direction, consistent with the regional extensional stress (Figs. 1 & 4). Along Line 1, the faults (F8–F11) have penetrated the basement to thin the crust and yield the half-grabens and faulted blocks (Fig. 4). Most of these faults ceased activities at ~16.4 Ma, generating a prominent Miocene unconformity (Fig. 4), as shown by previous studies (Hutchison, 2004; Cullen et al., 2010; Madon et al., 2013). The unconformity has divided the basin into two structural layers (Fig. 4) (Sun et al., 2011a; Zhao et al., 2011). The lower layer (45–16.4 Ma) consists of faulted blocks and half grabens, where the accumulated sediment has a rotated wedge or parallel shape (Fig. 4). The upper layer (16.4–0 Ma) is less deformed with the subparallel sequences directly draping over the underlying faulted structures (Fig. 4). On basis of the continental stretching model, the predicted heat flow of ~60 mW/m2 (Fig. 8d) is also consistent with that observed (Fig. 2c). Thus, these features clearly show that the Beikang Basin is a rift basin (Fig. 4).
However, unlike a classic rift model, the Beikang Basin shows three stages of subsidence: a fast subsidence in the Middle Eocene to the Early Oligocene (45–30 Ma), a remarkable uplift in the Late Oligocene to the Early Miocene (30–16.4 Ma), and then a fast subsidence since the Middle Miocene (16.4–0 Ma) (Figs. 7 & 8b). It was previously suggested that a high subsidence occurred in the Late Oligocene to Early Miocene, and an uplift in the Middle Miocene (Madon et al., 2013), however, it is inconsistent with the depositional environment that changed from marine in the Late Oligocene to coastal plain in the Early Miocene (Madon et al., 2013; Lei et al., 2020). The seismic data also reveals a significant unconformity and strata partly missing in the Early Miocene, and strata folded in the Late Oligocene in the hangingwall of fault F10 (Fig. 4). The fast-slow-fast subsidence pattern in the Beikang Basin is also found in other basins in the SCS region, including the Qiongdongnan Basin in the northern SCS margin (Xie et al., 2006; Zhao et al., 2018b), and the Liyue Basin in the southern SCS margin (Ding et al., 2015; Fang et al., 2017; Pei et al., 2020). In these basins, the slow subsidence or uplift all occurred in the early post-rift period and was usually explained to be caused by the asthenospheric upwelling and the secondary mantle convection related to seafloor spreading (Ding et al., 2015; Fang et al., 2017; Zhao et al., 2018b; Pei et al., 2020). However, in the Beikang Basin, the basement uplift occurred in the Late Oligocene to the Early Miocene (30–16.4 Ma), which is still in the syn-rift period under continental rifting (Figs. 7 & 8b). Numerical modelling argued that the west and middle parts of the southern SCS margin have experienced flexural deflection since the Eocene with the highest forebulge occurring at ~16 Ma due to the subduction of the Paleo-SCS and the collision between the Dangerous Grounds and the Borneo (Sun et al., 2011a; Zhao et al., 2011). In the Beikang Basin, the flexural forebulge occurred since the Oligocene, and migrated away after the Middle Miocene (Sun et al., 2011a). The spatial variation of the forebulge in the Beikang Basin probably play an important role in producing the concomitant intense faulting, basement uplift, folded and eroded strata in the Late Oligocene to Early Miocene (Figs. 4, 7, & 8) and the fast subsidence since the Middle Miocene along Line 1 (Figs. 7 & 8b). Moreover, the predicted total subsidence on basis of the crustal thinning is considerably less than that backstripped (Fig. 8b), which is also different from the Qiongdongnan and Liyue Basins where the predicted and backstripped subsidence are close to each other (Zhao et al., 2018a; Pei et al., 2020). It is inferred that the Beikang Basin is now under flexural depression owing to the terrain collision between the Dangerous Grounds and the NW Borneo in the Sabah region.
6 CONCLUSIONThe WBL is probably a trans-extensional fault zone consisting of the normal faults and flower structures mainly active in the Late Eocene to Early Miocene. The acute angles between the strikes of the faults and the WBL infer the dextral strike-slip of the WBL.
To the SW of the WBL, the Zengmu Basin has an overall synformal geometry, widely folded strata in the Late Eocene to Late Miocene (40.4–5.2 Ma), but only few small normal faults at the basin edge. The basin has a fast subsidence in the Late Eocene-Early Oligocene (40.4–30 Ma) and a slow subsidence since the Late Oligocene (30–0 Ma). However, the modeled subsidence and heat flow on basis of crustal thinning are both less than that observed. These features suggest that the Zengmu Basin along Line 1 cannot be explained purely by extension, but probably be a foreland basin under the terrain collision between the Luconia and the SW Borneo in the Sarawak region since the Eocene.
To the NE of the WBL, the Beikang Basin is mostly a rift basin. A series of NE-SW trending normal faults formed with large offset and strong activity. The faults ceased activity against the ~16.4 Ma unconformity, which divides the basin into the lower layer of the syn-rift faulted blocks and grabens (45–16.4 Ma) and the upper layer of the post-rift less deformed sequences (16.4–0 Ma). On basis of continental stretching model, the predicted heat flow of ~60 mW/m2 is consistent with that observed. But unlike a classic rift model, the basin has a three-stage subsidence pattern including a fast subsidence in the Middle Eocene to the Early Oligocene (45–30 Ma), a marked uplift in the Late Oligocene to Early Miocene (30–16.4 Ma), and a fast subsidence since the Middle Miocene (16.4–0 Ma). During the uplift stage, the Late Oligocene strata are partly folded and the Early Miocene strata are partly eroded. Combined with previous study, the basin formation in the uplift stage (30–16.4 Ma) is inferred to be also affected by the flexural bulging under the Paleo-South China Sea subduction and the collision between the Dangerous Grounds and the Borneo in the Sabah region to the east of the WBL. Furthermore, the predicted total subsidence on basis of crustal thinning is considerably less than the backstripped result, implying that the basin is now under flexural depression.
7 DATA AVAILABILITY STATEMENTAll data generated and/or analyzed during this study are available from the corresponding author upon reasonable request.
8 ACKNOWLEDGMENTThank Editor in Chief and the anonymous reviewers for the valuable and constructive comments to improve the manuscript.
Athy L F. 1930. Density, porosity, and compaction of sedimentary rocks. AAPG Bulletin, 14(1): 1-24.
|
Briais A, Patriat P, Tapponnier P. 1993. Updated interpretation of magnetic anomalies and seafloor spreading stages in the South China Sea: implications for the Tertiary tectonics of Southeast Asia. Journal of Geophysical Research, 98(B4): 6299-6328.
DOI:10.1029/92JB02280 |
Clift P, Lee G H, Duc N A, et al. 2008. Seismic reflection evidence for a Dangerous Grounds miniplate: no extrusion origin for the South China Sea. Tectonics, 27(3): TC3008.
|
Clift P, Lin J, Barckhausen U. 2002. Evidence of low flexural rigidity and low viscosity lower continental crust during continental break-up in the South China Sea. Marine and Petroleum Geology, 19(8): 951-970.
DOI:10.1016/S0264-8172(02)00108-3 |
Cullen A. 2014. Nature and significance of the West Baram and Tinjar Lines, NW Borneo. Marine and Petroleum Geology, 51: 197-209.
DOI:10.1016/j.marpetgeo.2013.11.010 |
Cullen A, Reemst P, Henstra G, et al. 2010. Rifting of the South China Sea: new perspectives. Petroleum Geoscience, 16(3): 273-282.
DOI:10.1144/1354-079309-908 |
Cullen A B. 2010. Transverse segmentation of the BaramBalabac Basin, NW Borneo: refining the model of Borneo's tectonic evolution. Petroleum Geoscience, 16(1): 3-29.
DOI:10.1144/1354-079309-828 |
Davis M, Kusznir N J. 2004. Depth-dependent lithospheric stretching at rifted continental margins. In: Proceedings of NSF Rifted Margins Theoretical Institute. Columbia University Press, Colnmbia. p. 92-137.
|
Deng H D, Ren J Y, Pang X, et al. 2020. South China Sea documents the transition from wide continental rift to continental break up. Nature Communications, 11(1): 4583.
DOI:10.1038/s41467-020-18448-y |
Ding W W, Li J B. 2011. Seismic stratigraphy, tectonic structure and extension factors across the southern margin of the South China Sea: evidence from two regional multi-channel seismic profiles. Chinese Journal of Geophysics, 54(12): 3038-3056.
(in Chinese with English abstract) DOI:10.3969/j.issn.0001-5733.2011.12.006 |
Ding W W, Li J B, Dong C Z, et al. 2015. Oligocene-miocene carbonates in the reed bank area, South China Sea, and their tectono-sedimentary evolution. Marine Geophysical Research, 36(2-3): 149-165.
DOI:10.1007/s11001-014-9237-5 |
Ding W W, Sun Z, Dadd K, et al. 2018. Structures within the oceanic crust of the central South China Sea basin and their implications for oceanic accretionary processes. Earth and Planetary Science Letters, 488: 115-125.
DOI:10.1016/j.epsl.2018.02.011 |
Fang P G, Ding W W, Fang Y X, et al. 2017. Cenozoic tectonic subsidence in the southern continental margin, South China Sea. Frontiers of Earth Science, 11(2): 427-441.
DOI:10.1007/s11707-016-0594-z |
Franke D, Savva D, Pubellier M, et al. 2014. The final rifting evolution in the South China Sea. Marine and Petroleum Geology, 58: 704-720.
DOI:10.1016/j.marpetgeo.2013.11.020 |
Fui H K. 1978. Stratigraphic framework for oil exploration in Sarawak. Bulletin of the Geological Society of Malaysia, 10: 1-13.
DOI:10.7186/bgsm10197801 |
Guo J, Xie X J, Liu S X, et al. 2016. Cenozoic sedimentary systems in Zengmu Basin, South China Sea. China Petroleum Exploration, 21(4): 99-107.
(in Chinese with English abstract) DOI:10.3969/j.issn.1672-7703.2016.04.0011 |
Hall R. 2002. Cenozoic geological and plate tectonic evolution of SE Asia and the SW Pacific: computerbased reconstructions, model and animations. Journal of Asian Earth Sciences, 20(4): 353-431.
DOI:10.1016/S1367-9120(01)00069-4 |
Haq B U, Hardenbol J, Vail P R. 1987. Chronology of fluctuating sea levels since the Triassic. Science, 235(4793): 1156-1167.
DOI:10.1126/science.235.4793.1156 |
Hayes D E, Nissen S S. 2005. The South China Sea margins: implications for rifting contrasts. Earth and Planetary Science Letters, 237(3-4): 601-616.
DOI:10.1016/j.epsl.2005.06.017 |
Hazebroek H P, Tan D N K. 1993. Tertiary tectonic evolution of the NW Sabah continental margin. Bulletin of the Geological Society of Malaysia, 33: 195-210.
DOI:10.7186/bgsm33199315 |
He L J, Wang K L, Xiong L P, et al. 2001. Heat flow and thermal history of the South China Sea. Physics of the Earth and Planetary Interiors, 126(3-4): 211-220.
DOI:10.1016/S0031-9201(01)00256-4 |
Hinz K, Fritsch J, Kempter E H K, et al. 1989. Thrust tectonics along the north-western continental margin of Sabah/Borneo. Geologische Rundschau, 78(3): 705-730.
DOI:10.1007/BF01829317 |
Holloway N H. 1982. North Palawan Block, Philippines—its relation to Asian mainland and role in evolution of South China Sea. AAPG Bulletin, 66(9): 1355-1383.
|
Hutchison C S. 1996. The 'Rajang accretionary prism' and 'lupar line' problem of Borneo. In: Hall R, Blundell D eds. Tectonic Evolution of Southeast Asia. AAPG Bookstore, London. p. 247-261.
|
Hutchison C S. 2004. Marginal basin evolution: the southern South China Sea. Marine and Petroleum Geology, 21(9): 1129-1148.
DOI:10.1016/j.marpetgeo.2004.07.002 |
Hutchison C S. 2014. South China Sea carbonate build-up seismic characteristics. Bulletin of the Geological Society of Malaysia, 60: 19-26.
DOI:10.7186/bgsm60201402 |
Hutchison C S, Bergman C S, Swauger D A, et al. 2000. A Miocene collisional belt in north Borneo: uplift mechanism and isostatic adjustment quantified by thermochronology. Journal of the Geological Society, 157(4): 783-793.
DOI:10.1144/jgs.157.4.783 |
Jarvis G T, McKenzie D P. 1980. Sedimentary basin formation with finite extension rates. Earth and Planetary Science Letters, 48(1): 42-52.
DOI:10.1016/0012-821X(80)90168-5 |
Krebs W N. 2011. Upper Tertiary chronosequence stratigraphy of offshore Sabah and Sarawak, NW Borneo, Malaysia: a unified scheme based on graphic correlation. Bulletin of the Geological Society of Malaysia, 57(57): 39-46.
|
Kudrass H R, Wiedicke M, Cepek P, et al. 1986. Mesozoic and Cainozoic rocks dredged from the South China Sea (Reed Bank area) and Sulu Sea and their significance for plate-tectonic reconstructions. Marine and Petroleum Geology, 3(1): 19-30.
DOI:10.1016/0264-8172(86)90053-X |
Lei J P, Jiang S H, Li S Z, et al. 2016. Gravity anomaly in the southern South China Sea: a connection of Moho depth to the nature of the sedimentary basins' crust. Geological Journal, 51(51): 244-262.
|
Lei Z Y, Zhang L, Wang L Z, et al. 2020. Provenance migration in the Beikang Basin of the southern South China Sea during the Oligocene to the Mid-Miocene. Earth Science, 45(5): 1855-1864.
(in Chinese with English abstract) |
Li C F, Lin J, Kulhanek D K et al. 2015. Proceedings of the International Ocean Discovery Program, 349: South China Sea Tectonics: College Station, TX (International Ocean Discovery Program), https://doi.org/10.14379/iodp.proc.349.2015.
|
Li C F, Xu X, Lin J, et al. 2014. Ages and magnetic structures of the South China Sea constrained by deep tow magnetic surveys and IODP Expedition 349. Geochemistry, Geophysics, Geosystems, 15(12): 4958-4983.
DOI:10.1002/2014GC005567 |
Li C F, Zhou Z Y, Li J B, et al. 2008. Magnetic zoning and seismic structure of the South China Sea ocean basin. Marine Geophysical Researches, 29(4): 223-238.
DOI:10.1007/s11001-008-9059-4 |
Liu Z H, Guo L H. 2003. Subsidene and tectonic evolution of the Beikang basin, the South China Sea. Marine geology & Quaternary Geology, 23(2): 51-57.
(in Chinese with English abstract) |
Madon M, Kim C L, Wong R. 2013. The structure and stratigraphy of deepwater Sarawak, Malaysia: implications for tectonic evolution. Journal of Asian Earth Sciences, 76: 312-333.
DOI:10.1016/j.jseaes.2013.04.040 |
Mat-Zin I C, Tucker M E. 1999. An alternative stratigraphic scheme for the Sarawak Basin. Journal of Asian Earth Sciences, 17(1-2): 215-232.
DOI:10.1016/S0743-9547(98)00042-7 |
Maus S, Barckhausen U, Berkenbosch H, et al. 2009. EMAG2: a 2-arc min resolution Earth Magnetic Anomaly Grid compiled from satellite, airborne, and marine magnetic measurements. Geochemistry, Geophysics, Geosystems, 10(8): Q08005.
|
McKenzie D. 1978. Some remarks on the development of sedimentary basins. Earth and Planetary Science Letters, 40(1): 25-32.
DOI:10.1016/0012-821X(78)90071-7 |
Mohammad A M, Wong R H F. 1995. Seismic sequence stratigraphy of the Tertiary sediments, offshore Sarawak deepwater area, Malaysia. Bulletin of the Geological Society of Malaysia, 37: 345-361.
DOI:10.7186/bgsm37199526 |
Morley C K. 2002. A tectonic model for the tertiary evolution of strike-slip faults and rift basins in SE Asia. Tectonophysics, 347(4): 189-215.
DOI:10.1016/S0040-1951(02)00061-6 |
Nissen S S, Hayes D E, Yao B C, et al. 1995. Gravity, heat flow, and seismic constraints on the processes of crustal extension: Northern margin of the South China Sea. Journal of Geophysical Research: Solid Earth, 100(B11): 22447-22483.
DOI:10.1029/95JB01868 |
Pei J X, Shi X B, Wang L F, et al. 2020. Tectonic subsidence and its mechanism of the Liyue Basin, South China Sea. Marine Geology & Quaternary Geology, 40(4): 17-29.
(in Chinese with English abstract) |
Ru K, Pigott J D. 1986. Episodic rifting and subsidence in the South China Sea. AAPG Bulletin, 70(9): 1136-1155.
|
Rupke L H, Schmalholz S M, Schmid D W, et al. 2008. Automated thermotectonostratigraphic basin reconstruction: Viking Graben case study. AAPG Bulletin, 92(3): 309-326.
DOI:10.1306/11140707009 |
Sandwell D T, Muller R D, Smith W H F, et al. 2014. New global marine gravity model from CryoSat-2 and Jason- 1 reveals buried tectonic structure. Science, 346(6205): 65-67.
DOI:10.1126/science.1258213 |
Schlüter H U, Hinz K, Block M. 1996. Tectono-stratigraphic terranes and detachment faulting of the South China Sea and Sulu Sea. Marine Geology, 130(1-2): 39-51, 58-78.
DOI:10.1016/0025-3227(95)00137-9 |
Sclater J G, Christie P A F. 1980. Continental stretching: an explanation of the post-Mid-Cretaceous subsidence of the Central North Sea Basin. Journal of Geophysical Research, 85(B7): 3711-3739.
DOI:10.1029/JB085iB07p03711 |
Sibuet J C, Yeh Y C, Lee C S. 2016. Geodynamics of the South China Sea. Tectonophysics, 692: 98-119.
DOI:10.1016/j.tecto.2016.02.022 |
Steckler M S, Watts A B. 1978. Subsidence of the atlantictype continental margin off New York. Earth and Planetary Science Letters, 41(1): 1-13.
DOI:10.1016/0012-821X(78)90036-5 |
Su D Q, White N, McKenzie D. 1989. Extension and subsidence of the Pearl River Mouth Basin, northern South China Sea. Basin Research, 2(4): 205-222.
DOI:10.1111/j.1365-2117.1989.tb00036.x |
Sun Z, Stock J, Klaus A. 2018. International Ocean Discovery Program Expedition 367 Preliminary Report. IODP.
|
Sun Z, Sun L T, Zhou D, et al. 2009. Discussion on the South China Sea evolution and lithospheric breakup through 3D analogue modeling. Earth Science—Journal of China University of Geosciences, 34(3): 435-447.
(in Chinese with English abstract) DOI:10.3799/dqkx.2009.049 |
Sun Z, Zhao Z X, Li J B, et al. 2011a. Tectonic analysis of the breakup and collision unconformities in the Nansha. Chinese Journal of Geophysics, 54(12): 3196-3209.
|
Sun Z, Zhao Z X, Zhou D, et al. 2011b. The stratigraphy and the sequence achitecture of the basins in Nansha region. Earth Science—Journal of China University of Geosciences, 36(5): 798-806.
(in Chinese with English abstract) |
Tan D N K, Lamy J M. 1990. Tectonic evolution of the NW Sabah continental margin since the late Eocene. Bulletin of the Geological Society of Malaysia, 27: 241-260.
DOI:10.7186/bgsm27199012 |
Tang X Y, Hu S B, Zhang G C, et al. 2014. Characteristic of surface heat flow in the Pearl River Mouth Basin and its relationship with thermal lithosphere thickness. Chinese Journal of Geophysics, 57(6): 1857-1867.
(in Chinese with English abstract) |
Taylor B, Hayes D E. 1980. The tectonic evolution of the South China Basin. In: Hayes D E ed. The Tectonic and Geologic Evolution of Southeast Asian Seas and Islands. American Geophysical Union, Washington. p. 89-104.
|
Taylor B, Hayes D E. 1983. Origin and history of the South China Sea basin. In: Hayes D E ed. The Tectonic and Geologic Evolution of Southeast Asian Seas and Islands. American Geophysical Union, Washington. p. 23-56.
|
Theissen S, Rupke L H. 2010. Feedbacks of sedimentation on crustal heat flow: new insights from the vøring Basin, Norwegian Sea. Basin Research, 22(6): 976-990.
|
Walsh J, Watterson J, Yielding G. 1991. The importance of small-scale faulting in regional extension. Nature, 351(6325): 391-393.
DOI:10.1038/351391a0 |
Wang L L, Wu N Y, Zhou Z Y, et al. 2002. History of the Cenozoic sedimentary evolution of the Beikang Basin, southwestern South China Sea. Geology in China, 29(1): 96-102.
(in Chinese with English abstract) |
Watts A B, Ryan W B F. 1976. Flexure of the lithosphere and continental margin basins. Tectonophysics, 36(1-3): 25-44.
DOI:10.1016/0040-1951(76)90004-4 |
White N. 1994. An inverse method for determining lithospheric strain rate variation on geological timescales. Earth and Planetary Science Letters, 122(3-4): 351-371.
DOI:10.1016/0012-821X(94)90008-6 |
Wu J M. 1997. The人-type strikeslip fracture system and the convolute structure of Zengmu basin in southwestern South China Sea. Geological Research of South China Sea, 9: 54-66.
(in Chinese with English abstract) |
Xie H, Zhou D, Li Y P, et al. 2014. Cenozoic tectonic subsidence in deepwater sags in the Pearl River Mouth Basin, northern South China Sea. Tectonophysics, 615-616: 182-198.
DOI:10.1016/j.tecto.2014.01.010 |
Xie X N, Müller R D, Li S T, et al. 2006. Origin of anomalous subsidence along the Northern South China Sea margin and its relationship to dynamic topography. Marine and Petroleum Geology, 23(7): 745-765.
DOI:10.1016/j.marpetgeo.2006.03.004 |
Xu J J, Xu H G, Liu D H, et al. 2020. Division, formation and evolution of the prototypes of the Zengmu Basin in Southern South China Sea. South China Geology, 36(3): 221-231.
(in Chinese with English abstract) |
Yan Q S, Shi X F, Liu J H, et al. 2010. Petrology and geochemistry of Mesozoic granitic rocks from the Nansha micro-block, the South China Sea: constraints on the basement nature. Journal of Asian Earth Sciences, 37(2): 130-139.
DOI:10.1016/j.jseaes.2009.08.001 |
Yan W, Zhang G X, Zhang L, et al. 2018. Seismic responses and distribution characteristics of the Miocene carbonate platforms in the Beikang Basin of southern South China Sea. Marine Geology & Quaternary Geology, 38(6): 118-126.
(in Chinese with English abstract) |
Yao Y J, Lü C L, Wang L J, et al. 2018. Tectonic evolution and genetic mechanism of the Wan'an Basin, southern South China Sea. Acta Oceanologica Sinica, 40(5): 62-74.
(in Chinese with English abstract) |
Yao Y J, Yang C P, Li X J, et al. 2013. The seismic reflection characteristics and tectonic significance of the tectonic revolutionary surface of mid-Miocene (T3 seismic interface) in the southern South China Sea. Chinese Journal of Geophysics, 56(4): 1274-1286.
(in Chinese with English abstract) |
Zhao Z X. 2021. The deep mantle upwelling beneath the northwestern South China Sea: insights from the timevarying residual subsidence in the Qiongdongnan Basin. Geoscience Frontiers, 12(6): 101246.
|
Zhao Z X, Sun Z, Chen G H, et al. 2011. Cenozoic structural characteristics and subsidence Evolution in Nansha. Earth Science—Journal of China University of Geosciences, 36(5): 815-822.
|
Zhao Z X, Sun Z, Liu J B, et al. 2018a. The continental extension discrepancy and anomalous subsidence pattern in the western Qiongdongnan Basin, South China Sea. Earth and Planetary Science Letters, 501: 180-191.
|
Zhao Z X, Sun Z, Sun L T, et al. 2018b. Cenozoic tectonic subsidence in the Qiongdongnan Basin, northern South China Sea. Basin Research, 30(S1): 269-288.
|
Zhao Z X, Sun Z, Wang Z F, et al. 2013. The dynamic mechanism of post-rift accelerated subsidence in Qiongdongnan Basin, northern South China Sea. Marine Geophysical Research, 34(3-4): 295-308.
|
Zhao Z X, Sun Z, Wang Z F, et al. 2015. The high resolution sedimentary filling in Qiongdongnan Basin, Northern South China Sea. Marine Geology, 361: 11-24.
|
Zhong J Q, Huang C L, Zhan W H, et al. 1994. Analyses of late cenozoic tectonic subsidence of Zengmu basin in South China Sea. Journal of Oceanography of Huanghai & Bohai Seas, 12(2): 40-46.
(in Chinese with English abstract) |