Institute of Oceanology, Chinese Academy of Sciences
Article Information
- LIU Yingchen, XIA Shaohong, ZHANG Changrong, WANG Xinyang
- Three-dimensional S-wave velocity structure of the upper crust in the Guangdong-Hong Kong-Macao Greater Bay Area: insights into the basins structure and genesis of hot springs
- Journal of Oceanology and Limnology, 41(2): 575-591
- http://dx.doi.org/10.1007/s00343-022-2087-0
Article History
- Received Mar. 1, 2022
- accepted in principle Apr. 26, 2022
- accepted for publication Jun. 30, 2022
2 CAS Key Laboratory of Ocean and Marginal Sea Geology, South China Sea Institute of Oceanology, Chinese Academy of Sciences, Guangzhou 510301, China;
3 University of Chinese Academy of Sciences, Beijing 100049, China
The Guangdong-Hong Kong-Macao Greater Bay Area (GHMGBA) is an important economic and cultural center in South China, with a large population and intensive urbanization (Liu et al., 2020). In recent years, with accelerated urbanization and rapid development of infrastructure, greater demands have been placed on understanding the basic geological environment of the GHMGBA (Huang et al., 2019). It is of great importance to investigate the 3-D geological structures of the GHMGBA underground space to scientifically plan the construction of urban agglomeration and prevent property losses caused by large-scale geological disasters in the GHMGBA (Liu et al., 1994; Zhou et al., 2018; Chen et al., 2021).
The GHMGBA is located in the interaction zone between the South China Block (SCB) and the South China Sea (SCS). Influenced by the subduction of the Paleo-Pacific plate and the Cenozoic rift-spreading of the SCS since the Mesozoic (Zhou and Li, 2000; Zhang and Wang, 2007; Xia and Zhao, 2014; Zhang et al., 2018; Guo et al., 2019), the GHMGBA has experienced strong alternating processes of compression and extension (Yang, 2019). Extensive tectonic compression formed prominent fold belts, and subsequent continental expansion resulted in the upwelling of mantle materials and multiple periods of granitic magmatism (Huang et al., 2020). These processes caused the formation of a series of extensional basins in the study area. In addition, large-scale magmatic activities have made the region have a higher ground heat flow background, creating favourable conditions for the storage of geothermal resources (Wang et al., 2018). Three groups of faults with NE-, NEE-, and NW-trending control and influence the development of the basins and hot springs in the study area (Zhang, 1999; Yuan et al., 2013). Under the influence of dextral strike-slip of NE- and NEE-faults (Li et al., 2017), the main basins in the region experienced multiple clockwise rotations during their formation and evolution, resulting in multiple changes in their depositional centres (Hou et al., 1994). The mechanical properties of the Enping-Xinfeng fault and the Southern piedmont fault of Wugui mountain near the hot springs west of the Zhujiang (Pearl) River estuary (ZRE) are transtensional faults since Neotectonic movements (Yan, 1986; Ren et al., 2005). This is critical for the subsequent upwelling of hot springs fluid.
Numerous studies have been conducted in the GHMGBA and surrounding areas. Previous wide-angle seismic explorations (Zhang and Wang, 2007; Xia et al., 2010; Guo et al., 2019) and receiver function results (Huang et al., 2014, 2020) found that crust thickness of the coastal area decreases towards the sea, and there are high Poisson' s ratio structure characteristics in the crust on the east coast of the ZRE. This suggests that there was an intrusion of late Mesozoic mafic magma on the crust. The 2-D structures of the P-wave velocity on the east and west sides of the ZRE (Zhang et al., 2018; Lv et al., 2020) proved the existence of multiple structural discontinuities and low-velocity anomalies in the crust. Various seismological methods in Guangdong Province have revealed the existence of a low-velocity layer in the mid-crust (Zhao et al., 2004; Zhang et al., 2018; Zhou et al., 2020), which was generally believed to play an important role in regulating the crustal extension pattern in South China. Xia et al. (2012, 2014) discovered the existence of local high-velocity anomalies in the lower crust between Hong Kong and Dangan Island using an onshore-offshore seismic experiment that reflects the intensive basaltic underplating in the island area of Hong Kong. Using ambient noise tomography, Lü et al. (2022) studied the spatial correlation between seismic activity and crustal velocity anomalies in the Zhujiang (Pearl) River Delta and suggested that seismic clusters occur mainly along the NE-trending faults. Lu et al. (2017) and Wang et al. (2018) used hydrochemistry and numerical simulation methods to study the water cycle pattern, depth, and recharge of water sources of hot springs in the west of the ZRE. They suggested that hot spring systems in the coastal areas of Guangdong are mostly dominated by the deep-water cycle model, while recharge water of hot springs is mostly meteoric water and the depth of water cycle is more than 4 km. However, these studies are either limited to 2-D profiles or P-wave structures or focus on the entire crust and large-scale areas, which result in a poor understanding of the detailed 3-D S-wave velocity structure, basin characteristics, and genesis of hot springs in GHMGBA.
The method of ambient noise tomography has unique advantages in urban underground detection. It can obtain underground structures in urban areas but does not depend on earthquakes or active seismic sources (Shapiro et al., 2005). Moreover, observation with a dense array can effectively improve ambient noise tomography resolution (Yao et al., 2006; Lin et al., 2007, 2013; Huang et al., 2010; Li et al., 2016; Yang et al., 2020; Zhu et al., 2021; Xia et al., 2022). In this study, we performed ambient noise tomography using 40-day continuous waveform data from 130 seismic stations to obtain 3-D S-wave velocity structures of the upper crust in GHMGBA. The S-wave velocity structures and overall morphological structures of the main basins in GHMGBA are revealed, and the genetic and deep source structures of hot springs are probed. Furthermore, we briefly discussed the relationship between the development of urban agglomerations and the basic geological environment in the GHMGBA from the perspective of crustal structures.
2 GEOLOGICAL SETTINGThe depth of the Moho in the GHMGBA is between 26 and 32 km and gradually thins seaward. The crustal Poisson' s ratio is less than 0.26 overall, indicating that the GHMGBA crust is dominated by felsic composition (Huang et al., 2020). The study area underwent Caledonian folding orogeny and was strongly influenced by the Indosinian and Yanshanian movements (Yang, 2019). The current tectonic pattern was basically established during the Yanshanian movement (Qiu, 1992). From the early Cretaceous, the SCB underwent a tectonic transition from the Tethys domain to the Pacific domain, and then its tectonic pattern changed from EW to NE (Shu, 2012). The deformation characteristics of the GHMGBA are mainly manifested as fold deformation and fault block differentiation in the adjacent of fault zone (Qiu, 1992; Yao et al., 2013). Orogenies of large fault blocks have intensively changed the geomorphology on the surface and are accompanied by extensive granitic magmatic activities (Zhou and Li, 2000; Shu et al., 2009; Xia and Zhao, 2014; Deng et al., 2019).
Under the influence of complex geological evolution, three groups of faults with NE-, NEE-, and NW-trending are widely developed in the GHMGBA (Lu et al., 1991; Zhang and Wu, 1994; Sun et al., 2012; Yao et al., 2013; Cao et al., 2014). They are dominated by faults with a NE direction, which were mainly formed in the Mesozoic era and activated during the Yanshanian movement, along which vast amounts of Mesozoic granites were intruded. NEE-trending faults were also formed during the Mesozoic and were reactivated as tensional faults during seafloor spreading in the SCS (Cao et al., 2018). The NW-striking faults are thought to have originated later, mainly in the Late Yanshanian and Himalayan orogeny, with smaller scales and cutting deeper than those of the NE- and NEE-trending faults (Chen et al., 2021). These three groups of faults cut deep into the crust and controlled the development of sedimentary basins by affecting regional subsidence. The stratigraphic facies of the basins are dominated by lacustrine sediments from the Cretaceous to the Early Neogene (Zhu et al., 1989). The topographic uplift caused by the first Himalayan movement led to the absence of the Middle Neogene to Pleistocene strata in the region (Yao et al., 2013). Moreover, volcanic rocks are widespread in the basins. Lithologic analyses show that a set of tholei-calc-alkaline series of rocks with island arc characteristics are extensively developed in SSB (Zhu et al., 1989), which reflects lithosphere extension (Chen and Xie, 2011; Chen, 2018).
3 DATA AND METHOD 3.1 Data processWe installed 110 mobile seismometers in the GHMGBA from November 30, 2019, to January 20, 2020. After data processing and quality control, 92 short-period (down to 5 s) three-component portable seismic instruments and 38 existing fixed stations (down to at least 60 s) with good data quality were selected (average station spacing of about 15 km) (Fig. 1). The stations cover most areas of the GHMGBA and can well obtain the 3-D S-wave velocity structures in GHMGBA.

|
| Fig.1 Station distribution and geological structure in the study area a. distributions of 130 seismic stations and major faults in the study area. Blue triangles represent temporary seismic stations, and purple triangles represent fixed seismic stations in Guangdong Province. Solid red lines indicate onshore faults, while dotted red lines indicate offshore faults. F1: Xijiang fault; F2: Baini-Shawan fault; F3: Luogang-Taiping fault; F4: Enping-Xinfeng fault; F5: Heshan-Huidong fault; F6: North piedmont fault of Wugui mountain; F7: South piedmont fault of Wugui mountain; F8: Heyuan-Shaowu fault; F9: Lianhuashan fault; F10: Shenzhen fault; F11: Zhujiang River Mouth fault. Orange diamonds indicate hot springs. Shaded areas outlined by a dotted line indicate basins in the study area. SSB: Sanshui basin; DGB: Dongguan basin; HZB: Huizhou basin; XHB: Xinhui basin; EPB: Enping basin. Data on basin boundaries were corrected from Zhang (1999); b. geologic map of the study area (modified from Zhuang et al., 2017). Black solid lines indicate onshore faults and black dotted lines indicate offshore faults. Yellow stars indicate major earthquakes in the region (Chen and Huang, 1984). The hollow solid circles represent the locations of main cities. GZ: Guangzhou; DG: Dongguan; HZ: Huizhou; SZ: Shenzhen; HK: Hong Kong; AO: Macao; ZH: Zhuhai; JM: Jiangmen; FS: Foshan. |
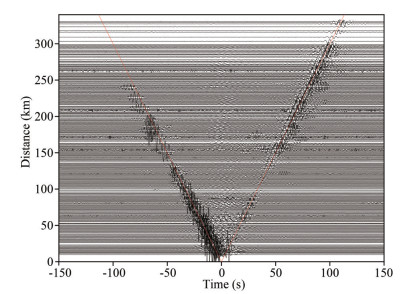
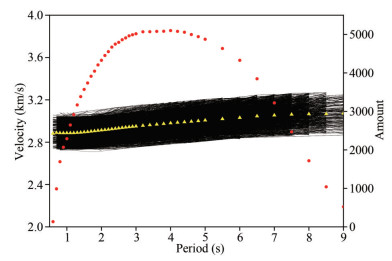
Forty-day continuous waveform data are deployed to conduct this tomography. We first cut the original data into one-day segments, and then decimated the sampling rate to 10 Hz. Before downsampling, the instrument response, mean, and trend have been removed. Spectrum whitening and temporal normalization were adopted to broaden the frequency band of ambient noise signals and reduce the impact of earthquake signals, instrument irregularity, and non-stationary noise sources on subsequent cross-correlations (Bensen et al., 2007). The final cross-correlation function (CCF) of each station pair was obtained (Fig. 2) by calculating the CCF between the two stations and stacking the CCF of each day. To improve the signal-to-noise ratio of CCFs, we stacked the positive and negative lags of CCFs. After that, Rayleigh wave group velocity dispersion curves were measured by frequency-time analysis (FTAN) from the cross correlograms (Herrmann, 2013): we first converted the original data into the waveform with the frequency band of 0.1–2 Hz, then obtained the group velocity of each period by tracking the maximum amplitude. Dispersion data with a station spacing less than 1.5 times wavelength were eliminated. The average group velocity in each period was calculated on the basis of the extracted dispersion curves, and the dispersion data with a difference of more than ±0.2 km/s from the average group velocity in each period were removed. Finally, 5 100 group velocity dispersion curves were obtained (Fig. 3).
|
| Fig.2 Waveforms of cross-correlation functions for all station pairs Solid red line represents the seismic phase with a velocity of 3.0 km/s. |
|
| Fig.3 Plots of dispersion curves for all station pairs Solid black lines represent group velocity dispersion curves. Yellow triangles represent average velocities in the corresponding periods. Red dots represent the numbers of the dispersion curves in the corresponding periods. |
Based on group velocities dispersion data, the Fast Marching Method (FMM) (Herrmann, 2013) was used for ray tracing in order to consider the impact of underground medium heterogeneity on the surface wave propagation path. During the inversion, the parameters of smoothing and damping are considered and tested, which were set as 10 and 5. Then we inverted the group velocity structures of the GHMGBA for periods of 0.6–8 s (Supplementary Figs.S1–S2). The travel-time residuals before and after Rayleigh wave velocity inversion are shown in
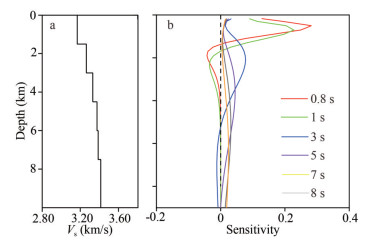
Supplementary Fig. S3, and the fittings between the measured and calculated dispersion curves are shown in Supplementary Figs.S4–S7. Based on this, we first inverted the average group velocities to obtain a 1-D initial S-wave velocity model (Fig. 4a). Then using this 1-D S-wave velocity model as the initial model and the Rayleigh wave group velocities map of 0.6–8-s periods as inputs to invert the 3-D S-wave velocity model following the linearized inversion method of Herrmann (2013). In the inversion processes, the model is divided into 5 layers at depth with each layer of 1.5 km (5 layers are set at 1.5, 3, 4.5, 6, 7.5 km), and the velocity ratio of S-wave to P-wave Vp/Vs is kept at 1.75. Density parameters were obtained by Vp conversion using the Nafe-Drake relation (Brocher, 2005), as follow:
|
| Fig.4 Velocity sensitivity kernels in 1–8-s periods a. 1-D initial S-wave velocity model; b. sensitive kernels curves. |
ρ=1.6612Vp–0.4721Vp2+0.0671Vp3–0.0043Vp4+ 0.000106Vp5.
Sensitive kernel curves at depths in different periods show that our data can constrain the velocity structures shallower than 8 km (Fig. 4b).
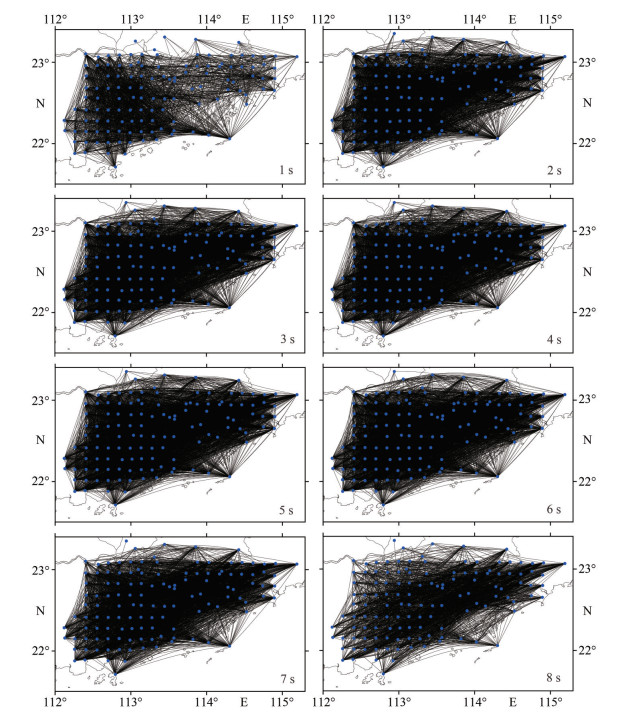
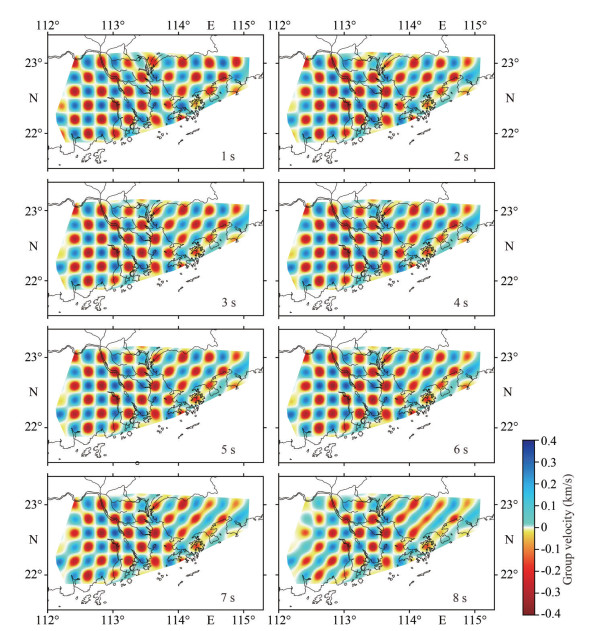
4 RESULTThe lateral resolution of ambient noise tomography mainly depends on the conditions of ray coverage and crossover (Li et al., 2009). The denser the coverage with the better the crossing, the higher the imaging resolution. Figure 5 shows the ray coverage for periods of 1–8 s. We can conclude that the ray coverage of 3–6-s periods is the best. Checkerboard resolution tests are also performed to check the robustness and resolution of the tomography. Figure 6 shows the results of the checkerboard test for periods of 1–8 s with the grid size of 0.2°×0.2°, from which we can determine that most areas are well resolved except for the margin of the seismic array. Due to the uneven distribution of stations in the east of the ZRE, the NE-striking rays are more numerous than those in other directions, which leads to slight NE-trending smearing in the checkerboard test results. We also conducted comparative tests with different grid sizes (Supplementary Figs.S8–S9). We found that the grid spacing of 0.2°×0.2° has a well recovery in the whole study area. Considering the resolution and our research objects, finally, we chose the grid spacing of 0.2°×0.2°.
|
| Fig.5 Ray coverage in 1–8-s periods Black lines represent rays, while blue dots represent the stations. The period of each panel is marked at the lower right corner. |
|
| Fig.6 Checkerboard test results with a grid size of 0.2°×0.2° in 1–8-s periods |
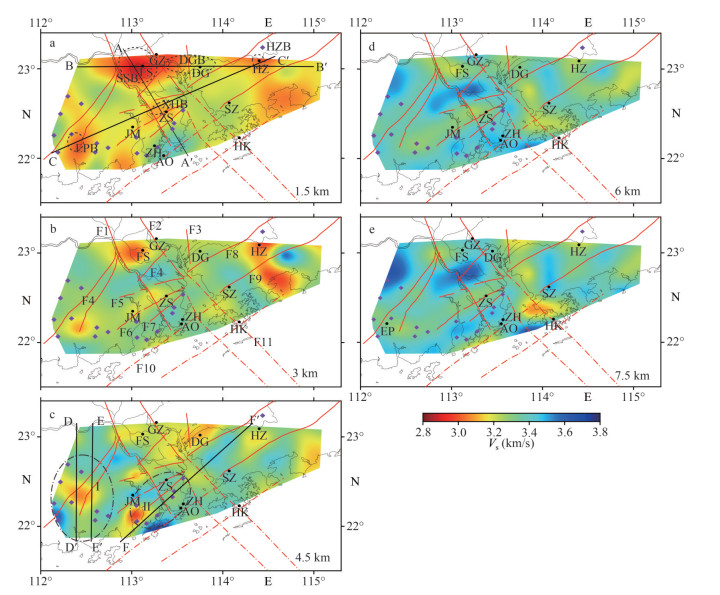
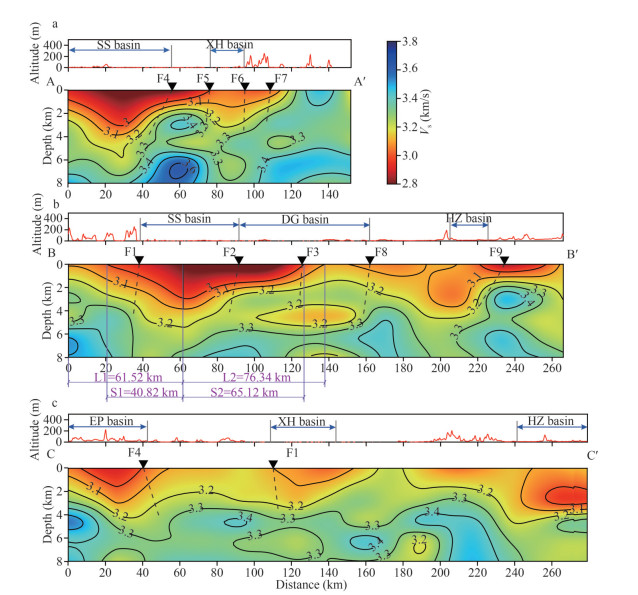
Figures 7 and 8 show the inversion results of S-wave velocity structures at five different depths (1.5–7.5 km) and three vertical profiles crossing major basins, respectively. On the plane, the main basins in the GHMGBA show obvious low-velocity anomalies at shallow depths (0–3 km). S-wave velocities of sedimentary formation in basins are about 2.8–3.1 km/s, and faults at the basin boundaries correspond well to the boundaries of the low-velocity anomaly. As the depth increases, the scale of low-velocity anomalies decreases significantly. If we take the contour of 3.1 km/s as the lower boundary of the basins, the depth and morphological characteristics of the basins can be roughly delineated. The range of low-velocity anomalies in SSB is the largest, while the velocity value is the smallest. The low-velocity anomalies in SSB characterized by 3.1 km/s extend to the depth of 4 km, with a funnel shape in the NW direction (Fig. 8a). However, it is irregular in the EW direction (Fig. 8b), as a velocity contour in the east side of SSB is gentler than the west side. The SSB velocity gradient changes abruptly in the Xijiang fault (F1) in the west and the Baini-Shawan fault (F2) in the east. The DGB is divided by the Luogang-Taiping fault (F3), and its velocity structures differ significantly on east and west sides of the fault. On the west side of F3, the DGB has obvious low-velocity anomalies extending over 2 km in depth, while the east side does not show obvious low-velocity characteristics (Fig. 8b). The HZB is located between the Heyuan-Shaowu fault (F8) and the Lianhuashan fault (F9). Its S-wave velocity structures also show clear low-velocity characteristics (Fig. 8b–c). Whereas it should be noted that the HZB is located on the edge of the study area, and our data cover only the southern part of the basin, the description of detailed characteristics of imaging results may be unclear, so a detailed analysis was not conducted. The low-velocity anomalies of the EPB extend for more than 2 km (Fig. 8c), with a general V-shape distribution. The Enping-Xinfeng (F4) fault apparently controls the north-eastern boundary of the EPB. The overall S-wave velocities of the XHB are slightly higher than that of the EPB, and its depth is shallower than that of the EPB (Fig. 8c).
|
| Fig.7 Map views of the S-wave tomography at 1.5–7.5-km depth a, b, c, d, and e are the results of S-wave velocity tomography at depths of 1.5, 3, 4.5, 6, and 7.5 km, respectively. Solid red lines represent onshore faults, and dotted red lines represent offshore faults. The specific name of each fault is the same as in Fig. 1, and purple diamonds indicate hot springs. AA′, BB′, and CC′ in Fig. 7a represent the location of the corresponding profiles in Fig. 8. DD′, EE′, and FF′ in Fig. 7c represent the location of the corresponding profiles in Fig. 9. |
|
| Fig.8 Vertical cross-sections across the basins of Vs tomography a. the positions of the profiles; b. L1 and L2 represent the distances between the deepest point of the SSB and the intersection points of the 3.1-km/s velocity contour line with the surface. S1 and S2 represent the distances between the deepest point of the SSB and the intersection points of the 3.0-km/s velocity contour line with the surface. |
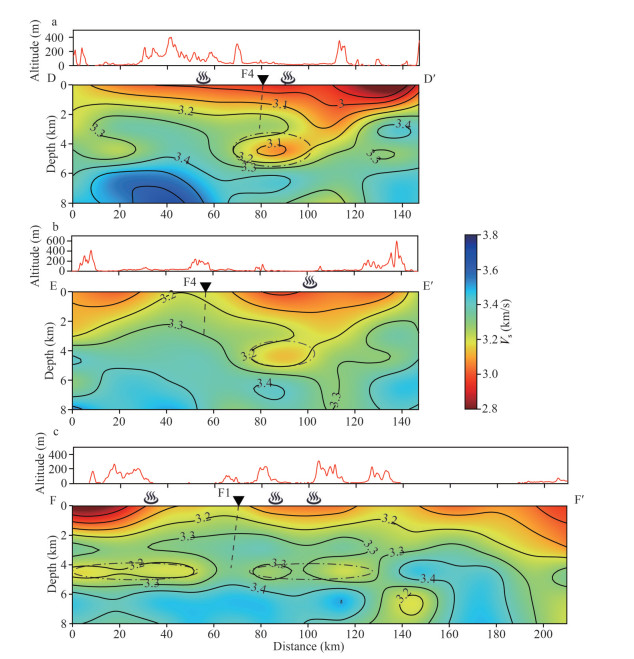
We projected the locations of hot springs on maps showing the S-wave velocity structures at different depths (Fig. 7). The hot springs are mostly located on the edge of shallow low-velocity anomalies in a 1.5-km depth slice (Fig. 7a). Vertical profiles over areas with intensive hot springs (Fig. 9) show that at a depth of about 4.5 km below the hot springs there are pronounced low-velocity anomalies. According to the shape characteristics of low-velocity anomalies, they can be roughly divided into two types: (1) areas of intensive hot springs around the EPB (Fig. 9a–b), where the S-wave velocity of the low-velocity anomalies about 3.1 km/s, extending northward, and with a thickness of almost 2 km. The 4.5-km low-velocity anomalies have a certain connectivity with the shallow low-velocity anomalies of the EPB; and (2) areas of intensive hot springs along the coast of Zhuhai (Fig. 9c), where the S-wave velocity of the low-velocity anomalies at 4.5-km depth is slightly less than 3.1 km/s with a banded distribution. Its thickness is less than the thickness of the low-velocity layer below the EPB.
|
| Fig.9 Vertical profile of Vs tomography across the hot spring outcropping areas The position of the profile is shown in Fig. 7c. Black inverted triangles represent fault positions. F1 is the Xijiang fault and F4 is the Enping-Xinfeng fault. Hot spring marks represent the hot spring exposure positions. |
Our results show that the S-wave velocity structures of the upper crust in the study area have obvious lateral heterogeneity, and the major low-velocity anomalies correspond well to the basin locations outlined by previous studies (Zhang, 1999; Lü et al., 2022). Our model revealed the deep 3-D structure of major basins and their coupling relationships with surrounding faults, which is difficult to achieve in previous studies. The ranges of low-velocity anomalies are in line with the basin locations outlined by previous studies (Zhang, 1999; Lü et al., 2022). As the largest basin in the study area, outfield surveys and borehole data revealed that sediment thickness in the SSB was about 4 km (Tang, 1994; Zhang, 1999; Wei et al., 2018), which agrees well with the range of low-velocity anomalies outlined by a 3.1-km/s velocity contour in our study (Fig. 8a–b). This study, combined with the velocity interval of the Mesozoic basin basements (Özalaybey et al., 1997), selected a 3.1-km/s velocity contour to roughly constrain the deep morphological characteristics of the SSB. The S-wave velocity structures (Fig. 8a) indicate that the SSB is funnel-shaped with almost symmetrical velocity contours in the NW direction. Whereas the velocity structures of the SSB have obvious asymmetric morphological characteristics in the EW direction (Fig. 8b). If the deepest sedimentary point of the SSB is considered as the axis (black thick solid line in Fig. 8b), the low-velocity anomaly outlined by the 3.1-km/s velocity contour is 15 km wider on the east side (L2) than that on the west side (L1). Similarly, based on the 3.0-km/s velocity contour, the east side of the SSB (S2) is 25 km wider than the west side (S1). According to regional sedimentary stratigraphy studies, during the continuous expansion of the SSB from the Late Cretaceous to the Tertiary, magmatic activities in the SSB centre showed a linear north-south distribution, which indicated that the SSB spreading direction was mainly east-west (Zhu et al., 2004). Spatial and temporal characteristics of volcanic rock distribution show that volcanic rock distribution in the SSB is consistent with sedimentary centre migration both in space and time, and volcanic rocks gradually migrate west of the SSB with basin expansion (Dong et al., 2006; Zhou et al., 2009). Combined with the deep morphological characteristics of the SSB revealed by the S-wave velocity structures, we proposed that the SSB has an east-west asymmetric extension pattern. In other words, the expansion on the east side is more intense than on the west side, and the asymmetric pattern becomes more severe with the basin expansion.
By analyzing the correlation between the faults and the velocity structures of the basins, it can be determined that the fault systems in the GHMGBA have obvious control and impact on the basins. Both the EPB and the XHB are enclosed by the NE- and NEE-trending faults. The Enping-Xinfeng fault (F4) separates the EPB from the high-velocity anomalies of Tianlu mountain on its northwest side, where Indosinian and Yanshanian granites (Long, 2004) are widely exposed (Fig. 7). The Luogang-Taiping fault (F3) crosses the DGB and shows significant differences in S-wave velocity structures between the east and west sides of the fault. On the west side, the basin shows obvious low-velocity anomalies, while this is not the case for the east side (Fig. 8b), which reveals that uneven uplift exists on the east and west sides of the DGB under the impact of the Luogang-Taiping fault (F3). The S-wave velocity gradient beneath the SSB shows obvious and rapid changes on the east, west, and south sides of the Baini-Shawan fault (F2), the Xijiang fault (F1), and the Enping-Xinfeng fault (F4) (Fig. 8a–b), which indicate that these faults significantly limited the boundary of the SSB. Similarly, faults around the DGB and the XHB also show strong control on the basin boundaries.
The deep velocity structures of many small and medium-sized basins do not show distinct connectivity but show relatively independent geometric characteristics. Their velocity structures are controlled by the NE- and NEE-trending faults (Fig. 8), which is in line with the NE- and NEE-trending basin and range tectonics of South China (Shu et al., 2004; Wang and Shu, 2012). The results from this study show that the S-wave velocity structures in the GHMGBA represent the obvious characteristics of anomalies interphase distribution of high and low velocities along the NE-SW direction (Fig. 8d–e), and the boundaries of high and low velocity anomalies are limited by the main NE-trending faults. This may reflect the extension and compression stress filed in the NW direction. These results are in line with the deep dynamics of strong crustal extension and thinning in South China caused by the rupture and delamination of the NW-trending Paleo-Pacific subduction plate and the asthenosphere upwelling since the early Cretaceous (Li and Li, 2007). Intensive crustal extension enabled the creation of a series of extensional fault-depression basins, followed by massive intrusion of granitic magma and accumulation of volcanic eruptions, which formed the NE-trending granitic volcanic and intrusive complex zone (Shu et al., 2004; Shu and Wang, 2006; Zhou et al., 2009; Shu, 2012). Our results show the high-velocity anomalies beneath the high topography in the GHMGBA, which is assumed to be a Late Mesozoic solidified magma channel system in the crust. In addition, the large granite intrusion zone in Zhuhai and Macao also shows relatively high velocity characteristics. The 3-D S-wave velocity structures depicted shallow and deep basin-range structures in the GHMGBA, reflecting the reshaping effects of the thermal material upwelling on the crust, and providing a clear perspective for understanding the regional deep basin-range structures.
5.2 Genesis and types of hot springsThe west ZRE is rich in geothermal resources, most of which are medium-low temperature hydro-geothermal systems (Zhang et al., 2002; Yuan, 2013). Our imaging results show prominent low-velocity anomalies at a depth of about 4.5 km below the intensive outcrops of hot springs (Fig. 9). According to the borehole data from the geothermal field, the terrestrial heat flow in the GHMGBA is about 70–80 mW/m2, and the maximum geothermal gradient can reach 42 ℃/km (Wang, 2018). This is significantly higher than the normal geothermal gradient of 10–30 ℃/km. Nevertheless, it is far lower than high-temperature geothermal systems with additional heat sources (e.g., the gradient in the Tengchong geothermal field is 100–120 ℃/km with magma heat sources) (Long, 1988). Thus, low-velocity anomalies beneath hot springs cannot be bodies of molten magma. In addition, previous theoretical calculations and analyses of water flow and temperature in hot springs have indicated that the mechanism of hot springs formation in the region was a type of deep-water circulation (Zhang et al., 2002). Numerical simulation has also suggested that high-temperature fluid reservoirs are located beneath the hot springs (Lu et al., 2017). Moreover, Wang et al. (2018) confirmed that the depth of circulation of hot spring fluid through the pipeline model was 3.9–4.7 km, based on the characteristics of the medium-low temperature hydro-geothermal system in deep fault zones. Combined with previous studies, we have suggested that the low-velocity anomalies at a depth of 4.5 km beneath the hot springs in the study area are the thermal reservoirs of the hot springs. Around the thermal reservoirs, the fluid of hot springs reaches a temperature-pressure equilibrium, and fluids migrate mainly through advection (Lu et al., 2017). When the fluid is disturbed, for example when it encounters large faults, its equilibrium state is destroyed, and the buoyancy generated at high temperatures causes the fluid to migrate upward along the faults, only to be exposed as hot springs on the surface (Qi et al., 2017).
The hot springs in the west of the study area can be roughly divided into two types (shown in Fig. 7c) by comparing the hot springs with the characteristics of the topography and S-wave velocity. The first type of hot springs is mainly located on the periphery of the EPB. The fluid from the hot springs is more likely to upwell along the faults around the basin and then be exposed at the edge of the basin since the heat transfer efficiency around the basin is higher than in the centre (Cheng et al., 2021). Moreover, the hot springs are scattered around the thermal reservoirs at a depth of 4.5 km below the EPB, and the thickness of the thermal reservoirs (shown in Fig. 7c) is slightly wider than 2 km. Moho uplift and crust extension and thinning are revealed by the high gravity anomalies in the EPB (Tian, 2014), which can not only lead to basin subsidence, creating space for overlying deposition, but also creating a large number of listric normal faults on the basin periphery. Thus, the sedimentary stratum of low thermal conductivity created favourable conditions for the formation of thermal reservoirs, while large faults around the basin provided ascending channels for the hot spring fluid (Xi et al., 2018). Therefore, we proposed that the hot springs around the EPB belong to a representative geothermal system of the sedimentation basin conduction type, and we speculated that this type of hot springs can easily form thick thermal reservoirs because of the superior thermal storage conditions.
The second type of hot springs is mainly exposed along the coast of Zhuhai, and generally has a linear distribution parallel to the NE-trending faults (shown in Fig. 7c). The outcropping conditions of hot springs here differ from those on the periphery of the EPB. In this region, Yanshanian granites are widely exposed, and granites near the fault zones have a high degree of fragmentation and extreme hydrothermal alterations (Wang et al., 2018). We have speculated that the thermal reservoirs at a depth of 4.5 km are formed by high-temperature fluid hosting in granites with high porosity. And its overlaid is covered with a stratum of low permeability, which shows a relatively high velocity in the S-wave velocity image results, forming the thermal reservoir cap. In addition, hot springs are mainly exposed in areas with large topographic contrast (Huang et al., 1991), thus providing sufficient head pressure for deep water circulation. This results in a relatively shorter cycle of hot springs fluids, thus showing the characteristics of a thin thermal reservoir. We proposed that the hot springs here belong to the uplift mountain convection type due to the characteristics of regional thermal reservoirs and topography. Thermal storage conditions for this type of hot springs are not superior, so it is more likely that this type of hot springs will form thin thermal reservoirs with the mostly banded distribution.
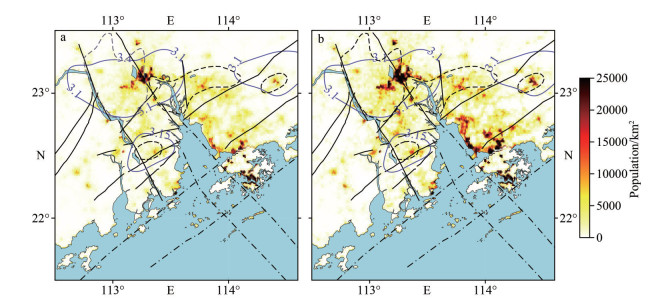
5.3 Characteristics of the GHMGBA geological environmentOur results show that the distribution of major urban agglomerations in the GHMGBA appears to have a good correlation with geological structures characterized by low velocities in shallow areas (less than 3 km). Moreover, the population density distribution (Fig. 10) revealed that the trend of GHMGBA population development in the past 20 years has mainly concentrated in areas with relatively low velocities in geological structures. This may indicate that there is a certain relationship between the urban agglomerations' development and the basic geological conditions in the GHMGBA.
|
| Fig.10 GHMGBA population density map a. population density map of the GHMGBA in 2000; b. population density map of the GHMGBA in 2020 (population density data from: https://www.worldpop.org/). Black solid lines indicate onshore faults and black dotted lines indicate offshore faults, black dashed lines indicate the boundary of major basins in the study area, purple solid lines indicate S-wave velocity isolines. |
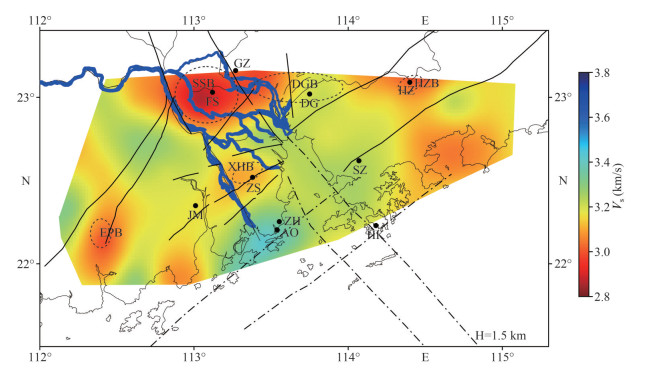
To better investigate how basic geological conditions affect the development of urban agglomerations, we projected data of first-order rivers in the study area onto the S-wave velocity view map at a depth of 1.5 km (Fig. 11). The results show that the trend of first-order rivers in the GHMGBA is either along the periphery of the basins or directly traverse the basins, which may be related to faults on the periphery of the basins. As a fracture zone, faults are always under the impacts of weathering and erosion, which is why the channels of large rivers easily change along the direction of faults (Yao et al., 2013; Jin et al., 2015). It results in a subtle coupling between rivers and basins to some extent (Chang and Wang, 1992; Chen et al., 2008; Sidorchuk et al., 2009). Based on the coupling relationship, the basins are equipped with a set of conditions necessary for human survival, including abundant water and fertile soil, thus allowing a large number of people to settle there and form urban communities. While the cluster effects reflected on the crustal structures are the major urban agglomerations are mainly located in the structural province of relatively low velocity. It is worth noting that there are numerous factors that affect urban development, such as the political system, human capital, investment innovation, etc. (Lin et al., 2014; Zhou et al., 2015; Liang et al., 2018). The urban agglomerations we are discussing are more likely to refer to traditional urban agglomerations with a certain history of farming. Comparatively, "young" cities such as Shenzhen, Hong Kong, Macao, and Zhuhai benefit more from modern policies and the booming shipping industry. The basic geological conditions determined to some extent the urban planning and the environment of the human settlement. Although the correlations between the basic geological conditions and urban development need to be further explored, the obtained characteristics of the geological environment of major cities in the GHMGBA may provide a new reference for the future planning of large cities.
|
| Fig.11 Distribution of the first-level rivers and Vs tomography at a depth of 1.5 km in the GHMGBA Bold blue lines show the distribution of first-level rivers in the GHMGBA (first-level river data are from the Chinese geospatial data set: https://github.com/gmt-china/china-geospatial-data/releases). Black solid lines are onshore faults, while black dotted lines are offshore faults. Black dotted lines outline the main basins in the study area. |
In this paper, we obtained the 3-D upper crust S-wave velocity structures of the GHMGBA using the method of ambient noise tomography based on 40-day continuous waveform data from 130 stations. Combined with regional geological and geophysical data, the characteristics of S-wave velocity structures in the main basins and beneath the hot springs are discussed. The main findings are as follows:
(1) The velocity structures and overall outlines of the main basins in the GHMGBA are well illustrated by the imaging results. Significant differences in velocity gradients exist between the east and west sides of the SSB, which suggests that the SSB has an asymmetric EW-trending extension pattern. The NE-, NEE-, and NW-trending faults represent intensive control effects of the basins;
(2) There are obvious low-velocity bodies at a depth of about 4.5 km beneath the hot springs, which are speculated to be thermal reservoirs of the hot springs. The hot springs in the west ZRE can be divided into two types according to their exposure conditions and morphological characteristics of thermal reservoirs. The first is the type of sedimentation basin conduction around the EPB and the second is the uplift mountain convection type along the Zhuhai coast. In addition, we have proposed that the hot springs of the sedimentation basin conduction type tend to form thicker thermal reservoirs, while the hot springs of the uplift mountain convection type tend to form thinner thermal reservoirs;
(3) We found that the distribution of traditional urban agglomerations in the GHMGBA shows a correlation with the geological structures of the low-velocity areas at shallow depths (less than 3 km) from a new perspective of crustal structures. It is speculated that the influence of faults leads to a certain coupling relationship between large rivers and basins, forming a favourable geological environment that is suitable for human settlement.
7 DATA AVAILABILITY STATEMENTAll data generated and/or analyzed during this studay are available on request from the corresponding author.
8 ACKNOWLEDGMENTWe appreciate two anonymous reviewers for their useful and constructive comments, which helped improve this manuscript. We are grateful to the Guangdong Earthquake Agency for providing the waveform data, and to all those who participated in data acquisition.
Electronic supplementary material
Supplementary material (Supplementary Figs. S1–S9) is available in the online version of this article at https://doi.org/10.1007/s00343-022-2087-0.
Bensen G D, Ritzwoller M H, Barmin M P, et al. 2007. Processing seismic ambient noise data to obtain reliable broad-band surface wave dispersion measurements. Geophysical Journal International, 169(3): 1239-1260.
DOI:10.1111/j.1365-246X.2007.03374.x |
Brocher T M. 2005. Empirical relations between elastic wavespeeds and density in the earth's crust. Bulletin of the Seismological Society of America, 95(6): 2081-2092.
DOI:10.1785/0120050077 |
Cao J H, Xia S H, Sun J L, et al. 2014. Comparison of fault structure characteristics in the northern Pearl River Mouth basin and its geological implication. Progress in Geophysics, 29(5): 2364-2369.
(in Chinese with English abstract) DOI:10.6038/pg20140555 |
Cao J H, Xia S H, Sun J L, et al. 2018. Offshore fault geometrics in the Pearl River Estuary, southeastern China: evidence from seismic reflection data. Journal of Ocean University of China, 17(4): 799-810.
DOI:10.1007/s11802-018-3499-5 |
Chang P X, Wang H F. 1992. The geomorphological characteristics, the pattern of the river system and the neotectonic stress field in the Weihe basin. Journal of Xi'an College of Geology, 14(2): 34-41.
(in Chinese with English abstract) DOI:10.19814/j.jese.1992.02.005 |
Chen E M, Huang Y Y. 1984. Summary of 19 strong earthquakes in South China and the northern continental margin seismic zone in South China Sea. South China Seismology, (1): 11-32.
(in Chinese) DOI:10.13512/j.hndz.1984.01.002 |
Chen H, He X H, Yang H F, et al. 2021. Fault-plane determination of the 4 January 2020 offshore Pearl River Delta earthquake and its implication for seismic hazard assessment. Seismological Research Letters, 92(3): 1913-1925.
DOI:10.1785/0220200232 |
Chen J, Li Y G, Cui Z Q, et al. 2008. Stream channel transition related to neotectonic movement and its influence upon sedimentation in the south of Chengdu basin. Resources Survey & Environment, 29(1): 18-23.
(in Chinese with English abstract) DOI:10.1038/352436a0 |
Chen L, Xie Y S. 2011. Discussion of Paleocene-Eocene boundary of Sanshui basin. Advanced Materials Research, 236-238: 2487-2490.
DOI:10.4028/www.scientific.net/AMR.236-238.2487 |
Chen P P. 2018. The Response of Late Cretaceous-Eocene Epoch Volcanic and Sedimentary Sequence in Sanshui Basin to the Tectonic Evolution of the Northern Margin of South China Sea. China University of Geosciences, Beijing, China, p. 1-118. (in Chinese with English abstract)
|
Cheng F, Xia J H, Ajo Franklin J B, et al. 2021. High-resolution ambient noise imaging of geothermal reservoir using 3C dense seismic nodal array and ultra-short observation. Journal of Geophysical Research: Solid Earth, 126(8): e2021JB021827.
DOI:10.1029/2021JB021827 |
Deng Y F, Li J T, Peng T P, et al. 2019. Lithospheric structure in the Cathaysia block (South China) and its implication for the Late Mesozoic magmatism. Physics of the Earth and Planetary Interiors, 291: 24-34.
DOI:10.1016/j.pepi.2019.04.003 |
Dong Y X, Xiao L, Zhou H M, et al. 2006. Spatial distribution and petrological characteristics of the bimodal volcanic rocks from Sanshui basin, Guangdong Province: implication for basin dynamics,. Geotectonica et Metallogenia, 30(1): 82-92.
(in Chinese with English abstract) DOI:10.16539/j.ddgzyckx.2006.01.010 |
Guo L H, Gao R, Shi L, et al. 2019. Crustal thickness and Poisson's ratios of South China revealed from joint inversion of receiver function and gravity data. Earth and Planetary Science Letters, 510: 142-152.
DOI:10.1016/j.epsl.2018.12.039 |
Herrmann R B. 2013. Computer programs in seismology: an evolving tool for instruction and research. Seismological Research Letters, 84(6): 1081-1088.
DOI:10.1785/0220110096 |
Hou H M, Yuan Y R, Zhang Y X, et al. 1994. Paleomagnetic study of Sanshui basin in Guangdong from late Cretaceous to Eocene and its tectonic significance. Tropic Oceanology, 13(4): 65-72.
(in Chinese with English abstract) |
Huang H B, Guo X W, Xia S H, et al. 2014. Study of crustal thickness and Poisson's Ratio in the coastal area of South China. Chinese Journal of Geophysics, 57(6): 860-871.
DOI:10.1002/cjg2.20148 |
Huang H B, Xiong H, Qiu X L, et al. 2020. Crustal structure and magmatic evolution in the Pearl River Delta of the Cathaysia Block: new constraints from receiver function modeling. Tectonophysics, 778: 228365.
DOI:10.1016/j.tecto.2020.228365 |
Huang J L, Liu Y N, Zeng W G. 2019. Analysis of geological characteristics and geological environment protection in Guangdong-Hong Kong-Macao Greater Bay Area. Pearl River, 40(9): 103-109.
(in Chinese with English abstract) DOI:10.3969/j.issn.1001-9235.2019.09.015 |
Huang Y C, Yao H, Huang B S, et al. 2010. Phase velocity variation at periods of 0.5-3 seconds in the Taipei basin of Taiwan from correlation of ambient seismic noise. Bulletin of the Seismological Society of America, 100(5A): 2250-2263.
DOI:10.1785/0120090319 |
Huang Y K, Chen J J, Xia F, et al. 1991. A tectonic analysis of the regional stability in Zhuhai city, Guangdong province. Acta Scientiarum Naturalium Universitatis Sunyatseni, 30(2): 131-139.
(in Chinese with English abstract) |
Jin D S, Qiao Y F, Yang L H, et al. 2015. A research of influence of neo-tectonic movement on alluvial rivers: review and prospect. Geographical Research, 34(3): 437-454.
(in Chinese with English abstract) DOI:10.11821/dlyj201503004 |
Li C, Yao H J, Fang H J, et al. 2016. 3D near-surface shear-wave velocity structure from ambient-noise tomography and borehole data in the Hefei urban area, China. Seismological Research Letters, 87(4): 882-892.
DOI:10.1785/0220150257 |
Li H Y, Su W, Wang C Y, et al. 2009. Ambient noise Rayleigh wave tomography in western Sichuan and eastern Tibet. Earth and Planetary Science Letters, 282(1-4): 201-211.
DOI:10.1016/j.epsl.2009.03.021 |
Li S Z, Zang Y B, Wang P C, et al. 2017. Mesozoic tectonic transition in South China and initiation of Palaeo-Pacific subduction. Earth Science Frontiers, 24(4): 213-225.
(in Chinese with English abstract) DOI:10.13745/j.esf.yx.2017-4-13 |
Li Z X, Li X H. 2007. Formation of the 1300-km-wide intracontinental orogen and postorogenic magmatic province in Mesozoic South China: a flat-slab subduction model. Geology, 35(2): 179-182.
DOI:10.1130/G23193A.1 |
Liang J W, Mao Y H, Jiang H Z. 2018. Research on the factors influencing the economic development of regional urban agglomeration in Guangdong, Hong Kong and Macao. Inquiry Into Economic Issues, (2): 90-99.
(in Chinese with English abstract) |
Lin F C, Li D Z, Clayton R W, et al. 2013. High-resolution 3D shallow crustal structure in Long Beach, California: application of ambient noise tomography on a dense seismic array. Geophysics, 78(4): Q45-Q56.
DOI:10.1190/geo2012-0453.1 |
Lin F C, Ritzwoller M H, Townend J, et al. 2007. Ambient noise Rayleigh wave tomography of New Zealand. Geophysical Journal International, 170(2): 649-666.
DOI:10.1111/j.1365-246X.2007.03414.x |
Lin X B, Ma X G, Chao H, et al. 2014. Research on spatial organizational successions of the PRD mega-region by global principal component analysis method. Human Geography, 29(4): 59-65, 97.
(in Chinese with English abstract) DOI:10.13959/j.issn.1003-2398.2014.04.039 |
Liu Y, Wang Y, Li H. 2020. Industrial development of world-class bay areas and its enlightenment to the Guangdong-Hong Kong-Macao Greater Bay Area. Bulletin of the Chinese Academy of Sciences, 35(3): 312-321.
(in Chinese with English abstract) DOI:10.16418/j.issn.1000-3045.20191231002 |
Liu Y X, Zhong J Q, Zhan W H. 1994. The basic characteristics of seismic belts and preliminary analyses of regional stability in north continental margin of south China sea. South China Journal of Seismology, 14(4): 41-46.
(in Chinese with English abstract) |
Long J M. 1988. Distribution and formation of geothermal fields in Tengchong area Yunnan Province. Journal of Chengdu University of Technology (Science & Technology Edition), 15(2): 79-86.
(in Chinese with English abstract) |
Long Y G. 2004. Exploitation and protection of geothermal resources in Enping City, Guangdong Province. Guangdong Geology, 19(3): 25-28.
(in Chinese) |
Lu C B, Zhan W H, Liu Y X. 1991. Analyses on fault activity and regional stability in the Pearl River Mouth. Tropic Oceanology, 10(1): 5-12.
(in Chinese with English abstract) |
Lu G P, Wang X, Li F S, et al. 2017. Deep geothermal processes acting on faults and solid tides in coastal Xinzhou geothermal field, Guangdong, China. Physics of the Earth and Planetary Interiors, 264: 76-88.
DOI:10.1016/j.pepi.2016.12.004 |
Lü Z Y, Huang H B, Ye X W, et al. 2022. High-resolution crustal shear-wave velocity structure in the Pearl River Delta, South China. Seismological Research Letters, 93(1): 338-350.
DOI:10.1785/0220210116 |
Lv Z Y, Qiu X L, Lv J S, et al. 2020. Crustal structure beneath the east side of Pearl River Estuary from onshore-offshore seismic experiment. International Geology Review, 62(7-8): 1057-1069.
DOI:10.1080/00206814.2018.1553114 |
Özalaybey S, Savage M K, Sheeham A F, et al. 1997. Shear-wave velocity structure in the northern basin and range province from the combined analysis of receiver functions and surface waves. Bulletin of the Seismological Society of America, 87(1): 183-199.
DOI:10.1785/BSSA0870010183 |
Qi J H, Xu M, An C J, et al. 2017. Characterizations of geothermal springs along the Moxi deep fault in the western Sichuan plateau, China. Physics of the Earth and Planetary Interiors, 263: 12-22.
DOI:10.1016/j.pepi.2017.01.001 |
Qiu Y X. 1992. Regional tectonic evolution and its basic features in Guangdong province. Guangdong Geology, 7(1): 1-26.
(in Chinese with English abstract) |
Ren Z H, Guo Q H, Yang L F. 2005. The fault and it's activity in the north foot of Wuguishan Mountain. South China Journal of Seismology, 25(4): 17-24.
(in Chinese with English abstract) DOI:10.3969/j.issn.1001-8662.2005.04.003 |
Shapiro N M, Campillo M, Stehly L, et al. 2005. High-resolution surface-wave tomography from ambient seismic noise. Science, 307(5715): 1615-1618.
DOI:10.1126/science.1108339 |
Shu L S. 2012. An analysis of principal features of tectonic evolution in South China Block. Geological Bulletin of China, 31(7): 1035-1053.
(in Chinese with English abstract) DOI:10.3969/j.issn.1671-2552.2012.07.003 |
Shu L S, Wang D Z. 2006. A comparison study of basin and range tectonics in the Western North America and southeastern China. Geological Journal of China Universities, 12(1): 1-13.
(in Chinese with English abstract) |
Shu L S, Zhou X M, Deng P, et al. 2004. Geological features and tectonic evolution of Meso-Cenozoic basins in southeastern China. Geological Bulletin of China, 23(9): 876-884.
(in Chinese with English abstract) DOI:10.1007/BF02873097 |
Shu L S, Zhou X M, Deng P, et al. 2009. Mesozoic tectonic evolution of the Southeast China Block: new insights from basin analysis. Journal of Asian Earth Sciences, 34(3): 376-391.
DOI:10.1016/j.jseaes.2008.06.004 |
Sidorchuk A Y, Panin A V, Borisova O K. 2009. Morphology of river channels and surface runoff in the Volga River basin (East European Plain) during the Late Glacial period. Geomorphology, 113(3-4): 137-157.
DOI:10.1016/j.geomorph.2009.03.007 |
Sun J L, Xu H L, Zhan W H, et al. 2012. Activity and triggering mechanism of seismic belt along the northern South China Sea continental margin. Journal of Tropical Oceanography, 31(3): 40-47.
(in Chinese with English abstract) |
Tang Z Y. 1994. Cretacous-Eogene rift valley-type vocalnism in Sanshui basin. Guangdong Geology, (1): 49-57.
(in Chinese) |
Tian S B. 2014. The Study on the Deep Electrical Conductivity Structure of the Heat-Controlling Structure in Middle and Northern of Guangdong. Wuhan, China, p. 1-94. (in Chinese with English abstract)
|
Wang D Z, Shu L S. 2012. Late Mesozoic basin and range tectonics and related magmatism in Southeast China. Geoscience Frontiers, 3(2): 109-124.
DOI:10.1016/j.gsf.2011.11.007 |
Wang X, Lu G P, Hu B X. 2018. Hydrogeochemical characteristics and geothermometry applications of thermal waters in coastal Xinzhou and Shenzao geothermal fields, Guangdong, China. Geofluids, 2018: 8715080.
DOI:10.1155/2018/8715080 |
Wang X. 2018. Formation Conditions and Hydrogeochemical Characteristics of the Geothermal Water in Typical Coastal Geothermal Field with Deep Faults, Guangdong Province. China University of Geosciences, Wuhan, China, p. 1-166. (in Chinese with English abstract)
|
Wei Z, Shi Z H, Zeng Y X. 2018. Geological characteristics of volcanic rock in Sanshui basin of Guangdong Province. Sichuan Nonferrous Metals, (4): 9-13.
(in Chinese with English abstract) |
Xi Y F, Wang G L, Liu S, et al. 2018. The formation of a geothermal anomaly and extensional structures in Guangdong, China: evidence from gravity analyses. Geothermics, 72: 225-231.
DOI:10.1016/j.geothermics.2017.11.009 |
Xia S H, Zhang C R, Cao J H. 2022. Ambient noise tomography for coral islands. Engineering.
DOI:10.1016/j.eng.2021.09.022 |
Xia S H, Xue L Q, Tong C H, et al. 2012. Three-dimensional tomographic model of the crust beneath the Hong Kong region. Geology, 40(1): 59-61.
DOI:10.1130/G32537.1 |
Xia S H, Zhao D P. 2014. Late Mesozoic magmatic plumbing system in the onshore-offshore area of Hong Kong: insight from 3-D active-source seismic tomography. Journal of Asian Earth Sciences, 96: 46-58.
DOI:10.1016/j.jseaes.2014.08.038 |
Xia S H, Zhao M H, Qiu X L, et al. 2010. Crustal structure in an onshore-offshore transitional zone near Hong Kong, northern South China Sea. Journal of Asian Earth Sciences, 37(5-6): 460-472.
DOI:10.1016/j.jseaes.2009.11.004 |
Yan G Z. 1986. Study on the basic characteristics and the evolution of Guangzhou-Conghua fault structural belt. South China Journal of Seismology, (4): 8-21.
(in Chinese) |
Yang H F, Duan Y H, Song J H, et al. 2020. Fine structure of the Chenghai fault zone, Yunnan, China, constrained from teleseismic travel time and ambient noise tomography. Journal of Geophysical Research: Solid Earth, 125(7): e2020JB019565.
DOI:10.1029/2020JB019565 |
Yang W C. 2019. Advances in the study of Yanshanian compressional tectonic events in South China. Gansu Science and Technology, 35(3): 50-53.
(in Chinese) |
Yao H J, van der Hilst R D, de Hoop M V. 2006. Surface-wave array tomography in SE Tibet from ambient seismic noise and two-station analysis-I. Phase velocity maps. Geophysical Journal International, 166(2): 732-744.
DOI:10.1111/j.1365-246X.2006.03028.x |
Yao Y T, Zhan W H, Liu Z F, et al. 2013. Neotectonics and its relations to the evolution of the Pearl River Delta, Guangdong, China. Journal of Coastal Research, 66(S1): 1-11.
DOI:10.2112/SI_66_1 |
Yuan J F. 2013. Hydrogeochemistry of the Geothermal Systems in Coastal Areas of Guangdong Province, South China. China University of Geosciences, Wuhan, China, p. 1-163. (in Chinese with English abstract)
|
Yuan J F, Mao X M, Wang Y X. 2013. Hydrogeochemical characteristics of low to medium temperature groundwater in the Pearl River Delta region, China. Procedia Earth and Planetary Science, 7: 928-931.
DOI:10.1016/j.proeps.2013.03.179 |
Zhang H N, Wu Q H. 1994. A comparative study of main active fault zones along the coast of South China. Seismology and Geology, 16(1): 43-52.
(in Chinese with English abstract) |
Zhang K, Ma H M, Cai J B. 2002. Discussion on the origins of hot spring along the coast of South China. Acta Scientiarum Naturalium Universitatis Sunyatseni, 41(1): 82-86.
(in Chinese with English abstract) DOI:10.3321/j.issn:0529-6579.2002.01.023 |
Zhang X, Ye X W, Lv J S, et al. 2018. Crustal structure revealed by a deep seismic sounding profile of Baijing-Gaoming-Jinwan in the Pearl River Delta. Journal of Ocean University of China, 17(1): 186-194.
DOI:10.1007/s11802-018-3489-7 |
Zhang X Q. 1999. Geological survey of Cretaceous-Tertiary basins in Guangdong Province. Guangdong Geology, 14(3): 53-58.
(in Chinese) |
Zhang Z J, Wang Y H. 2007. Crustal structure and contact relationship revealed from deep seismic sounding data in South China. Physics of the Earth and Planetary Interiors, 165(1-2): 114-126.
DOI:10.1016/j.pepi.2007.08.005 |
Zhao M H, Qiu X L, Ye C M, et al. 2004. An analysis on deep crustal structure along the onshore-offshore seismic profile across the Binghai (littoral) fault zone in NE South China Sea. Chinese Journal of Geophysics, 47(5): 954-961.
DOI:10.1002/cjg2.573 |
Zhuang Z. 2017. Regional geology of Guangdong Province and special administrative regions of Hong Kong and Macao. (Map 171965), Guangdong, ON, Geological Survey Institute of Guangdong Province, available at https://www.osgeo.cn/map/m02d6 (accessed on April 2021).
|
Zhou C S, Jin W F, Shi C Y. 2015. Development strategy of the Pearl River Delta urban agglomeration under the current socioeconomic situation. Progress in Geography, 34(3): 302-312.
(in Chinese with English abstract) DOI:10.11820/dlkxjz.2015.03.005 |
Zhou H M, Xiao L, Dong Y X, et al. 2009. Geochemical and geochronological study of the Sanshui basin bimodal volcanic rock suite, China: implications for basin dynamics in southeastern China. Journal of Asian Earth Sciences, 34(2): 178-189.
DOI:10.1016/j.jseaes.2008.05.001 |
Zhou H X, Xia S H, Hetényi G, et al. 2020. Seismic imaging of a mid-crustal low-velocity layer beneath the northern coast of the South China Sea and its tectonic implications. Physics of the Earth and Planetary Interiors, 308: 106573.
DOI:10.1016/j.pepi.2020.106573 |
Zhou P X, Xia S H, Sun J L, et al. 2018. Spatial variations of b-values in the coastal area of Guangdong. Journal of Ocean University of China, 17(1): 177-185.
DOI:10.1007/s11802-018-3457-2 |
Zhou X M, Li W X. 2000. Origin of Late Mesozoic igneous rocks in Southeastern China: implications for lithosphere subduction and underplating of mafic magmas. Tectonophysics, 326(3-4): 269-287.
DOI:10.1016/S0040-1951(00)00120-7 |
Zhu B Q, Wang H F, Chen Y W, et al. 2004. Geochronological and geochemical constraint on the Cenozoic extension of Cathaysian lithosphere and tectonic evolution of the border sea basins in East Asia. Journal of Asian Earth Sciences, 24(2): 163-175.
DOI:10.1016/j.jseaes.2003.10.006 |
Zhu B Q, Wang H F, Mao C X, et al. 1989. Geochronology of and Nd-Sr-Pb isotopic evidence for mantle source in the ancient subduction zone beneath Sanshui basin, Guangdong Province, China. Chinese Journal of Geochemistry, 8(1): 65-71.
DOI:10.1007/BF02842215 |
Zhu G H, Wiens D A, Yang H F, et al. 2021. Upper mantle hydration indicated by decreased shear velocity near the southern Mariana trench from Rayleigh wave tomography. Geophysical Research Letters, 48(15): e2021GL093309.
DOI:10.1029/2021gl093309 |
 2023, Vol. 41


