 2023, Vol. 41
Institute of Oceanology, Chinese Academy of Sciences
Article Information
- LIU Guilin, NONG Xiuxiu, KOU Yi, WU Fang, ZHAO Daniel, YU Zongbing
- Assessment of typhoon storm surge disaster scale based on expansion model
- Journal of Oceanology and Limnology, 41(2): 518-531
- http://dx.doi.org/10.1007/s00343-022-2051-z
Article History
- Received Jan. 30, 2022
- accepted in principle Aug. 17, 2022
- accepted for publication Sep. 22, 2022


2 Dornsife College, University of Southern California, Los Angeles CA90089, USA;
3 Statistics and Applied Probability, University of California Santa Barbara, Santa Barbara CA93106, USA;
4 Department of Mathematics, Harvard University, Cambridge MA02138, USA;
5 State Key Laboratory of Coastal and Offshore Engineering, Dalian University of Technology, Dalian 116024, China
The South China Sea is one of the three major marginal seas in China, lies on the coast of South China, its long and winding coastline makes it the most devastated area by typhoon and storm surge disasters (Yin et al., 2019; Zhang et al., 2019). According to statistics (Dong et al., 2014; Zhang, 2019), the number of typhoons in the South China Sea and the Northwest Pacific accounts for 36% of the total number of typhoons in the world, taking the first place among the eight typhoon generating regions in the world. During 1950–2020, there had been 319 typhoons storm surges landed in the northern coastal areas of the South China Sea, with an annual average of 4.5 in counts. Among them, a typhoon storm surge water increment of 5.94 m was recorded at Nandu Station in Haikang County, Guangdong Province (July 22, 1980), which is the maximum water increment ever recorded in Chinese history. According to the "China Marine Disaster Bulletin" statistics, in 2014, the South China Sea district had encountered the most serious loss caused by a storm surge disaster in the past 21 years. In that year, the direct economic loss of the district amounted to 125.29 million yuan, accounting for 92.27% of the total direct economic loss of the whole country in that year, and the disaster had caused 6 people died (including missing), as shown in Fig. 1. "Rammasun" (the strongest typhoon appears in China since its landing in 1949) and the landing of "Hato" result in the disaster in South China Sea district in 2014, the maximum water increment during the disaster was 3.92 m and 4.95 m respectively. In 2008, the storm surge disaster in 3 provinces (Guangdong, Guangxi, and Hainan of China) caused the death of (including missing) 55 people, with 17 355 million yuan direct economic loss, accounting for about 90% of the national storm surge disaster losses in that year; among them, Guangdong province was the most severely affected, accounting for about 80% of the total loss. What can be learnt from that is the storm surge disaster should not be underestimated. At the same time, the northern coastal areas in the south of China are also facing a serious threat from storm surge disaster. For that reason, establishing an assessment system that can accurately evaluate storm surge disasters and determine the risk level to provide a direct reference basis for coastal city planning, emergency evacuation, hazard insurance, etc. is crucial and urgent (Zeng et al., 2017; Liu et al., 2019b, 2020; Chen et al., 2021).

|
| Fig.1 Main loss statistics of storm surge disaster in China and South China Sea area (2000–2020) Data source: China Marine Disaster Bulletin. |
Storm surge disaster assessment is the basis of its risk management (Wang, 2014; Xu et al., 2018). The assessment of its risk level is mainly carried out in terms of disaster-causing intensity and major disaster losses. In recent years, the major method used for disaster loss assessment is the indicator evaluation method (Guo and Li, 2018; Zhao et al., 2020). It is mainly based on economic loss, number of casualties, the number of people killed and injured, and the usage of various regression models (e.g., neural network (Feng and Liu, 2017), vector machines (Wang and Liu, 2018), etc.) to construct an evaluation system. The evaluation mechanism of indicator evaluation method is relatively simple. However, since it is based on disaster data, it is more suitable for post-disaster assessment. Starting from the causes and results of disasters, evaluation methods based on numerical simulation (ADCIRC model (Gao et al., 2012; Guo et al., 2020)) and GIS technology (Li et al., 2017; Wang et al., 2017b) are gradually proposed. Assessment based on probability statistics is a traditional assessment method widely used in engineering (Zhao et al., 2012, 2013), which can effectively avoid the problem of regional differences, which cannot be avoided in the classification of disaster factor intensity or disaster loss. The designing of water increment under the influence of storm surge was calculated by the extreme value model, and designing of water increment was used to map the storm surge disaster level (Hisamatsu et al., 2020). Wang et al. (2021) used the Gumbel distribution model and the Gumbel-logistic model to calculate the return period of water increment and the joint water increment-wave height return period, individually, and determined the storm surge intensity level based on the return period level. However, the potential influence of typhoon frequency on the return period is also significant, and it is far enough to analyze the intensity of the disaster factor alone. Liu et al. (2021) constructed Poisson-Gumbel distribution and Poisson-Weibull distribution successively for long-term extreme value prediction of wave height in typhoon-affected waters, and obtained better designing values, which were widely promoted and applied (Wang et al., 2013, 2017a; Liu et al., 2021; Zhang et al., 2021). Mínguez et al. (2013) proposed that the Pareto-Poisson distribution model gives a more accurate estimate of the regression level. Thus, it is necessary to consider the effect of typhoon frequency in the extreme value model when assessing the storm surge risk level.
The basis for using the extreme value model to derive the designing water increment is to conduct data sampling. According to Liu et al. (2016), the longer period of the input data, the more stable the designing results of storm surge water increment. However, due to the short years of hydrological observation in China, it is difficult to collect data. As a result, the sample sequence obtained by the traditional sampling method (the annual extreme value method) is often short. Moreover, the actual observation often occurs in a year when the second largest value is greater than the annual maximum value. In this case, if the annual extreme value method is used for sampling, the second largest value of the year will be eliminated, which leads to the observation data in waste. In contrast, the Peak Over Threshold model (POT model) can obtain more sample points by setting reasonable thresholds, and make greater use of the limited measured information (Liu et al., 2019c; Xu et al., 2019; Deng et al., 2021). In recent years, POT model theory is also widely used in risk analysis (Song and Wang, 2020; Zhang and Duan, 2020), vehicle and machinery (Yuan et al., 2016; He et al., 2019) insurance as well as, and other fields (Jaladri et al., 2021). Therefore, sampling based on POT theory is expected to obtain more effective data.
In addition to sampling, whether an appropriate extreme value distribution is selected to fit the sample series would largely affects the results of probability analysis. It is generally believed that the over-threshold sample approximation obeys the Generalized Pareto Distribution (GPD) (Chen et al., 2019). Petrov et al. (2019) showed that the GPD distribution is much more sensitive to thresholds than the maximum entropy method, and higher thresholds improve the rationality of model expansion (Mazas and Hamm, 2011). The GPD distribution improves the fit of the "thick tail" of the over-threshold sample, but does not optimize the fit of both the peak and the right tail (Wang et al., 2016; Liu et al., 2019a). In contrast, the classical extreme value distribution can describe the peaks of the samples better, but the tails of its probability density function exhibit a power function form, and the fit to the right tail of the data is obviously insufficient (Muraleedharan et al., 2016; Mackay and Johanning, 2018). If the classical extreme value distribution can be effectively combined with the generalized Pareto distribution, it will be the key to improve the fitting accuracy. Aljarrah et al. (2014) proposed a method to generate a generalized cumulative distribution function of continuous distribution functions—the theory of family of distribution functions. Based on this theory, many scholars have constructed various combinatorial forms of this type of extreme value expansion. For example, Ganji et al. (2016) constructed the Weibull-Rayleigh distribution, and Alzaatreh et al.' s(2012, 2013) Gamma-Pareto distribution and Weibull-Pareto distribution.
Based on above analyses, this paper proposes to construct a typhoon storm surge disaster rating assessment system based on the POT theory and the composite extreme value expansion model, in order to improve and enhance the scientificity of the assessment model in terms of both data sampling and extreme value distribution. Specifics: firstly, a new sample series is obtained by sampling in the POT method. Then, with the method of generating a family of distribution functions proposed by Aljarrah et al. (2014), the Weibull and Pareto distributions are effectively combined to form an extreme value expansion model to improve the fitting of the thick tail of the sample distribution. Then, the Poisson-Weibull-Pareto composite extreme value expansion model is constructed based on the composite extreme value theory by considering the influence of typhoon frequency on the level of return period. The design value of the multi-year water increment calculated by the new model is also used as the standard for typhoon storm surge level zoning. Finally, the zoning results are compared with those evaluated based on the criteria of the SOA (2012) for the 10 typhoon storm surges that made landfall in the Guangdong area during 2010–2020.
2 CONSTRUCTION OF RATING EVALUATION SYSTEMThe construction of typhoon storm surge disaster level assessment system is mainly divided into three stages: sampling stage, calculation of designing water increment stage, and level zoning stage. The sampling process mainly conduct based on the peak over threshold theory, which is extracted from the original data series after setting a reasonable threshold to obtain a new sample series. The second stage is taking advantage of a composite extreme value expansion model constructed to calculate the multi-year designing water increment. The last stage is the delineation partition of the risk level based on the values from different return periods.
2.1 Threshold sampling criteria determinationPeak over threshold (POT) is a sampling method that selects a fixed larger value as the "threshold" through a certain method or technical means, and selects the points that meet or exceed this "threshold" to form a new sample series. In order to ensure a scientific and reasonable analysis sample, this paper adopts a relatively objective and quantitative sampling method. That is: based on the mean excess function of Pareto distribution, draw the average remaining life of the water increment series, and then determine the threshold value by observing the starting and ending position of the straight line segment on the graph.
If the water increment X(x>0) obeys the Pareto distribution, its cumulative density function is
 (1)
(1)Its probability density function is
 (2)
(2)where α and σ are the shape and scale parameter, respectively.
At this point, the mean excess function e(u) of the Pareto distribution can be determined as
 (3)
(3)That is, there is a linear correlation between e(u) and u. where u is the threshold value of u∈D(α, σ), σ < 1. E(x–u|x>u) is the expectation of over the threshold excess. According to the above equation, a scatter plot of the mean value of the threshold u and the observed excess (x–u|x>u) (called the mean excess) can be made. When the shape parameter σ is stable, the graph is approximated as a straight line. That is, when the threshold u is the horizontal axis and the mean excess is the vertical axis, the slope and intercept of the line are 

In particular, the average excess function en(u) for samples x1, x2, ···, xn can then be expressed as
 (4)
(4)At this point, the average remaining life can be plotted according to {(u, en(u)), u < xn}, the linear variation of en(u) after the threshold u0 can be analyzed, and if the slope of en(u) can be approximately constant, then u0 is considered as the optimal threshold. In addition, the scale parameter α and shape parameter σ of the Pareto distribution can be estimated using the maximum likelihood estimation method (MLE) method within a reasonable threshold range. When the parameters α and σ are stable, u0 can be considered the optimal threshold.
2.2 Composite extreme value expansion model—threshold embodied extreme value expansion model constructionThe construction of the extreme value expansion model is based on a family of distribution functions as the underlying theory. The method of construction is to combine two extreme value distribution functions so that they add additional parameters to the existing distribution. In this paper, the statistical properties of the random variable X are discussed in terms of the auxiliary variable T. The family of continuous function probability distributions is constructed as follows.
Theorem 1 Let the random variable T be a continuous random variable defined on the interval [a, b] with r(t) as the probability density function, -∞ ≤a < b≤+∞, x be a random variable with h(x) as the probability density function and the distribution function H(x), and there exists a distribution function G(x)
 (5)
(5)This family of probability function distributions is called the extreme expansion mode, and is denoted as the extreme extension distribution (EED) mode.
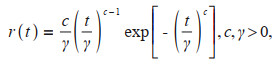
Specifically, if the marine environment is to be T defined on the interval [a, b] and obeys the generalized extreme value distribution (GED) R(t), -∞≤a < b≤+∞, with r(t) being the probability density function of the random variable T.
 (6)
(6)in which, ξ is the shape parameter; σ1 is the scale parameter.
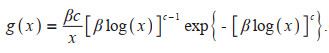
The random variable X obeys a Pareto distribution with a distribution function of H(x) and a probability density function h(x) = ασαx-α–1, α > 0, x≥σ > 0, where α is the shape parameter and σ is the scale parameter and also the threshold value. Then the probability density function g(x) corresponding to the distribution function G(x) can be expressed as
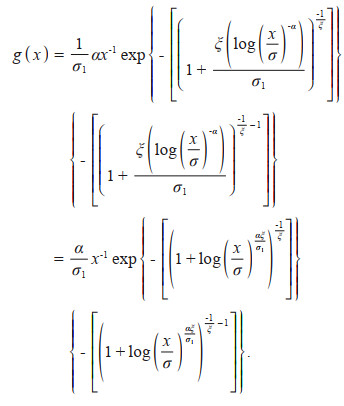 (7)
(7)Here, α represents the shape parameter of Pareto distribution, and ξ is the shape parameter in generalized extreme value distribution.
Let α/σ1=β. The above equation can be simplified
 (8)
(8)Name the Eq.8 as the GED-Pareto distribution, with the notation as EED (β, σ, ξ).
In fact, the generalized extreme value distribution is a collective term for three typical extreme value distributions, which are the Gumbel distribution, the Weibull distribution and the Frechet distribution. Distributions of the maximum values of independent random variables basically converge to these three types of extreme value distributions.
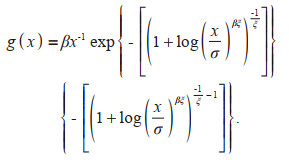
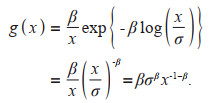
The Weibull distribution is also known as the extreme type Ⅲ distribution, when
 (9)
(9)then the probability density function
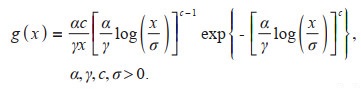 (10)
(10)Let α/γ=β, then the simplification gives
 (11)
(11)Name the Eq.11 as the Weibull-Pareto distribution with the notation EED-Ⅰ type (c, β, σ).
The probability density of EED-Ⅰ with different parameters is shown in Fig. 2.

|
| Fig.2 Probability density function plot of EED-Ⅰ type distribution with different parameters |
In particular, it has the following two special cases.
(1) When σ=1, Eq.11 becomes:
 (12)
(12)At this point, it becomes a logarithmic Weibull distribution.
(2) When c=1, Eq.11 becomes:
 (13)
(13)At this point, the Weibull-Pareto distribution also degenerates to the Pareto distribution.
The design parameters of various marine environmental elements in the sea affected by typhoons and storm surges are usually calculated in the way of composite extreme value distribution. It is a distribution pattern formed by the discrete distribution of typhoon frequency and the continuous distribution of various marine environmental elements under the influence of typhoons.
If n denotes the frequency of typhoons and obeys the Poisson distribution, then
 (14)
(14)where G(x) in the above equation can be any kind of one-dimensional continuous distribution.
If the newly constructed extreme expansion model is calculated by substituting into Eq.14, the composite extreme expansion model Poisson-EED-Ⅰ type is obtained.
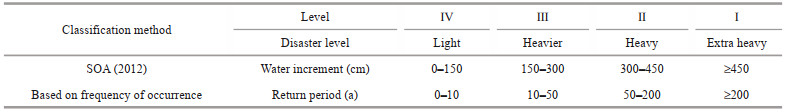
2.3 Storm surge risk classificationAs the storm surge risk classification criteria, China's State Oceanic Administration (SOA) has given a classification scheme based on storm surge in the technical guidelines for its disaster assessment and zoning in 2012 (SOA, 2012) (Table 1). Since there are significant differences in storm surge disasters in different regions, the size of storm surge is affected by various factors, especially by microtopography, and storm surge may vary by tens or even hundreds of centimeters in different river sections in the same estuary. Therefore, it is not possible to avoid regional differences by directly using the intensity of the causative factor (storm surge) as an indicator for risk classification. The frequency of occurrence is a measure of the likelihood of disaster occurrence, and the frequency of disaster occurrence is an important indicator of its severity, which can objectively reflect the regional disaster risk and avoid the above problems. In this paper, a typhoon storm surge classification scheme based on frequency of occurrence is given (Table 1), and different levels of annual occurrence are used to portray the disaster level of different regions, the higher the frequency, the shorter the return period, the higher the level, and the lighter the disaster level.
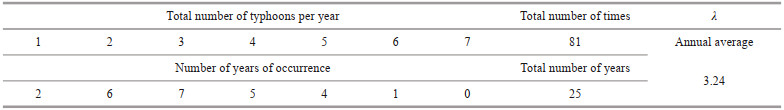
Typhoon and storm surge disasters happen frequently in the South China Sea region of China. Guangdong Province, bordering the South China Sea, is one of the hardest hit areas in China suffering from the devastating threat of typhoon and storm surge disasters. Among them, typhoon and storm surge disasters occur most frequently in western Guangdong and Zhujiang port area, with an average of three times per year. Therefore, in this paper, the western part of Guangdong is selected as the study area, and the data of water increment and typhoon statistics of Naozhou Hydrological Observatory for a total of 25 years from 1990 to 2016 (missing 2004 and 2007) are selected as the original data for the study. The statistics of the frequency of typhoon disasters in the western part of Guangdong are shown in Table 2; the frequency of typhoons is consistent with the Poisson distribution by χ2 test, and the parameter λ of Poisson distribution is 3.24 (the Naozhou Hydrological Station is located on the northeast coast of Naozhou Island, with the coordinates 110.550 0°E and 20.900 0°N).
In this paper, the average remaining life of over-threshold water increment samples was plotted based on the mean excess function of the Pareto distribution, and the values of the thresholds were analyzed and determined in combination with the shape and scale parameter stability plots (Fig. 3).

|
| Fig.3 Average remaining life diagram used to select the water increment threshold (a) with shape and scale parameter stability (b) The dashed lines in (a) represent the mean excess 95% confidence upper and lower limits. |
As shown above, under 95% confidence interval, the water increment threshold can be selected in range of 0.1–0.5 m according to the linear trend of the mean excess in the mean remaining life graph relative to the threshold. On this occasion, the determination of the specific value of the threshold still has a relatively large subjectivity. For this reason, the parameter stability assessment was introduced into the mean remaining life diagram method, and the stability was finally determined to be 0.24 m by combining the modified scale parameter (modified scale) and the maximum likelihood estimation of the shape parameter (shape), under the premise of ensuring the minimum sampling error of the POT method.
Now the extreme water increment data of Naozhou station for a total of 25 years are divided into two groups based on two different methods. Group A is the annual extreme water increment series from 1990 to 2016; Group B is the water increment over threshold series from 1990 to 2016 with a threshold value of 0.24 m, as shown in Figs. 4–5.

|
| Fig.4 Annual extreme water increment series |

|
| Fig.5 Over-threshold water increment series |
Comparing Fig. 4 with Fig. 5, it can be referred that the series length of the over-threshold sample is 140% longer than that the annual extreme sample series. The over-threshold sample contains more actual measured point data, allowing more valid observations to reflect useful information in the subsequent analysis.
The results of the test for the water increment series A and B using the K-S test are shown in Table 3.
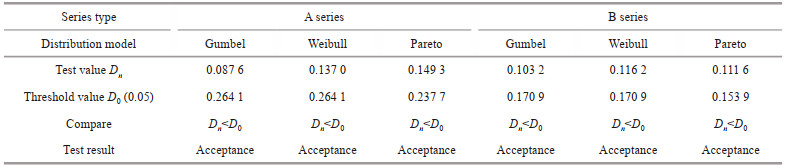
From the test results in Table 3, it is clear that both sets of water increment series passed the K-S test.
For further analysis, the following test plots of the extreme value distribution of the A and B water increment series samples were made (Figs. 6–7). The solid lines in the plots indicate the model curves and the circles indicate the data points.

|
| Fig.6 Distribution test of water increment in Group A |

|
| Fig.7 Distribution test of water increment in Group B |
Analysis of the test plots of the extreme value distribution of the water-increase samples of the A and B series shows that most of the data points in the Quantile-Quantile plot fall on the diagonal line, and some of them are more evenly scattered on both sides of the diagonal line, which shows that the observed data points and the model curve are in good agreement. From the return level plot, it can be seen that the data points are completely distributed within the 95% confidence interval of the return level of the model.
In summary, the analysis shows that the selected water increment data sets are in good agreement with each extreme value distribution model and can be used as samples for the marginal analysis of the new distribution.
In general, the skewness coefficient S and kurtosis coefficient K can be used to describe the degree of symmetry and the tail shape of the random sample distribution, respectively. Specifically, they can be defined as the third and fourth central moment of the sample. If the sample has a positive S value, the sample distribution is right-skewed, while the opposite is left-skewed; if the K value of the sample is greater than 3.0, the probability distribution of the sample is "spiky and thick-tailed", which means that more extreme values of the random sample are located in the tails of the sample distribution. Table 4 shows the kurtosis coefficient K and skewness coefficient S for the water increment samples.
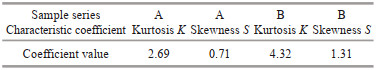
The kurtosis value greater than 3 in Table 4 is for the over-threshold sample, while the kurtosis value of the annual extreme sample is less than 3, indicating that the over-threshold sample has the characteristic of "sharp peak and thick tail". In terms of skewness: both samples are positively skewed (right skewed), and the skewness value of the over-threshold sample is much larger than that of the annual extreme value sample. This also indicates that the right skewness of the over-threshold sample is more pronounced.
To further analyze the samples and compare the distribution models, the sample histograms and the probability density curves of the fitted samples for each distribution are plotted in the same figure (Fig. 8). The left and right plots in Fig. 8 show the distribution test plots for the A (annual extremes) water increment series and B (over-threshold) water increment series, respectively. From the test results: compared to the left panel, the peak form of the probability density distribution curve in the right panel is still present and the peaks are larger overall. The right tail of the probability density curves of Gumbel distribution and Weibull distribution in the right figure shows the form of power function, which quickly converges to a small probability; while the right tail of the probability density function curve of EED-Ⅰ type has a longer and slower convergence fit. This demonstrates that the Weibull-Pareto distribution is more conducive to fitting the "thick tail" due to the characteristics of "peaks and thick tails" become more pronounced after sampling with the threshold method.

|
| Fig.8 Test plots for each distribution of A and B water increment series |
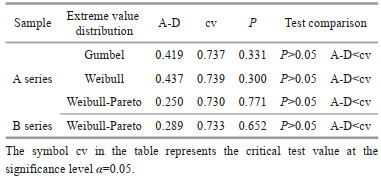
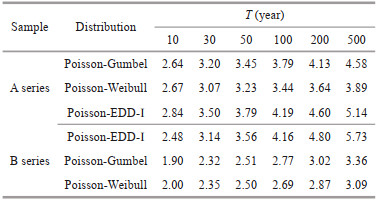
The POT method can extract as much effective information as possible from the observed data, but only when the sampling method is chosen properly to the corresponding statistical model that one can have a good fitting effect. Since there are few distribution models applicable to over-threshold samples and the computational accuracy of the existing models needs further engineering verification, the following is to verify the reasonableness and applicability of the over-threshold Weibull-Pareto model, which reference to the computed results of Gumbel, Weibull, and Weibull-Pareto distributions based on annual extreme data. The results of the goodness-of-fit tests for each distribution type under each sampling series are shown in Table 5. The results of the designing water increment calculation are shown in Table 6.
|
The goodness-of-fit test results in Table 5 show that each extreme value distribution passed the A-D test. According to the criterion of "the optimal distribution corresponds to the smaller A-D value", the Weibull-Pareto distribution is in good agreement with the distributions of the annual extreme water increment sample and the over-threshold water increment sample, respectively.
The Poisson-Weibull-Pareto model exhibits a significant "thick tail" in fitting the annual extreme water increment, i.e., the result of new model is significantly larger than the other two extreme models when the return period is greater than 50 years. Comparing the results of A and B series, we found that the difference between the Poisson-EDD-Ⅰ distribution based on B sample series (POT) and A sample series annual maximum (AM) was not significant, with the difference ranging from 0.72% to 12.68%. In contrast, the variation in the proportion of the difference between the calculated for Poisson-Gumbel distribution is 26.64%–28.03% and Poisson-Weibull distribution is 20.57%–25.09%, successively, both with relatively large differences. This suggests that it is more appropriate to use the Weibull-Pareto distribution to analyze the over-threshold sample series. Meanwhile, the Poisson-EDD-Ⅰ distribution has more stable results based on both samples. This also indirectly reveals that the extreme value expansion model has stronger applicability than the classical extreme value distribution when facing the variation of the sample series.
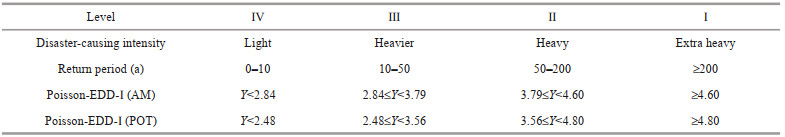
In summary, this paper will select the multi-year water increment design value based on the Poisson-EDD-Ⅰ distribution model as the criteria for typhoon storm surge risk classification, as in Table 7.
The water increment extremes during the landfall of typhoon storm surges that made landfall in the Guangdong area between 2010 and 2020 were selected (see Table 8). Based on the above classification criteria, the risk classification of the 10 typhoon storm surges will be made. The results of the zoning are shown in Table 8 and Fig. 9.


|
| Fig.9 Classification results of 10 typhoon storm surge risks |
Although there are some differences in the designing water increment obtained based on different sample series, the results of the typhoon storm surge risk classification are generally consistent when the risk level is divided into zones. Figure 9 and Table 8 show that the peak-value of surge of the five typhoon storm surges, including Chandu, were all less than the 10-year recurrence level, with a risk level of grade Ⅳ. And according to the classification criteria of the SOA (2012), their disaster level is Ⅲ. In addition, according to the division criteria of the SOA (2012), the extreme value of water increment less than 1.5 m is disaster level Ⅳ. And the water increment value of 1.5 m is less than the design value of 5-year increase based on the Poisson-EED-Ⅰ extrapolation model. This shows that the classification criteria of SOA (2012) are more conservative and safer when classifying low-risk areas. The classification results of No. 1409 Rammasun and No. 1415 Kalmaegi, based on the return period, are roughly the same as those in SOA (2012), which are Ⅱ and Ⅰ, individually. In another word: in the high-risk areas, the assessment grade results based on the return period are more consistent with those of the State Oceanic Administration. Among them, the extreme value of water increment in Kalmaegi exceeds the 200-year return level of water increment.
4 CONCLUSIONBased on the transcendental threshold theory, combined extreme value distribution theory, and compound extreme value theory, the typhoon storm surge rating evaluation system proposed in this paper is suitable for determining the intensity of the typhoon storm surge in the west Guangdong sea area and it has certain reference significance for moisture-proof mitigation in other coastal areas in China. Here are the main conclusions drawn from this study:
(1) The use of POT sampling can make fully and more effectively use of the limited measured information to obtain more extreme sample point data and data analysis information, and avoid the influence of the annual cycle on the inter-annual variation of the extreme sample.
(2) Over-threshold samples tend to have "peaks and thick tails". Compared with the classical extreme value distribution, the Weibull-Pareto distribution can better fit such samples. When different sampling methods are used and the length of the sample series varies, the extreme value expansion model is more applicable than the classical extreme value distribution, and the imputed design values are more stable.
(3) Example analysis on typhoon storm surge classification shows that the classification criteria of the SOA (2012) are more conservative when classifying low-risk areas. In contrast, in the high-risk area, the results of the return period-based classification assessment are more consistent with those of the State Oceanic Administration.
5 DATA AVAILABILITY STATEMENTThe datasets generated during and/or analyzed during the current study are available from the corresponding author on reasonable request.
Aljarrah M A, Lee C, Famoye F. 2014. On generating T-X family of distributions using quantile functions. Journal of Statistical Distributions and Applications, 1(1): 2.
DOI:10.1186/2195-5832-1-2 |
Alzaatreh A, Famoye F, Lee C. 2012. Gamma-Pareto distribution and its applications. Journal of Modern Applied Statistical Methods, 11(1): 78-94.
DOI:10.22237/jmasm/1335845160 |
Alzaatreh A, Famoye F, Lee C. 2013. Weibull-Pareto distribution and its applications. Communications in Statistics—Theory and Methods, 42(9): 1673-1691.
DOI:10.1080/03610926.2011.599002 |
Chen B Y, Kou Y, Wang Y F, et al. 2021. Analysis of storm surge characteristics based on stochastic process. AIMS Mathematics, 6(2): 1177-1190.
DOI:10.3934/math.2021072 |
Chen B Y, Zhang K Y, Wang L P, et al. 2019. Generalized extreme value-pareto distribution function and its applications in ocean engineering. China Ocean Engineering, 33(2): 127-136.
DOI:10.1007/s13344-019-0013-9 |
Deng W, Shang S F, Cai X, et al. 2021. An improved differential evolution algorithm and its application in optimization problem. Soft Computing, 25(7): 5277-5298.
DOI:10.1007/s00500-020-05527-x |
Dong J X, Li T, Hou J M, et al. 2014. The characteristics of temporal and spatial distribution of storm surge in Guangdong Province and storm surge hazard study at Yangjiang City. Acta Oceanologica Sinica, 36(3): 83-93.
(in Chinese with English abstract) DOI:10.3969/J.ISSN.0253-4193.2014.03.009 |
Feng Q, Liu Q. 2017. Pre-assessment for the loss caused by storm surge based on the SVM-BP neural network. Marine Environmental Science, 36(4): 615-621.
(in Chinese with English abstract) DOI:10.13634/j.cnki.mes.2017.04.021 |
Ganji M, Bevrani H, Hami Golzar N, et al. 2016. The Weibull-Rayleigh distribution, some properties, and applications. Journal of Mathematical Sciences, 218(3): 269-277.
DOI:10.1007/s10958-016-3028-2 |
Gao Z C, Yu M, Ding Z D. 2012. Typhoon storm surge risk assessment based on GIS—a case study of Taizhou. Marine Environmental Science, 31(3): 439-442, 447.
|
Guo H S, Guo W Q, Qiu J F, et al. 2020. Risk assessment of typhoon storm surge disaster in Jinshan District, Shanghai. Transactions of Oceanology and Limnology, (6): 18-26.
(in Chinese with English abstract) DOI:10.13984/j.cnki.cn37-1141.2020.06.003 |
Guo T J, Li G S. 2018. Research progress on pre-assessment of economic losses before storm surge disasters. Journal of Catastrophology, 33(4): 164-168.
|
He J L, Zhao X Y, Li G F, et al. 2019. Time domain load extrapolation method for CNC machine tools based on GRA-POT model. The International Journal of Advanced Manufacturing Technology, 103(9): 3799-3812.
DOI:10.1007/s00170-019-03774-3 |
Hisamatsu R, Tabeta S, Kim S, et al. 2020. Storm surge risk assessment for the insurance system: a case study in Tokyo Bay, Japan. Ocean & Coastal Management, 189: 105147.
DOI:10.1016/j.ocecoaman.2020.105147 |
Jaladri A S, Nurrohmah S, Fithriani I. 2021. Pricing catastrophe reinsurance risk premium using peaks over threshold (POT) model. Journal of Physics: Conference Series, 1725(1): 012086.
DOI:10.1088/1742-6596/1725/1/012086 |
Li T, Fu C F, Wang F D, et al. 2017. Storm surge disaster risk assessment and zoning, taking Cangnan County for instance. Procedia IUTAM, 25: 92-99.
DOI:10.1016/j.piutam.2017.09.014 |
Liu G L, Chen B Y, Jiang S, et al. 2019a. Double entropy joint distribution function and its application in calculation of design wave height. Entropy, 21(1): 64.
DOI:10.3390/e21010064 |
Liu G L, Chen B Y, Wang L P, et al. 2019b. Wave height statistical characteristic analysis. Journal of Oceanology and Limnology, 37(2): 448-460.
DOI:10.1007/s00343-019-8006-3 |
Liu G L, Cui K, Jiang S, et al. 2021. A new empirical distribution for the design wave heights under the impact of typhoons. Applied Ocean Research, 111: 102679.
DOI:10.1016/j.apor.2021.102679 |
Liu G L, Gao Z K, Chen B Y, et al. 2019c. Study on threshold selection methods in calculation of ocean environmental design parameters. IEEE Access, 7: 39515-39527.
DOI:10.1109/ACCESS.2019.2906935 |
Liu G L, Gao Z K, Chen B Y, et al. 2020. Extreme values of storm surge elevation in Hangzhou Bay. Ships and Offshore Structures, 15(4): 431-442.
DOI:10.1080/17445302.2019.1661618 |
Liu Y L, Feng J L, Jiang W S, et al. 2016. Effects of the tropical cyclone data set length on the result of risk assessment of storm surge. Haiyang Xuebao, 38(3): 60-70.
(in Chinese with English abstract) DOI:10.3969/j.issn.0253-4193.2016.03.006 |
Mackay E, Johanning L. 2018. Long-term distributions of individual wave and crest heights. Ocean Engineering, 165: 164-183.
DOI:10.1016/j.oceaneng.2018.07.047 |
Mazas F, Hamm L. 2011. A multi-distribution approach to POT methods for determining extreme wave heights. Coastal Engineering, 58(5): 385-394.
DOI:10.1016/j.coastaleng.2010.12.003 |
Mínguez R, Guanche Y, Méndez F J. 2013. Point-in-time and extreme-value probability simulation technique for engineering design. Structural Safety, 41: 29-36.
DOI:10.1016/j.strusafe.2012.10.002 |
Muraleedharan G, Lucas C, Guedes Soares C. 2016. Regression quantile models for estimating trends in extreme significant wave heights. Ocean Engineering, 118: 204-215.
DOI:10.1016/j.oceaneng.2016.04.009 |
Petrov V, Lucas C, Soares C G. 2019. Maximum entropy estimates of extreme significant wave heights from satellite altimeter data. Ocean Engineering, 187: 106205.
DOI:10.1016/j.oceaneng.2019.106205 |
Song R M, Wang C. 2020. Research on operational risk of commercial banks under the background of internet of things technology: based on peaks over threshold model. Financial Theory & Practice, (2): 75-81.
|
State Oceanic Administration of China (SOA). 2012. Guideline for Risk Assessment and Zoning of Storm Surge Disaster. State Oceanic Administration of China, Bejing.
(in Chinese)
|
Wang L P, Chen B Y, Chen C, et al. 2016. Application of linear mean-square estimation in ocean engineering. China Ocean Engineering, 30(1): 149-160.
DOI:10.1007/s13344-016-0007-9 |
Wang L P, Chen B Y, Zhang J F, et al. 2013. A new model for calculating the design wave height in typhoon-affected sea areas. Natural Hazards, 67(2): 129-143.
DOI:10.1007/s11069-012-0266-6 |
Wang L P, Huang G L, Chen Z S, et al. 2014. Risk analysis and assessment of overtopping concerning sea dikes in the case of storm surge. China Ocean Engineering, 28(4): 479-487.
DOI:10.1007/s13344-014-0039-y |
Wang L P, Xu X, Liu G L, et al. 2017a. A new method to estimate wave height of specified return period. Chinese Journal of Oceanology and Limnology, 35(5): 1002-1009.
DOI:10.1007/s00343-017-6056-y |
Wang N, Hou Y J, Mo D X, et al. 2021. Hazard assessment of storm surges and concomitant waves in Shandong Peninsula based on long-term numerical simulations. Ocean & Coastal Management, 213: 105888.
DOI:10.1016/j.ocecoaman.2021.105888 |
Wang Q, Che Z M, Guo J, et al. 2017b. Risk assessment and regionalization of storm surge disasters in Wenling. Ocean Development and Management, 34(10): 95-99.
(in Chinese with English abstract) DOI:10.20016/j.cnki.hykfygl.2017.10.020 |
Wang T T, Liu Q. 2018. The assessment of storm surge disaster loss based on BAS-BP model. Marine Environmental Science, 37(3): 457-463.
(in Chinese with English abstract) DOI:10.13634/j.cnki.mes.2018.03.023 |
Xu J C, Ren Q W, Lei B J. 2019. Anchoring bolt detection based on morphological filtering and variational modal decomposition. Transactions of Nanjing University of Aeronautics and Astronautics, 36(4): 628-634.
DOI:10.16356/j.1005-1120.2019.04.009 |
Xu J C, Ren Q W, Shen Z Z. 2018. Analysis method of impact echo based on variational mode decomposition. Journal of Vibroengineering, 20(7): 2593-2603.
DOI:10.21595/jve.2018.18912 |
Yin C T, Zhang J S, Xiong M J, et al. 2019. Trend analysis of typhoon and storm surge disaster on the South China Sea coast of China. Journal of Tropical Oceanography, 38(1): 35-42.
(in Chinese with English abstract) DOI:10.11978/2018037 |
Yuan W Z, Huang H Y, Zhang J P, et al. 2016. Vehicle load extreme value prediction and load effect based on POT model. Journal of Henan University of Science & Technology (Natural Science), 37(4): 36-40.
(in Chinese with English abstract) DOI:10.15926/j.cnki.issn1672-6871.2016.04.008 |
Zeng Y J, Xie Z H, Zou J. 2017. Hydrologic and climatic responses to global anthropogenic groundwater extraction. Journal of Climate, 30(1): 71-90.
DOI:10.1175/JCLI-D-16-0209.1 |
Zhang B S, Duan J. 2020. A research based on POT-caviar model of extreme risk measure. Applied Mathematics and Nonlinear Sciences, 5(2): 461-472.
DOI:10.2478/amns.2020.2.00040 |
Zhang H Y. 2019. Spatio-temporal distribution of typhoon storm surge along the South China Sea coast. Marine Forecasts, 36(6): 1-8.
(in Chinese with English abstract) DOI:10.11737/j.issn.1003-0239.2019.06.001 |
Zhang M, Luo J, Hu J L, et al. 2019. Inundation risk assessment of storm surge along Lei Zhou coastal areas. Journal of Tropical Oceanography, 38(2): 1-12.
(in Chinese with English abstract) DOI:10.11978/2018067 |
Zhang W X, Liang W Z, Zhang Z E, et al. 2021. Aerobic granular sludge (AGS) scouring to mitigate membrane fouling: performance, hydrodynamic mechanism and contribution quantification model. Water Research, 188: 116518.
DOI:10.1016/j.watres.2020.116518 |
Zhao L D, Dong S J, Bian C P. 2012. Research on storm surge disaster natural grade classification prediction simultaneous equation model. Chinese Fisheries Economics, 30(4): 79-83.
(in Chinese with English abstract) DOI:10.3969/j.issn.1009-590X.2012.04.012 |
Zhao L D, Dong S J, Bian C P. 2013. Storm surge disaster natural grade classification prediction simultaneous equation model. Marine Environmental Science, 32(1): 23-27.
(in Chinese with English abstract) |
Zhao W D, Zhang Z, Gu D M, et al. 2020. Coastal zone change and storm surge risk assessment in Wenzhou. Transactions of Oceanology and Limnology, (4): 53-60.
(in Chinese with English abstract) DOI:10.13984/j.cnki.cn37-1141.2020.04.007 |