 2023, Vol. 41
Institute of Oceanology, Chinese Academy of Sciences
Article Information
- ZHAI Rongwei, HUANG Caijing, YANG Wei, TANG Ling, ZHANG Wenjing
- Applicability evaluation of ERA5 wind and wave reanalysis data in the South China Sea
- Journal of Oceanology and Limnology, 41(2): 495-517
- http://dx.doi.org/10.1007/s00343-022-2047-8
Article History
- Received Jan. 30, 2022
- accepted in principle Mar. 28, 2022
- accepted for publication Aug. 22, 2022


2 Key Laboratory of Marine Environmental Survey Technology and Application, Ministry of Natural Resources, Guangzhou 510300, China;
3 South China Sea Marine Surveying and Technology Center, State Ocean Administration, Guangzhou 510300, China
Wind-wave research has scientific and societal significance (Stopa and Cheung, 2014b). The wind and wave are key components of the climate system and control energy fluxes between air-sea interface (Semedo et al., 2011; Yan et al., 2020) and upper ocean mixing (Babanin, 2006). Consequently, they influence the mechanisms of air-sea interaction (Babanin et al., 2009) and substantially influence global and regional climate systems (Fan et al., 2009; Zheng et al., 2013, 2019; Liu et al., 2017). Similarly, understanding wind and wave fields is crucial to coastal engineering design (Li and Dong, 2016; Mohapatra, 2016), coastal erosion (Monioudi et al., 2017; Postacchini et al., 2017), and maritime industries (Vanem and Walker, 2013). Most importantly, offshore electricity generation by harnessing wind and wave energy can provide inexhaustible energy sources without carbon emissions (Mirab et al., 2015; Amiri et al., 2016; Behzad and Panahi, 2017; Zheng and Li, 2017; Wan et al., 2018).
Previous wind and wave field studies have used data obtained through several techniques, including voluntary ship observations (Gulev and Grigorieva, 2004, 2006; Thomas et al., 2008), in-situ measurements at buoys (Menéndez et al., 2008; Niu and Feng, 2021), numerical modeling (Wang and Swail, 2006; Zhai et al., 2021), and satellite altimeters (Hemer et al., 2010; Young et al., 2011). Among such data, voluntary ship data have inconsistent quality (Thomas et al., 2008) and may lose extreme events owing to ship routing (Gulev et al., 2003). Buoy data are considered the most obvious and reliable source because they are collected from comprehensive in-situ measurements (Bromirski et al., 2005; Menéndez et al., 2008; Gemmrich et al., 2011); however, because of high instrumentation and maintenance costs, they are limited to discrete locations (Agarwal et al., 2013; Stopa and Cheung, 2014a) and often result in discontinuities in observed data. Numerical model data have high spatiotemporal resolution and continuity but are not practical to use in some regions. Satellite altimetry data have high spatial precision (Hemer et al., 2010; Young et al., 2011) and poor temporal resolution (Le Traon, 2013), leading to studies on long temporal scales and extreme events impracticable (Kumar and Naseef, 2015; Campos and Soares, 2016).
Reanalysis data have been generated using data assimilation techniques that combine numerical models with observation data (Bromwich and Wang, 2008; Saha et al., 2010; Shi et al., 2021) to produce atmospheric and ocean data with high spatial and temporal resolution, large covered areas, and sufficient duration (Semedo et al., 2011; Rascle and Ardhuin, 2013; Campos and Soares, 2016). Reanalysis data have greatly supplemented various sources of wind and wave data in regions without observation (Stopa and Cheung, 2014a; Kumar and Naseef, 2015). Although reanalysis data can cover a global region, localized data accuracy in some regions is beyond evaluation because of the lack of observed data. Moreover, as evaluating reanalysis data can enhance the confidence of an application; observational attention should be shifted to regions beyond evaluation, as a proper evaluation is a key process to improve reanalysis data accuracy, thereby enhancing weather forecasts (Cavaleri et al., 2012). Growing academic attention has led researchers to assess different reanalysis data worldwide (Caires et al., 2004; Caires and Sterl, 2005; Hersbach et al., 2020; Stefanakos, 2021) and in different localized zones (Stopa and Cheung, 2014a; Kumar and Naseef, 2015; Sharp et al., 2015; Campos and Soares, 2016).
The European Centre for Medium-Range Weather Forecasts (ECMWF) has a long history of reanalysis, with ERA5 being the fifth generation of ECMWF atmospheric and oceanic reanalysis (Hersbach et al., 2020). A performance assessment of ERA5 wave reanalysis data was performed with the observed data at several locations, such as near Chinese waters (Shi et al., 2021), the Arabian Sea (Bruno et al., 2020), and global regions (Hersbach et al., 2020; Patra et al., 2020; Stefanakos, 2021). The accuracy of the ERA5 wind and wave reanalysis data have not been evaluated in the South China Sea (SCS) owing to the lack of observational data. This study examines the application potential of this data source through a detailed and systematic comparison between the ERA5 wind and wave reanalysis data and the data from 15 buoys in the SCS. Here, we report on the differences between the two and their possible sources. In Section 2, ERA5 wind and wave reanalysis data, 15 sets of buoy data, and the methodology for evaluation and comparison used in this study are briefly described. Section 3 presents the results, and Section 4 presents a discussion. A summary is given in the Section 5.
2 DATA AND METHODOLOGY 2.1 Data 2.1.1 ERA5 wind and wave reanalysis dataERA5 reanalysis data, including wind and wave data, are the most updated reanalysis product of the ECMWF. ERA5 combines the model data with observations from across the world to get a complete and consistent global dataset using 4D-Var data assimilation and model forecasts in CY41R2 of the ECMWF Integrated Forecast System (IFS). The temporal coverage of the ERA5 reanalysis data is from 1979 to the present. The horizontal resolution of the ERA5 reanalysis data was 0.25°×0.25° for the wind data and 0.5°×0.5° for the wave data. The ERA5 reanalysis data provide hourly estimates for several atmospheric and ocean-wave quantities, of which 10-m zonal and meridional wind speed, significant wave height (SWH), and mean wave period (MWP) are used for this study.
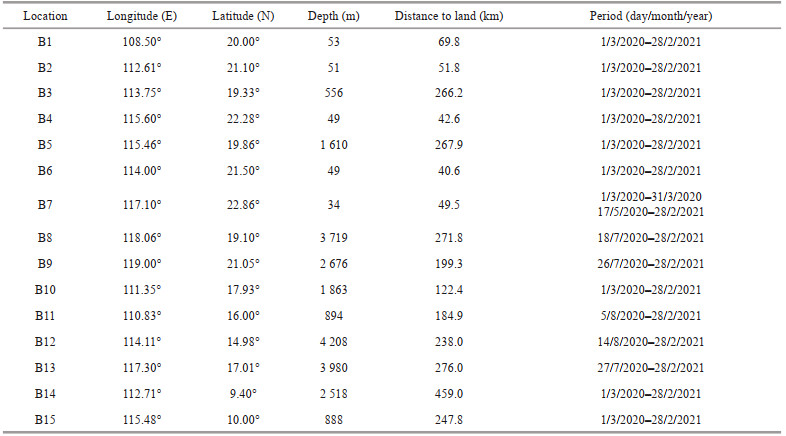
2.1.2 Buoy dataWind data (speed and direction) and wave data (SWH and MWP) were obtained by a wind monitor and wave sensor, respectively, from the 15 buoys deployed in the SCS (Table 1). The wind monitors (05106 model) are manufactured by R. M. Young Company, and accuracy of wind speed is ±0.3 m/s. The wave sensors (SBY 1-1 model) are manufactured by Institute of Oceanographic Instrumentation Shandong Academy of Sciences, and accuracies of SWH and MWP are ±(0.1+5% of reading) and ±0.5 s. Wind and wave data were recorded every hour, and singular and default values were eliminated prior to use. Singular values refer to abnormal data caused by observational instrument, often appear in the form of "999". And default values refer to invalid data, often appear in the form of "/". The detailed locations of the 15 buoys are shown in Fig. 1. The time span of the buoy observation data used in this study was from March 2020 to February 2021, except for B8, B9, and B13, which started in July 2020, and B11 and B12, which started in August 2020. According to Chinese Marine Industry Standard HY/T 0292 (2020), we divided the study area into seven parts (Fig. 1) for convenience of the analysis. The Beibu Gulf: south to the 18.16°N line and east to the line connecting Jiaoweijiao of Leizhou Peninsula and Lingaojiao of Hainan Island. The northwestern SCS: south to the 18.16°N line and east to 114.00°E line. The northeastern SCS: south to the 18.16°N line, west to 114.00°E line and east to 120.00°E line. The central-western SCS: the South China Sea area between 18.16°N to 14.00°N line and west of 114.00°E line. The central-eastern SCS: the South China Sea area between 18.16°N to 14.00°N line and east of 114.00°E line. The southwestern SCS: the South China Sea area between 108.02°E to 114.00°E line and south of 14.00°N line. The southeastern SCS: the South China Sea area of east of 114.00°E line and south of 14.00°N line. B1 is located in the Beibu Gulf (the Area 1), B2 and B3 are located in the northwestern SCS (the Area 2), B4–B9 are located in the northeastern SCS (the Area 3), B10 and B11 are located in the central-western SCS (the Area 4), B12 and B13 are located in the central-eastern SCS (the Area 5), B14 is located in the southwestern SCS (the Area 6), and B15 is located in the southeastern SCS (the Area 7). Although the Areas 1, 6, 7 only contain one buoy, which is exactly the same as the buoy verification results, it still has great reference value considering the insufficiency of observation data in the Areas 1, 6, and 7. The Area 1 is a typical semi-closed sea area and its area is smaller than the Areas 2–7. Although there is only one buoy in the Area 1, it is still very representative. The Areas 6 and 7 occupied the biggest area, and just using one buoy to study the regional characteristics is indeed not scientific enough. However, analysis results obtained by using the precious observation data can still improve our partial understanding of the regions. In this study, spring refers to March, April, and May; summer refers to June, July, and August; autumn refers to September, October, and November; and winter refers to December, January, and February.

|
| Fig.1 Map of the South China Sea (SCS) with the buoy locations (blue dots) Area 1: the Beibu Gulf; Area 2: the northwestern SCS; Area 3: the northeastern SCS; Area 4: the central-western SCS; Area 5: the central-eastern SCS; Area 6: the southwestern SCS; Area 7: the southeastern SCS. Map review No. GS(2019)1708. |
To evaluate the application potential of the ERA5 wind and wave reanalysis data, we compared the ERA5 wind and wave reanalysis data and the 15 sets of buoy data. The coincident period was determined from March 2020 to February 2021. Based on the location of the 15 buoys, the values of the ERA5 wind and wave reanalysis data at the same longitude and latitude were obtained via spatially linear interpolation. The error and difference metrics applied were as follows: bias (buoys data minus ERA5 data), root mean square error (RMSE), and correlation coefficient (COR). These metrics are calculated as follows:
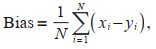 (1)
(1)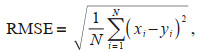 (2)
(2)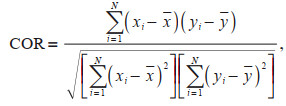 (3)
(3)where x represents buoy data values, and y represents ERA5 data values.
3 RESULT 3.1 Wind speedWe started with comparisons of the ERA5 wind speed reanalysis data with the buoy measurements. Generally, based on Figs. 2–6, the trend characteristics of the ERA5 wind speed data were consistent with the buoy measurements. Figures 2–4 show that the ERA5 data have weaker wind speed than the buoy measurements in B2, B4, B6, B7, and B9, which were in shallow water (less than 60 m) and close in the Luzon Strait. This was confirmed by the positive biases in Table 2. However, the ERA5 data slightly overestimated wind speed in February 2021 at B12 and B13, located in the central-eastern SCS. The quantitative results showed that average wind speeds are larger in the winter season (December to February) than in other seasons at all locations, except for B1, B2, B4, B6 where larger values occurred in the autumn season.

|
| Fig.2 Time series of wind speed between the ERA5 and buoy data at B1 (a), B2 (b), and B3 (c) |

|
| Fig.3 Time series of wind speed between the ERA5 and buoy data at B4 (a), B5 (b), and B6 (c) Black dashed frame represents the example of sudden attenuation in wind speed. |

|
| Fig.4 Time series of wind speed between the ERA5 and buoy data at B7 (a), B8 (b), and B9 (c) |

|
| Fig.5 Time series of wind speed between the ERA5 and buoy data at B10 (a), B11 (b), and B12 (c) Black dashed frame represents the example of sudden enhancement in wind speed. |

|
| Fig.6 Time series of wind speed between the ERA5 and buoy data at B13 (a), B14 (b), and B15 (c) |
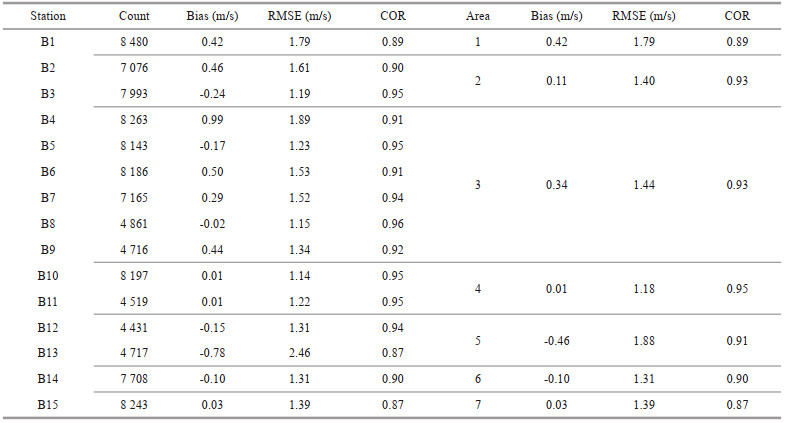
Figure 7 shows the histograms of wind speed between the ERA5 and buoy data. Number of occurrences of wind speed of the ERA5 and buoys data showed shape with a single significant peak at all buoy locations, except for B13 where showed a double-peak shape. The values of peak in the B8 and B9 (Fig. 7h–i) were more than 10 m/s, which is probably due to the proximity to the Luzon Strait. The values of double-peak in B13 (Fig. 7m) were 3 m/s and more than 10 m/s, and the values of peak in other locations were about 5 m/s. Wind speed of the ERA5 and buoy data showed essentially consistent distribution characteristics, but number of occurrences of maximum and minimum wind speed in the ERA5 data were less than those in the buoy data, and the opposite appears near median wind speed. Especially in B1, B2, B4, B6, and B7, which were in shallow water (less than 60 m), the ERA5 data obviously underestimated larger wind speed than that of the buoy-measured data. It seems that the ERA5 data have a poor effect in simulating maximum and minimum wind speed.

|
| Fig.7 Histograms of wind speed between the ERA5 and buoy data |
Table 2 shows the statistical comparison results of wind speed between the buoy and ERA5 data. The range of bias values in the study area was -0.78– 0.99 m/s. Bias values of B8, B10, B11, and B15 showed near-zero differences in wind intensity. The ERA5 data in B3, B5, B12, B13, and B14 overestimated wind speed more than 0.1 m/s than that of the buoy-measured data. On the contrary, in B1, B2, B4, B6, B7, and B9, the ERA5 data underestimated wind speed by more than 0.29 m/s compared to the buoy-measured data. It can be concluded that the ERA5 data underestimated wind speed in the Beibu Gulf, shallow water areas (less than 60 m), and locations close to the Luzon Strait. Additionally, for other locations in the SCS, the wind speed errors between the ERA5 and buoy data were relatively small. The RMSE value was between 1.14 and 2.46 m/s, with RMSE value in B13 being the largest (2.46 m/s). The correlation coefficient in B13 was the smallest (0.87), and aside from B1, B13, and B15, the correlation coefficients of wind speed between the ERA5 and buoy data were more than 0.9.
We divided the study area into seven parts in the Section 2 (Fig. 1), and Table 2 shows the statistical comparison results of wind speed between the ERA5 and buoy data to study the general characteristics of seven areas. The bias values of Areas 4 and 7 showed near-zero differences in wind intensity. The bias values of Areas 1–3 were positive and larger than 0.1 m/s which illustrates that the ERA5 data were underestimated wind speed in the Beibu Gulf, northwestern and northeastern SCS. In addition, the bias values of Areas 5–6 were negative, which illustrates that the ERA5 data were overestimated wind speed in the central-eastern and southwestern SCS. The RMSE values of seven areas were between 1.18 and 1.88 m/s. Moreover, the correlation coefficient of wind speed in the southeastern SCS reached the minimum (0.87), meanwhile the values in the central-western SCS reached the maximum (0.95).
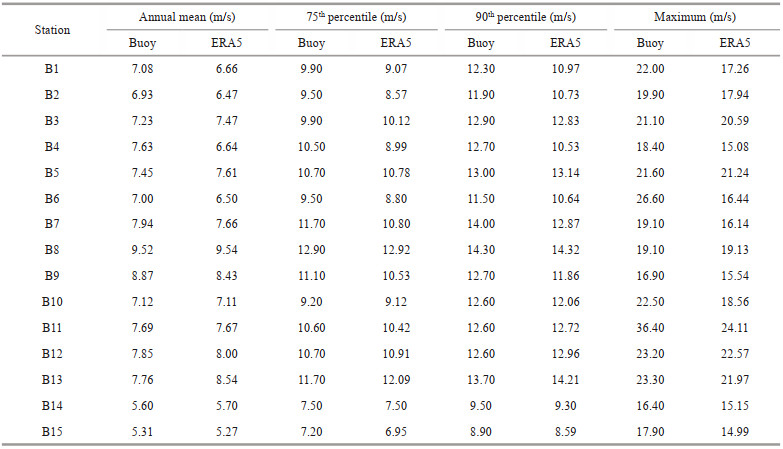
Table 3 shows the annual mean, the 75th and 90th percentiles, and the annual maximum of wind speed from the buoy and ERA5 data. In B3, B5, B12, and B14, annual mean wind speed overestimations in the ERA5 data were less than 3%, but such overestimation in B13 was 10%. For other locations, the underestimations of annual mean wind speed in the ERA5 data were less than 7%, except for B4, with an underestimation of 13%. The error of ERA5 annual mean wind speed data were relatively small and which can adequately describe the wind-speed characteristics in most of the SCS. Compared with the annual mean wind speed error, the error of the 75th and 90th percentile wind speed between the ERA5 and buoy data was minimal. Additionally, the ERA5 data underestimated annual maximum wind speed in the SCS between 2% and 38%. Annual maximum wind speed underestimation in the ERA5 data were less than 10% in B2, B3, B5, B8, B9, B12, B13, and B14, namely in the northwestern, central-eastern, and southwestern SCS, and in locations near the Luzon Strait. In other locations, the underestimation was more than 15%, reaching up to 38% in B6. From this data, we concluded that the ERA5 wind speed data can be used for wind analyses in the SCS, except under extreme conditions. Additionally, maximum wind speed underestimations may further lead to maximum SWH underestimations, which will be explored further in next section.
|
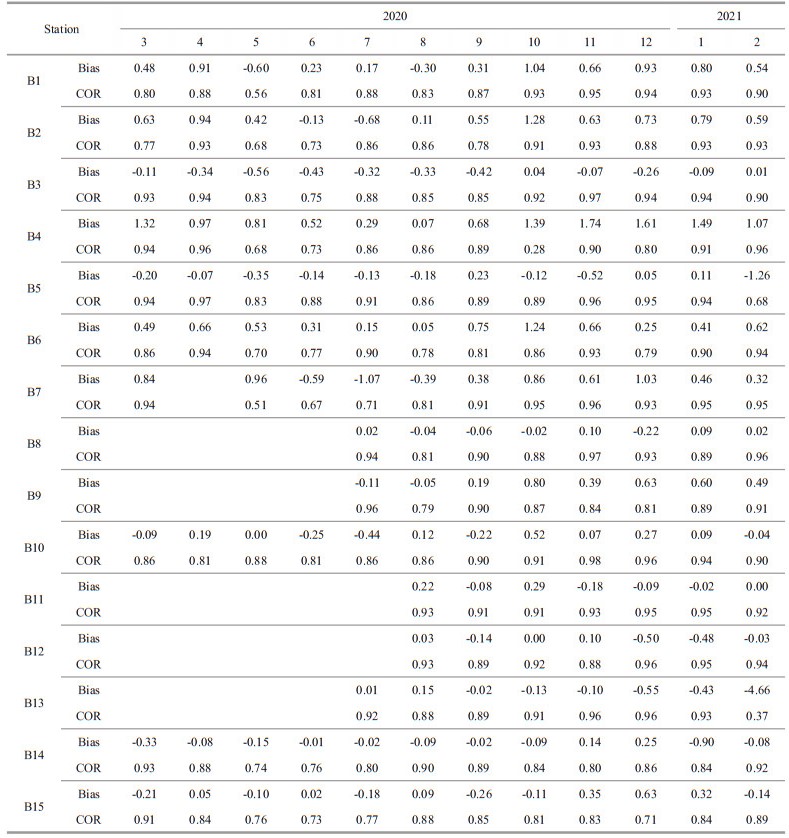
The time variation distribution of the maximum bias value of the wind speed between the buoy and ERA5 data showed multi-seasonal characteristics (Table 4). The maximum bias values for B1, B2, B4, B6, B8, B9, and B11 appeared in autumn (October and November), while those for B5, B10, B12, B13, B14, and B15 occurred during winter, and those for B3 and B7 occurred in summer. Notably, these months with the maximum bias values did not correspond to minimum correlation coefficients. The minimum correlation coefficients for B1, B2, B3, B6, B7, B10, and B14 appeared in May and June during the spring to summer monsoon transition, and for other locations, the minimum correlation coefficient values were mainly concentrated in autumn and winter.
|
SWH was used to denote the characteristic height of random waves in the sea state. The time series of SWH between the ERA5 and the buoy data at different locations (B1–B15) are shown in Figs. 8–12. It can be concluded that the ERA5 SWH data were virtually consistent with the measured SWH data for most buoy stations. However, the ERA5 data slightly underestimated SWH from October 2020 to February 2021 in B2, B4, B7, and B9, which are located in shallow water (less than 60 m) and close to the Luzon Strait. In addition, the SWH in B14 from mid October 2020 to February 2021 was overestimated by the ERA5 data.

|
| Fig.8 Time series of SWH between the ERA5 and buoy data at B1 (a), B2 (b), and B3 (c) The magenta and black dashed frames represent the influence time of cold air event and Typhoon NURI, respectively. |

|
| Fig.9 Time series of SWH between the ERA5 and buoy data at B4 (a), B5 (b), and B6 (c) The magenta, black, and green dashed frames represent the influence time of cold air event, Typhoons NURI, and HIGOS, respectively. |

|
| Fig.10 Time series of SWH between the ERA5 and buoy data at B7 (a), B8 (b), and B9 (c) |

|
| Fig.11 Time series of SWH between the ERA5 and buoy data at B10 (a), B11 (b), and B12 (c) |

|
| Fig.12 Time series of SWH between the ERA5 and buoy data at B13 (a), B14 (b), and B15 (c) |
Figure 13 shows the histograms of SWH between the ERA5 and buoy data. The number of occurrences of maximum and minimum SWH in the ERA5 data were less than that in buoy data at almost all buoy locations, except for B14 where number of occurrences of maximum SWH in the ERA5 data were more that in buoy data. Especially in B2, B4, B6, and B7, which were in shallow water (less than 60 m), the ERA5 data obviously underestimated larger SWH than that of the buoy-measured data. Consistent with the characteristics of wind speed, the ERA5 data also need to improve the ability of simulating maximum and minimum SWH compared with the observed one.

|
| Fig.13 Histograms of SWH between the ERA5 and buoy data |
To quantitatively compare the ERA5 and buoy SWH data, we calculated the bias, RMSE, and COR of the two (Table 5). Statistical comparison results showed that absolute bias values were relatively small (less than 0.08 m), which means tiny differences in SWH intensity, except for B2, B4, B7, B9, and B14, whose values were larger than 0.15 m. This illustrates that the ERA5 SWH data were broadly consistent with the buoy measured SWH data in the SCS. All bias values were positive, except for those of B1 and B14. This result indicates that the ERA5 SWH data were smaller than the most buoy-measured one. The range of the local bias in the domain was between -0.24 and 0.28 m. The RMSE value for B14 was the largest (0.51 m), and its correlation coefficient was the smallest (0.84). The RMSE values of the other locations were no more than 0.41 m, and the correlation coefficients were all above 0.92, reaching up to 0.98 in B3, B5, B7, B12, and B13. The correlation coefficients were high, indicating SWH was very similar between the ERA5 and buoy data.
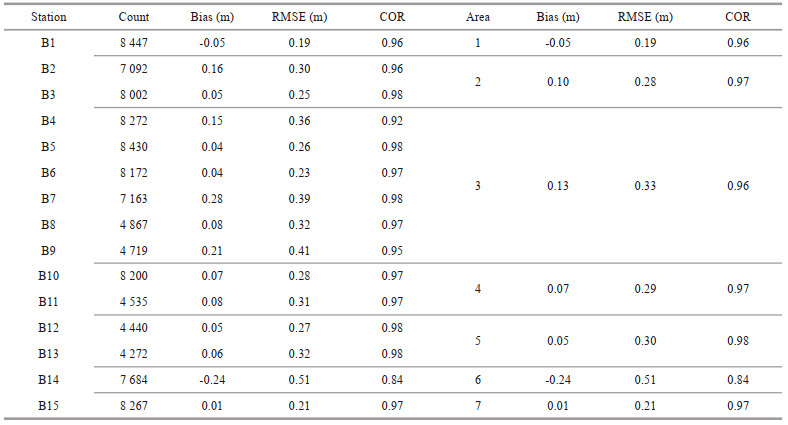
The bias values of Areas 1 and 6 were negative (Table 5), which illustrates that the ERA5 data were overestimated SWH in the Beibu Gulf and southwestern SCS. And bias values of other Areas were positive implying a general underestimation. The RMSE values of seven areas were between 0.19 and 0.51 m. In addition, the correlation coefficient of SWH in the southwestern SCS reached the minimum (0.84), and meanwhile the values in other areas were all above 0.96. In general, except for the southwestern SCS, the ERA5 SWH data showed a high correlation with the buoy-measured data in the SCS.
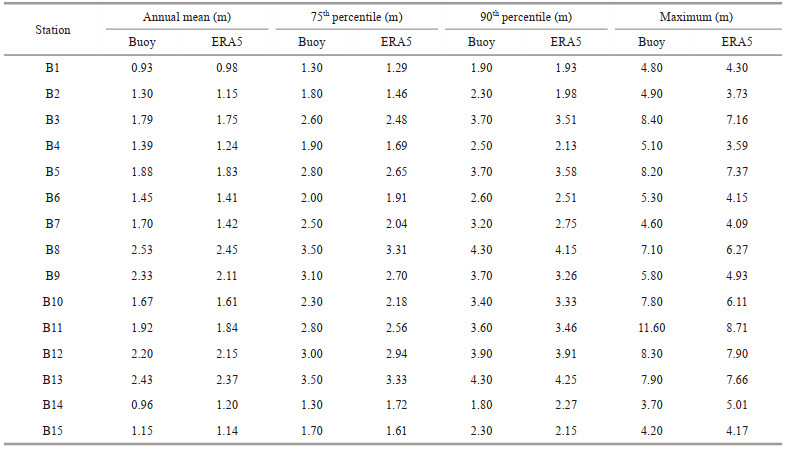
Table 6 provides the annual mean, 75th and 90th percentiles, and annual maximum of SWH from the buoy and ERA5 data. The results showed that annual mean SWH overestimation in the ERA5 data was 6% in B1 and up to 25% in B14; meanwhile, annual mean SWH underestimation in the ERA5 data was less than 5%, except for B2, B4, B7, and B9, which had values of 12%, 11%, 16%, and 9%, respectively. As such, the ERA5 data can be used for annual mean SWH analyses in most locations in the SCS, except in shallow water (less than 60 m), the Beibu Gulf, near the Luzon Strait and southwestern SCS. Variation in the 75th and 90th percentile SWH values between the ERA5 and buoy data for most observed locations were within 10%, except for B2, B4, B7, and B9 whose values were between 10% and 20%; similarly, for B14, the variation reached a maximum value of more than -20%. Additionally, the present study also revealed that annual maximum SWH underestimation in the ERA5 data were less than 5% in B12, B13, and B15, namely in the central-eastern and southeastern SCS. In other locations, annual maximum SWH underestimation in the ERA5 data was more than 10%. The ERA5 data still overestimated annual maximum SWH in B14, reaching up to -36%. Notably, in B1, although annual mean SWH in the ERA5 data were larger than the buoy data, it was smaller in annual maximum SWH. From this data, it seems that the ERA5 data may miss extreme waves in most areas of the SCS; thereby, the destructive force of surface waves in the SCS, especially under extreme conditions (such as typhoons), is underestimated when using the ERA5 data for analysis.
|
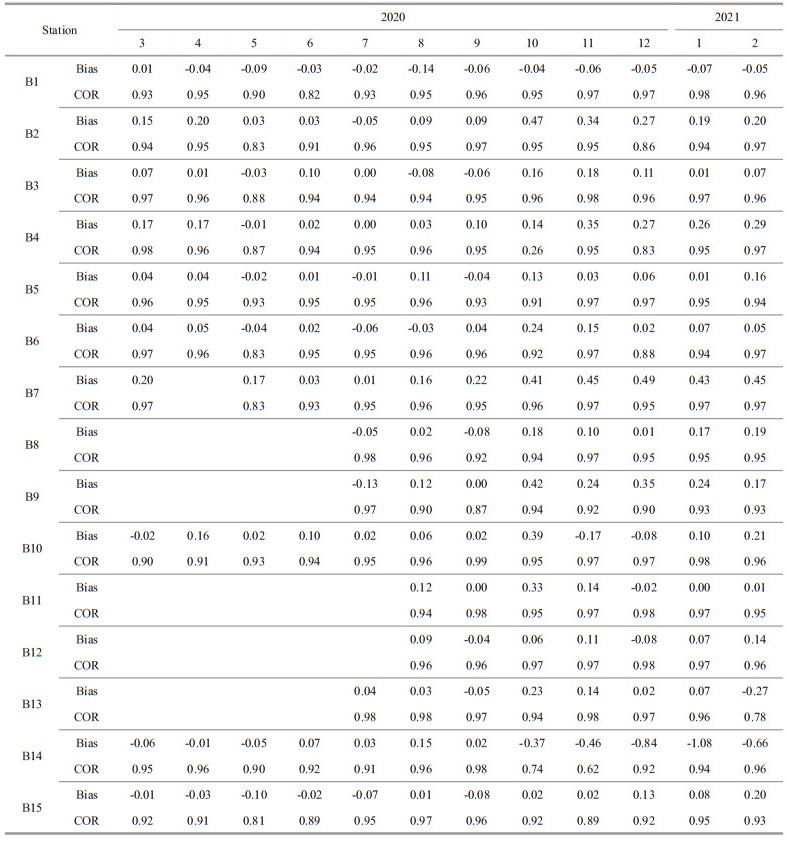
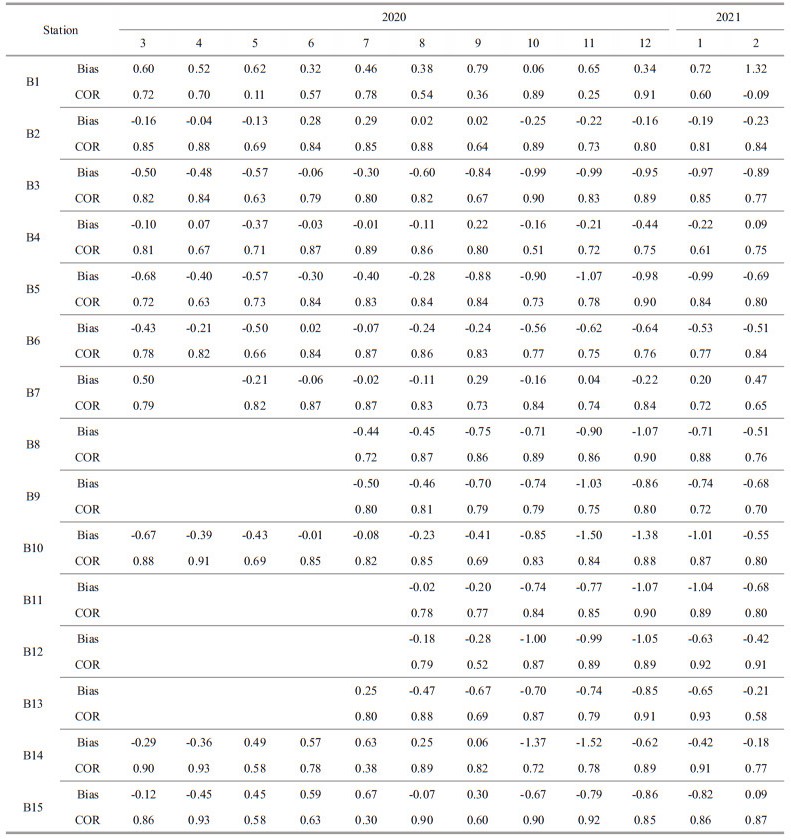
Table 7 shows the monthly bias and correlation coefficient of SWH between the buoy and ERA5 data to evaluate the change in data validity over a month. The maximum bias value of B1 appeared in summer (August). For B2, B3, B4, B6, B9, B10, and B11, the maximum bias values occurred in the autumn. The maximum bias values of the remaining locations occurred in winter. The month with the maximum bias value does not correspond to the minimum correlation coefficient. The minimum correlation coefficients of B1, B2, B3, B6, B7, and B15 appeared in May and June, indicating the lower data validity of the ERA5 SWH data in these locations during the spring to summer monsoon transition. Additionally, for B4, B9, and B14, the minimum correlation coefficients appeared during the autumn to winter monsoon transition (October, September, and November). For other locations, the correlation coefficients were relatively uniform, with more than 90% each month. In general, the ERA5 SWH data showed relatively poor applicability in the SCS during the monsoon transition.
|
MWP from the ERA5 and buoy data are compared. The time series of MWP between the ERA5 and buoy data at different locations are shown in Figs. 14–18. Figure 14a shows that the ERA5 data in B1 underestimated MWP but coincided with the buoy measured data at some point. In contrast, the ERA5 data in B3, B5, B6, B8, B9, B10, B11, B12, and B13 overestimated MWP. For B2, B4, and B7, MWP of the ERA5 and buoy data were very close. The ERA5 data in B14 and B15 underestimated MWP initially and then overestimated MWP.

|
| Fig.14 Time series of MWP between the ERA5 and buoy data at B1 (a), B2 (b), and B3 (c) |

|
| Fig.15 Time series of MWP between the ERA5 and buoy data at B4 (a), B5 (b), and B6 (c) |

|
| Fig.16 Time series of MWP between the ERA5 and buoy data at B7 (a), B8 (b), and B9 (c) |

|
| Fig.17 Time series of MWP between the ERA5 and buoy data at B10 (a), B11 (b), and B12 (c) |

|
| Fig.18 Time series of MWP between the ERA5 and buoy data at B13 (a), B14 (b), and B15 (c) |
Figure 19 shows the histograms of MWP between the ERA5 and buoy data. The number of occurrences of MWP of the ERA5 and buoys data showed shape with a single significant peak at all buoy locations. Number of occurrences of maximum MWP in the ERA5 data were more than that in buoy data at all buoy locations, except for B1 where showed the opposite characteristic, which indicates that the ERA5 data systematically exceeded the observation when simulating maximum MWP.

|
| Fig.19 Histograms of MWP between the ERA5 and buoy data |
The statistical results for the MWP analyses are shown in Table 8. These results show that the annual bias of MWP between the ERA5 and buoy data varied from -0.74 to 0.57 s. In addition, bias values were negative except for B1 and B7, indicating that the ERA5 data overestimated MWP in most of the SCS. The maximum RMSE value was found in B1, while the correlation coefficient reached the minimum value, indicating a poor fit between the ERA5 and buoy data. For other locations, the RMSE values ranged from 0.51 to 0.96 s and the correlation coefficients fluctuated within a narrow range from 0.82 to 0.90.
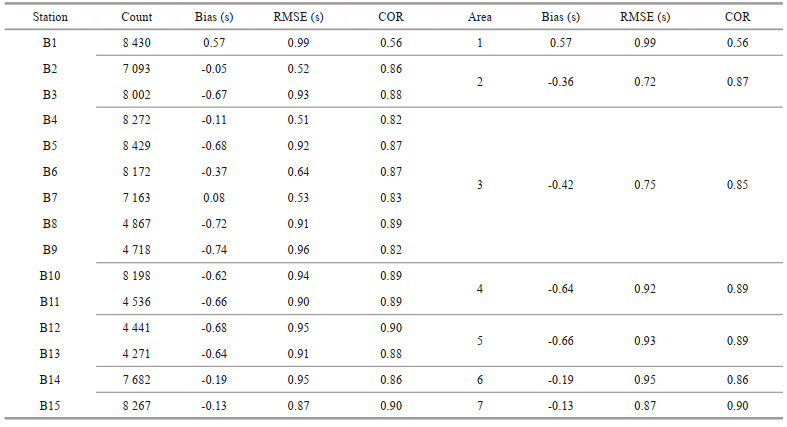
Except for the Beibu Gulf, bias values of other areas were negative (Table 8), which illustrates that the ERA5 data were overestimated MWP in the SCS. The RMSE values of seven areas were between 0.72 and 0.99 s. The RMSE value for the Beibu Gulf was the largest (0.99 s), and its correlation coefficient was the smallest (0.56). Meanwhile, the values in other areas were between 0.85 and 0.90. In general, the correlation between the ERA5 MWP and buoy-measured data in the SCS is not very high.
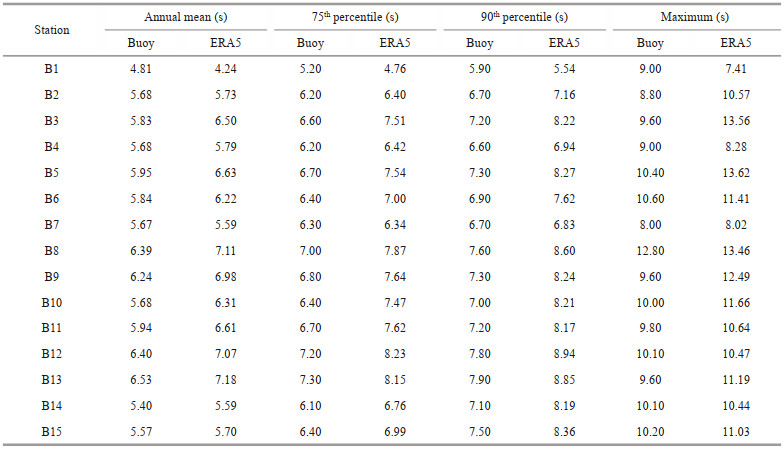
Table 9 shows annual mean, the 75th and 90th percentiles, and annual maximum of MWP from the ERA5 and buoy data. Annual mean MWP errors between the ERA5 and buoy data varied from -12% to 12%. The underestimation of the ERA5 MWP data in B1 and B7 was 12% and 1%, respectively. For B3, B5, B8, B9, B10, B11, B12, and B13, the ERA5 data overestimated MWP, and error fluctuated within a narrow range from 10% to 12%. For B2, B4, B6, B14, and B15 remaining, the ERA5 data overestimated MWP for less than 6%. Compared with the annual mean MWP error, the 75th and 90th percentiles of MWP from the ERA5 and buoy data had slightly increased differences, except for B1. Furthermore, Table 9 also shows that the overestimation of the ERA5 annual maximum MWP in B6, B7, B8, B11, B12, B14, and B15 was less than 9%. However, for B2, B3, B5, B9, B10, and B13, the overestimation was greater than 17%, with a maximum of 41%. The underestimation of the ERA5 annual maximum MWP for B1 and B4 was 18% and 8%, respectively. From such, we conclude that the ERA5 data overestimated MWP in most of the SCS.
|
The monthly bias and correlation coefficient of MWP between the buoy and ERA5 data are shown in Table 10. The maximum bias value in the SCS appeared in the November and December (autumn to winter monsoon transition), except for B1, B2, and B7. The correlation coefficient of MWP between the buoy and ERA5 data at each location varied greatly from month to month. The minimum correlation coefficient was observed in each season. The minimum correlation coefficients of B3, B5, B6, and B10 occurred in spring, whereas those of B8, B14, and B15 occurred in summer. Meanwhile, the minimum correlation coefficient values of B2, B4, B11, and B12 appeared in autumn, whereas those of B1, B7, B9, and B13 occurred in winter.
|
Wind (Wave) data in the ERA5 were produced on a grid with a horizontal resolution of 0.25° (0.5°) on the order of 27 km (55 km). Although there is a considerable increase in horizontal resolution (Hersbach et al., 2020), the spatial discretization of ERA5 data may still lead to errors of representativeness. Based on the horizontal resolution of the ERA5 data, there were few grid points consistent with the buoy position. Therefore, we used spatial linear interpolation to obtain ERA5 data values consistent with the buoy position. However, spatial linear interpolation can cause errors in the applicability evaluation of the ERA5 wind and wave reanalysis data, because linearly interpolated data are not entirely consistent with real data. In general, grid coarseness can lead to errors. In addition, the ERA5 data ignores the role of small islands and reefs in simulations, which cause the wave spectrum to shift to lower frequencies during wave propagation, thus underestimating SWH and overestimating MWP (Shi et al., 2021). On the other hand, buoy data, which typically have a good reliability, indicate local conditions, and can better reflect the real change characteristics. However, errors of buoy data can be due to the accuracy of instruments as presented in Section 2 and the duration of the measurement campaign. The errors of representativeness of ERA5 data and errors of buoy data will affect the evaluation results to a certain extent.
Some of the discrepancies in the wind and wave data may due to the extreme conditions, such as sudden enhancement or attenuation in the wind speed (Figs. 5a & 3b), cold air processes (magenta dashed frames in Figs. 8a & 9a) and typhoons (black and green dashed frames in Figs. 8b, 9a, & c). When there is an extreme condition, such as a sudden enhancement or attenuation in wind speed, the ERA5 wind speed data will underestimate or overestimate the actual wind speed intensity in comparison with buoy data. Partial enlarged view in Figs. 5a & 3b showed one example of sudden enhancement or attenuation in the wind speed. Additionally, the ERA5 data underestimated SWH at all locations under extreme conditions (such as cold air processes or typhoons). We have given two examples of cold air processes or typhoons. Black dashed frames in Figs. 8b & 9c represent the influence time of Typhoon NURI. Green dashed frames in Fig. 9a & c represent the influence time of Typhoon HIGOS. Magenta dashed frames in Figs. 8a & 9a represent the influence time of cold air processes. To show more clearly the variation characteristics of air temperature and SWH in the B1 and B4 during cold air events (magenta dashed frames in Figs. 8a & 9a), we have presented air temperature and SWH in the B1 (Fig. 20) and B4 (Fig. 21) during April and May 2020. Figures 20 & 21 both show that air temperature declined sharply during cold air events, meanwhile SWH were significantly enhanced. However, the ERA5 data had a significantly lower SWH intensity than buoy-observed one.

|
| Fig.20 Time series of air temperature (a), and the ERA5 and buoy SWH data (b) at B1 during April and May 2020 The magenta dashed frame represents the influence time of cold air event. |

|
| Fig.21 Time series of air temperature (a), and the ERA5 and buoy SWH data (b) at B4 during April and May 2020 The magenta dashed frame represents the influence time of cold air event. |
Some of the discrepancies in the wave data comparison may be related to the wind input (Bruno et al., 2020). Even though the bias of wind speed between the ERA5 and buoy data showed no identical feature, the underestimation of annual maximum wind speed was large. The analysis showed that the ERA5 data underestimated annual maximum SWH in the SCS owing to underestimation of the input wind field used to force the wave model during extreme events (Kumar and Naseef, 2015). In addition, ERA5 data overestimated annual maximum MWP in most buoy locations. In general, extreme-value analysis is usually based on long-term datasets (10, 20, or 50 years). Therefore, the conclusions may not safe for extreme-value analysis using just one year of observation data. Further analysis and research are needed to be conducted when the length of observation data is longer enough for extreme-value analysis.
Besides, Figs. 8–10 show that the ERA5 data slightly underestimated SWH from October 2020 to February 2021 in the B2, B4, B7, and B9; meanwhile, SWH in B14 is largely overestimated by ERA5 data from mid October 2020 to February 2021 which cause a large discrepancy between buoy B14 and ERA5 data (Fig. 12b). The reason for the underestimation of SWH in the B2, B4, B7, and B9 may due to the underestimation of wind speed in the B2, B4, B7, and B9 (Figs. 2–4). Therefore, in shallower areas (less than 60-m depth) and close to the shore, data coming from a more detailed wave modelling, using nearshore wave models like SWAN or MIKESW, is needed for the comparisons. From Table 4, wind speed of ERA5 data from October 2020 to February 2021 showed no sudden decline in quality. Consequently, in our opinion, quality of data used for assimilation at ECMWF decline severely due to the influence of oceanographic environmental factor may be the reason of the overestimation of SWH in ERA5 data.
The error sources mentioned above lead to a different characteristic of histograms of wind speed, SWH, and MWP among buoys. For histograms of wind speed, the values of peak in the B8 and B9 (Fig. 7h & i) were larger than that of other locations, it is probably because they were close to the Luzon Strait. And in B1, B2, B4, B6, and B7, which were in shallow water (less than 60 m), the ERA5 data obviously underestimated larger wind speed than that of the buoy-measured data. Existence of extreme conditions, such as sudden enhancement or attenuation in the wind speed would lead to poor consistency on maximum and minimum wind speed of the ERA5 data compared with the buoy-measured one. For histograms of SWH, errors may be related to the wind input, cold air processes, and typhoons, the ERA5 data also need to improve the ability of simulating maximum and minimum SWH compared with the observed one. The ERA5 data ignores the role of small islands and reefs in simulations, which lead to systematically overestimation of MWP (Shi et al., 2021). This would explain why number of occurrences of maximum MWP in the ERA5 data were more than that in buoy data at all buoy locations in the histograms of MWP. Except for B1 where showed the opposite characteristic, this may be because B1 is located in the Beibu Gulf and the Beibu Gulf is a typical semi-closed sea area. The ERA5 data may underestimated the reflection of the Beibu Gulf coastline on waves, which cause the reduction of swell.
Therefore, the ERA5 SWH data should be used with caution, especially when site-specific validation is required for design applications. Although cold air or typhoons will lead to large SWH values, the enhancement effect on annual mean SWH is not significant because the duration is not long enough, just a few days. The annual number of cold air or typhoons is limited. Furthermore, considering that most of the wave modeling results show a difference between the measured and modeled SWH of up to 0.5–2 m (Kumar and Naseef, 2015); the ERA5 data can be used as firsthand information under non-extreme conditions.
5 SUMMARYBy comparing the 15 sets of observed in-situ buoy measurements with the ERA5 data, we try to contribute to the study of wind and wave in the SCS. The 15 buoy stations were located throughout the SCS, from shallow to deep water. Most of the buoy observation data used in the study lasted for one year, from March 2020 to February 2021. In general, the present study revealed that the ERA5 wind speed and SWH data show inspiring accordance with the buoy-measured data under non-extreme conditions, but that of MWP is relatively poor. Obvious correlation coefficients (almost above 0.82) were observed between wind and wave data of ERA5 and buoys data.
The bias value range of the ERA5 and buoy annual mean wind speed was between -0.78 and 0.99 m/s. The ERA5 data underestimated the wind speed in the Beibu Gulf, shallow water area (less than 60 m) and locations near the Luzon Strait. Meanwhile, the ERA5 data overestimated wind speed in the central-eastern and southwestern SCS. The RMSE value range of the ERA5 and buoy wind speed data was between 1.14 and 2.46 m/s. The RMSE value for B13 was the largest (2.46 m/s), and its correlation coefficient was the smallest (0.87). The correlation coefficients of wind speed between the ERA5 and buoy data were greater than 0.87. Although the ERA5 annual mean wind speed data were virtually consistent with the buoy measured data, the ERA5 data underestimated annual maximum wind speed in the SCS by 2%–38%.
Bias value range of the ERA5 and buoy SWH data was between -0.24 and 0.28 m. The ERA5 data had a higher SWH intensity in the Beibu Gulf and southwestern SCS, meanwhile showed an opposite character in other locations. The largest RMSE values (0.51) was observed in the southwestern SCS, with the smallest correlation coefficient (0.84). The RMSE values of other locations were no more than 0.41 m, and the correlation coefficients were all above 0.92. The ERA5 data underestimated annual mean SWH in the SCS by 1%–16%, except in the Beibu Gulf (-6%) and the southwestern SCS (-25%). Furthermore, the ERA5 data underestimated annual maximum SWH in the SCS by 1%–30%, but still overestimated annual maximum SWH in the southwestern SCS (-36%). The analysis results revealed that the ERA5 data underestimated annual maximum SWH in the SCS because the annual maximum wind speed used for wave simulation using the ERA5 data was lower than the measured wind speed.
Bias of MWP between the ERA5 and buoy data varied from -0.74 to 0.57 s. The ERA5 data overestimated MWP in the SCS, except in the Beibu Gulf. The maximum RMSE value (0.99 s) and minimum correlation coefficient (0.56) were found in the Beibu Gulf. For the other locations, the RMSE values varied from 0.51 to 0.96 s and the correlation coefficients fluctuated within a narrow range of 0.82–0.90. The ERA5 data underestimated annual mean MWP in B1 and B7 by 12% and 1%, respectively. For other locations, the ERA5 data overestimated MWP by 1% to 12%. The ERA5 data underestimated annual maximum MWP in B1 and B4 by 18% and 8% but overestimated by 3% to 41% in other locations.
6 DATA AVAILABILITY STATEMENTThese data are available at Zenodo (https://doi.org/10.5281/zenodo.5816765). All the data processing were performed using MATLAB.
7 ACKNOWLEDGMENTWe thank the European Centre for Medium-Range Weather Forecasts for providing the valuable data used in this study.
Agarwal A, Venugopal V, Harrison G P. 2013. The assessment of extreme wave analysis methods applied to potential marine energy sites using numerical model data. Renewable and Sustainable Energy Reviews, 27: 244-257.
DOI:10.1016/j.rser.2013.06.049 |
Amiri A, Panahi R, Radfar S. 2016. Parametric study of two-body floating-point wave absorber. Journal of Marine Science and Application, 15(1): 41-49.
DOI:10.1007/s11804-016-1342-1 |
Babanin A V. 2006. On a wave-induced turbulence and a wave-mixed upper ocean layer. Geophysical Research Letters, 33(20): L20605.
DOI:10.1029/2006GL027308 |
Babanin A V, Ganopolski A, Phillips W R C. 2009. Wave-induced upper-ocean mixing in a climate model of intermediate complexity. Ocean Modelling, 29(3): 189-197.
DOI:10.1016/j.ocemod.2009.04.003 |
Behzad H, Panahi R. 2017. Optimization of bottom-hinged flap-type wave energy converter for a specific wave rose. Journal of Marine Science and Application, 16(2): 159-165.
DOI:10.1007/s11804-017-1405-y |
Bromirski P D, Cayan D R, Flick R E. 2005. Wave spectral energy variability in the northeast Pacific. Journal of Geophysical Research: Oceans, 110(C3): C03005.
DOI:10.1029/2004JC002398 |
Bromwich D H, Wang S H. 2008. A review of the temporal and spatial variability of Arctic and Antarctic atmospheric circulation based upon ERA-40. Dynamics of Atmospheres and Oceans, 44(3-4): 213-243.
DOI:10.1016/j.dynatmoce.2007.09.001 |
Bruno M F, Molfetta M G, Totaro V, et al. 2020. Performance assessment of ERA5 wave data in a swell dominated region. Journal of Marine Science and Engineering, 8(3): 214.
DOI:10.3390/jmse8030214 |
Caires S, Sterl A, Bidlot J R, et al. 2004. Intercomparison of different wind-wave reanalyses. Journal of Climate, 17(10): 1893-1913.
DOI:10.1175/1520-0442(2004)017<1893:iodwr>2.0.co;2 |
Caires S, Sterl A. 2005. A new nonparametric method to correct model data: application to significant wave height from the ERA-40 re-analysis. Journal of Atmospheric and Oceanic Technology, 22(4): 443-459.
DOI:10.1175/jtech1707.1 |
Campos R M, Soares C G. 2016. Comparison of HIPOCAS and ERA wind and wave reanalyses in the North Atlantic Ocean. Ocean Engineering, 112: 320-334.
DOI:10.1016/j.oceaneng.2015.12.028 |
Cavaleri L, Bertotti L, Torrisi L, et al. 2012. Rogue waves in crossing seas: the Louis Majesty accident. Journal of Geophysical Research: Oceans, 117(C11).
DOI:10.1029/2012JC007923 |
Fan Y L, Ginis I, Hara T. 2009. The effect of wind-wave-current interaction on air-sea momentum fluxes and ocean response in tropical cyclones. Journal of Physical Oceanography, 39(4): 1019-1034.
DOI:10.1175/2008JPO4066.1 |
Gemmrich J, Thomas B, Bouchard R. 2011. Observational changes and trends in northeast Pacific wave records. Geophysical Research Letters, 38(22): L22601.
DOI:10.1029/2011GL049518 |
Gulev S K, Grigorieva V. 2004. Last century changes in ocean wind wave height from global visual wave data. Geophysical Research Letters, 31(24): L24302.
DOI:10.1029/2004GL021040 |
Gulev S K, Grigorieva V. 2006. Variability of the winter wind waves and swell in the North Atlantic and North Pacific as revealed by the voluntary observing ship data. Journal of Climate, 19(21): 5667-5685.
DOI:10.1175/JCLI3936.1 |
Gulev S K, Grigorieva V, Sterl A, et al. 2003. Assessment of the reliability of wave observations from voluntary observing ships: insights from the validation of a global wind wave climatology based on voluntary observing ship data. Journal of Geophysical Research: Oceans, 108(C7): 3236.
DOI:10.1029/2002JC001437 |
Hemer M A, Church J A, Hunter J R. 2010. Variability and trends in the directional wave climate of the Southern Hemisphere. International Journal of Climatology, 30(4): 475-491.
DOI:10.1002/joc.1900 |
Hersbach H, Bell B, Berrisford P, et al. 2020. The ERA5 global reanalysis. Quarterly Journal of the Royal Meteorological Society, 146(730): 1999-2049.
DOI:10.1002/qj.3803 |
Kumar V S, Naseef T M. 2015. Performance of ERA-interim wave data in the nearshore waters around India. Journal of Atmospheric and Oceanic Technology, 32(6): 1257-1269.
DOI:10.1175/JTECH-D-14-00153.1 |
Le Traon P Y. 2013. From satellite altimetry to Argo and operational oceanography: three revolutions in oceanography. Ocean Science, 9(5): 901-915.
DOI:10.5194/os-9-901-2013 |
Li X, Dong S. 2016. A preliminary study on the intensity of cold wave storm surges of Laizhou Bay. Journal of Ocean University of China, 15(6): 987-995.
DOI:10.1007/s11802-016-3053-2 |
Liu G Q, Perrie W, Hughes C. 2017. Surface wave effects on the wind-power input to mixed layer near-inertial motions. Journal of Physical Oceanography, 47(5): 1077-1093.
DOI:10.1175/JPO-D-16-0198.1 |
Menéndez M, Méndez F J, Losada I J, et al. 2008. Variability of extreme wave heights in the northeast Pacific Ocean based on buoy measurements. Geophysical Research Letters, 35(22): L22607.
DOI:10.1029/2008GL035394 |
Ministry of Natural Resources of the People's Republic of China. 2020. Offshore forecast areas zoning. HY/T 0292-2020. Beijing: Standards Press of China. (in Chinese)
|
Mirab H, Fathi R, Jahangiri V, et al. 2015. Energy harvesting from sea waves with consideration of airy and JONSWAP theory and optimization of energy harvester parameters. Journal of Marine Science and Application, 14(4): 440-449.
DOI:10.1007/s11804-015-1327-5 |
Mohapatra S. 2016. The interaction of oblique flexural gravity waves with a small bottom deformation on a porous ocean-bed: green's function approach. Journal of Marine Science and Application, 15(2): 112-122.
DOI:10.1007/s11804-016-1353-y |
Monioudi I N, Velegrakis A F, Chatzipavlis A E, et al. 2017. Assessment of island beach erosion due to sea level rise: the case of the Aegean archipelago (Eastern Mediterranean). Natural Hazards and Earth System Sciences, 17(3): 449-466.
DOI:10.5194/nhess-17-449-2017 |
Niu Q R, Feng Y Q. 2021. Relationships between the typhoon-induced wind and waves in the northern South China Sea. Geophysical Research Letters, 48(8): e2020GL091665.
DOI:10.1029/2020GL091665 |
Patra A, Min S K, Seong M G. 2020. Climate variability impacts on global extreme wave heights: seasonal assessment using satellite data and ERA5 reanalysis. Journal of Geophysical Research: Oceans, 125(12): e2020JC016754.
DOI:10.1029/2020JC016754 |
Postacchini M, Soldini L, Lorenzoni C, et al. 2017. Medium-term dynamics of a middle Adriatic barred beach. Ocean Science, 13(5): 719-734.
DOI:10.5194/os-13-719-2017 |
Rascle N, Ardhuin F. 2013. A global wave parameter database for geophysical applications. Part 2: model validation with improved source term parameterization. Ocean Modelling, 70: 174-188.
DOI:10.1016/j.ocemod.2012.12.001 |
Saha S, Moorthi S, Pan H L, et al. 2010. The NCEP climate forecast system reanalysis. Bulletin of the American Meteorological Society, 91(8): 1015-1058.
DOI:10.1175/2010BAMS3001.1 |
Semedo A, Sušelj K, Rutgersson A, et al. 2011. A global view on the wind sea and swell climate and variability from ERA-40. Journal of Climate, 24(5): 1461-1479.
DOI:10.1175/2010JCLI3718.1 |
Sharp E, Dodds P, Barrett M, et al. 2015. Evaluating the accuracy of CFSR reanalysis hourly wind speed forecasts for the UK, using in situ measurements and geographical information. Renewable Energy, 77: 527-538.
DOI:10.1016/j.renene.2014.12.025 |
Shi H Y, Cao X F, Li Q J, et al. 2021. Evaluating the accuracy of ERA5 wave reanalysis in the water around China. Journal of Ocean University of China, 20(1): 1-9.
DOI:10.1007/s11802-021-4496-7 |
Stefanakos C. 2021. Global wind and wave climate based on two reanalysis databases: ECMWF ERA5 and NCEP CFSR. Journal of Marine Science and Engineering, 9(9): 990.
DOI:10.3390/jmse9090990 |
Stopa J E, Cheung K F. 2014a. Intercomparison of wind and wave data from the ECMWF reanalysis interim and the NCEP climate forecast system reanalysis. Ocean Modelling, 75: 65-83.
DOI:10.1016/j.ocemod.2013.12.006 |
Stopa J E, Cheung K F. 2014b. Periodicity and patterns of ocean wind and wave climate. Journal of Geophysical Research: Oceans, 119(8): 5563-5584.
DOI:10.1002/2013JC009729 |
Thomas B R, Kent E C, Swail V R, et al. 2008. Trends in ship wind speeds adjusted for observation method and height. International Journal of Climatology, 28(6): 747-763.
DOI:10.1002/joc.1570 |
Vanem E, Walker S E. 2013. Identifying trends in the ocean wave climate by time series analyses of significant wave heightdata. Ocean Engineering, 61: 148-160.
DOI:10.1016/j.oceaneng.2012.12.042 |
Wan Y, Fan C Q, Dai Y S, et al. 2018. Assessment of the joint development potential of wave and wind energy in the South China Sea. Energies, 11(2): 398.
DOI:10.3390/en11020398 |
Wang X L, Swail V R. 2006. Climate change signal and uncertainty in projections of ocean wave heights. Climate Dynamics, 26(2): 109-126.
DOI:10.1007/s00382-005-0080-x |
Yan Z D, Liang B C, Wu G X, et al. 2020. Ultra-long return level estimation of extreme wind speed based on the deductive method. Ocean Engineering, 197: 106900.
DOI:10.1016/j.oceaneng.2019.106900 |
Young I R, Zieger S, Babanin A V. 2011. Global trends in wind speed and wave height. Science, 332(6028): 451-455.
DOI:10.1126/science.1197219 |
Zhai F G, Wu W F, Gu Y Z, et al. 2021. Dynamics of the seasonal wave height variability in the South China Sea. International Journal of Climatology, 41(2): 934-951.
DOI:10.1002/joc.6707 |
Zheng C W, Li C Y. 2017. Propagation characteristic and intraseasonal oscillation of the swell energy of the Indian Ocean. Applied Energy, 197: 342-353.
DOI:10.1016/j.apenergy.2017.04.052 |
Zheng C W, Pan J, Li J X. 2013. Assessing the China Sea wind energy and wave energy resources from 1988 to 2009. Ocean Engineering, 65: 39-48.
DOI:10.1016/j.oceaneng.2013.03.006 |
Zheng C W, Wu G X, Chen X, et al. 2019. CMIP5-based wave energy projection: case studies of the South China Sea and the East China Sea. IEEE Access, 7: 82753-82763.
DOI:10.1109/ACCESS.2019.2924197 |