 2023, Vol. 41
Institute of Oceanology, Chinese Academy of Sciences
Article Information
- LUO Lin, WU Meilin
- Spatiotemporal characteristics of summer hypoxia in Mirs Bay and adjacent coastal waters, South China
- Journal of Oceanology and Limnology, 41(2): 482-494
- http://dx.doi.org/10.1007/s00343-022-2025-1
Article History
- Received Jan. 26, 2022
- accepted in principle Mar. 21, 2022
- accepted for publication Jun. 30, 2022


2 Southern Marine Science and Engineering Guangdong Laboratory (Guangzhou), Guangzhou 511458, China
Dissolved oxygen (DO) is an important health indicator of water quality in estuarine and coastal ecosystems. Hypoxia is an environmental phenomenon where the DO concentration is less than 2 mg/L or less than 64.5 μmol/L (Turner et al., 2012). It is one of the severe symptoms of eutrophication. Hypoxic areas are also considered to be 'Dead Zones', because hypoxia not only causes the mortality of organisms but also affects the carrying capacity of living resources and habitats (Diaz, 2001). In addition, hypoxia can profoundly affect the functioning of aquatic ecosystems and the biogeochemical cycling of biogenic substances (Naqvi et al., 2010). Therefore, hypoxia has received increasing scientific and public attention worldwide.
Over the past few decades, hypoxic or oxygen-minimum zones have been expanding globally (Breitburg et al., 2018), affecting many estuarine and coastal areas and fjords (Kemp et al., 2009; Middelburg and Levin, 2009; Silva and Vargas, 2014), and systems such as the Gulf of Mexico (Bianchi et al., 2010), the North Sea (Topcu and Brockmann, 2015), and the Black Sea (Rakocinski and Menke, 2016). Seasonal hypoxia often develops in river-dominated coastal zones where the large freshwater discharge enhances water column stratification while the excessive anthropogenic nutrient input stimulates high production of organic matter. Examples include coastal waters off Zhujiang (Pearl) River, Changjiang (Yangtze) River, Mississippi River, and Rhone River (Rabouille et al., 2008; Rabalais et al., 2010).
Previous studies have revealed that hypoxia is strongly determined by a multitude of physical conditions (e.g., stratification, residence time, and wind field) and biological-chemical activities (e.g., respiration and organic matter decomposition). A typical example is the northern Gulf of Mexico, the world's second largest human-made hypoxic zone. The combination of high freshwater discharge from the Mississippi River, wind mixing, regional circulation, and summer warming controls the strength of stratification, which has a well-defined seasonal cycle. The physical structure of the water column and the high nutrient loads that enhance primary production lead to the annual formation of a hypoxic water mass that is dominant from spring to late summer (Rabalais et al., 2002; Rabalais et al., 2010). Zhang et al. (2010) provided an overview of the major aspects of coastal hypoxia in different biogeochemical provinces. They showed that the interactions of the external forcings—including freshwater runoff and other factors contributing to stratification, organic matter, and nutrient loadings, as well as exchange between coastal and open ocean water masses—set up mechanisms that drive systems towards hypoxia. In addition, coastal systems vary in their relative susceptibility to hypoxia depending on their physical and geographic settings. The slow water renewal of semi-enclosed basins favors DO consumption owing to organic matter degradation (Gray et al., 2002). Wind has a significant effect on the bottom DO variation through modulating not only the vertical mixing but also the lateral and longitudinal exchanges (Scully, 2010). Although physical processes do not directly consume DO, they provide favorable conditions for the decomposition of organic matter and other respiration processes, and eventually lead to hypoxia. Combined with the abovementioned factors, biogeochemical factors contribute to oxygen consumption; physical factors cause water column stratification, and the interaction between the two results in hypoxia.
Mirs Bay is a semi-enclosed bay neighboring the Zhujiang River estuary. The estuary receives freshwater from Zhujiang River, the second (in flux), or the third (in length) largest river in China, which flows into the northern part of the South China Sea. Previous studies have shown that hypoxia appears to occur over a limited spatial scale in the Zhujiang River estuary and adjacent coastal waters. The high oxygen consumption owing to organic matter degradation favors hypoxia formation, but the geographic setting (relatively shallow waters) and physical conditions (intense mixing) prevent the development of hypoxia (Yin et al., 2004; Dai et al., 2006; Rabouille et al., 2008; Luo et al., 2009). Terrestrial groundwater discharge also delivers a substantial amount of ammonium to the coast, which may intensify eutrophication and lead to hypoxia (Luo et al., 2018). The waters of Mirs Bay were regarded as clean as the bay borders Hong Kong in the west and is rarely affected by the Zhujiang River (Liu and Hills, 1998). However, with rapid population growth and urbanization in neighboring areas, including Hong Kong and Shen Zhen, increasing domestic sewage, industrial effluent, and agricultural wastes from surrounding areas are input into Mirs Bay, and the bay has been subjected to increased environmental disturbance. Yin et al. (2010) found that hypoxia occurred in the bottom waters during summer in two small bays beside and inside Mirs Bay. Hypoxia in Mirs Bay was considered to be the result of a combination of density stratification, intrusion and retention of the continental shelf bottom waters forced by the southeast monsoon, and degradation of detritus particulate organic matter (POM), most of which was autochthonous (Li et al., 2014). However, Zhang et al. (2018) showed that the effects of allochthonous POM from remote oceanic boundaries on bottom hypoxia inside Mirs Bay could not be neglected. Geeraert et al. (2021) analyzed surface water samples collected in Hongkong coastal waters and suggested that local sources, such as wastewaters, play an important role in the consumption of oxygen in Victoria Harbour. This may also be the case in Mirs Bay, as the bay receives pollution inputs from peripheral areas. The buffering capacity for eutrophication varies among coastal water bodies, and each system has its own unique environmental characteristics. Different hydrodynamics may affect the efficiency of organic matter decomposition and biological processes, as well as the occurrence of bottom hypoxia. As an ocean-dominated bay, Mirs Bay has different physicochemical and biotic processes compared with the adjacent areas, including the southern waters of Hong Kong, which are periodically affected by Zhujiang River discharge, and south of Mirs Bay, which is occupied by shelf waters. At the same time, the implementation of the pollutant emission policies has brought about changes in the ratio and quantity of nutrients and other oxygen-consuming substances. Whether these changes affect the long-term trend of hypoxia in the study area has not been systematically investigated. The objective of this study is to use compiled monthly-observed water-quality data and sediment-quality data to analyze the long-term characteristics and variability of hypoxia in Mirs Bay and adjacent areas near Hong Kong. This study provides information to help elucidate the mechanisms of hypoxia in Mirs Bay and adjacent areas with different hydrographic and biochemical conditions in summer.
2 MATERIAL AND METHOD 2.1 Study areaMirs Bay is a semi-enclosed microtidal bay located to the south of Shenzhen and to east of Hong Kong (Fig. 1). It covers an area of 400 km2 and has an average depth of approximately 18 m. The water depth of the bay is shallower in the northeast, ranging from 8 m to 16 m. It becomes deeper toward the south and progressively reaches a maximum depth of 30 m near the mouth of the bay (Huang and Huang, 2003), which opens to the South China Sea. There are no large rivers that feed into the bay.

|
| Fig.1 Sampling stations for the water quality (black dots) and sediments (green pentagrams) in Mirs Bay and adjacent areas |
The monthly field campaigns included the sampling of fixed monitoring stations distributed throughout Hong Kong waters by the Hong Kong Environmental Protection Department. In this study, 12 marine-water and 3 sediment monitoring stations representing three different geographical zones were used. The marine-water monitoring stations MM2– MM5 and MM16 were located in Mirs Bay. Stations MM13–MM15 were located outside Mirs Bay and are representative of the shelf zone. Stations SM17– SM20 were situated to the south of Hong Kong and represented the transition zone from the estuary to the coastal continental shelf. The sampling frequency was once per month. Sediment monitoring stations MM2, MM13, and SS3 represented Mirs Bay, the shelf zone, and the transition zone, respectively. The sampling frequency was at least twice per year: once in winter (December–February) and once in summer (June–August). The locations of the monitoring stations are shown in Fig. 1.
At the marine-water monitoring stations, temperature and salinity records are obtained with a Seacat19+ CTD. A SBE23Y DO sensor (membrane electrode) and a SBE18 pH sensor are combined with the Seacat19+CTD. Water samples were collected at the surface (1 m below the surface), middle (half of the water column) and bottom (1 m above the bottom). If the water depth was less than 4 m, only the surface sample was collected. If the water depth exceeded 6 m, samples at three different depths (surface, middle, and bottom) were collected. If the water depth ranged from 4 m to 6 m, samples at the surface and the bottom were collected. Nutrients (nitrate, nitrite, phosphate, and silicate) were measured by flow injection analysis (American Public Health Association, 22nd). Ammonium (NH4) was measured by flow injection analysis (American Society of Testing Materials, ASTM D3590-11B). Biological oxygen demand (BOD5) was measured according to the American Public Health Association. Dissolved inorganic nitrogen (DIN) is the sum of nitrate, nitrite, and ammonium. Sediment samples were collected from the top 10 cm of the seabed. Detailed information on the standard method and techniques used can be found in the Annual Marine Water Quality Report (https://www.epd.gov.hk/epd/english/environmentinhk/water/hkwqrc/waterquality/marine-2.html).
2.3 Data treatmentParameter values below the detection limits (the minimum measurable value) are shown as N/A in the dataset. In this study, they are replaced by 1/2 of their detection limits. Bottom hypoxia events are the numbers of hypoxia events observed at a specific site or in a specific period, where a hypoxia event is defined as a single measurement of DO less than 2 mg/L. Bottom hypoxia occurrence (%) is calculated as 100 times the number of hypoxia events divided by the total number of sampling times (stations and/ or time) during the observation period of 26 years.
3 RESULT 3.1 Hydrographical characteristics in Mirs Bay and adjacent areasHong Kong's coastal waters are affected by water masses from the South China Sea throughout the year and by Zhujiang River freshwater discharge during the summer. During 1994–2019, the annual average surface salinity showed seasonal variations, with a maximum (32.7) in April and a minimum (27.4) in July. The minimum value (4.7) of surface salinity appeared in transition zone in June 2005 (Fig. 2a). During summer (May–October), the upper layer in the transition zone (SM17–SM20) was often occupied by Zhujiang River diluted water with a median salinity value of 28.0. In the shelf zone (MM13–MM15), the median salinity at the surface was 31.8 in summer, indicating an insignificant influence from the Zhujiang River estuary. The surface salinity in Mirs Bay was slightly lower than that in shelf zone, with a median value of 31.5, indicating river input from peripheral areas. The bottom-layer waters were the deep water of the South China Sea shelf waters with a median salinity value greater than 33 at all of the sampling stations (Fig. 2b). The salinity from the surface to bottom was generally uniform owing to vertical mixing, and remained mostly > 30.0 in winter (November–April) (Fig. 2b). The surface water temperature rapidly increased from March to May, remained above 28 ℃ from June to September, then decreased slowly from October, and finally remained below 20 ℃ during winter in Mirs Bay and adjacent coastal waters. The maximum surface temperature (31.9 ℃) occurred in Mirs Bay in July 1996, and the minimum surface temperature (13.50 ℃) occurred in the shelf zone in February 2008 (Fig. 2c). The seasonal variation in temperature of the near-bottom water was similar to that for the surface water, but the temperature in July and August was lower than that in June and September (Fig. 2d). The temperature difference between the surface and bottom was greatest in summer.

|
| Fig.2 Spatial and temporal variations in salinity (a, b) and temperature (c, d) at the surface (a, c) and the bottom (b, d) in the study area from 1994 to 2019 The left y axis represents the months from January to December; the right y axis represents the years from 1994 to 2019. |
The DO at the surface also showed spatial and temporal variations (Fig. 3). The multi-year average DO concentrations ranged from 6.2 to 7.7 mg/L with two significant peaks in February–March and July during the 26-year monthly survey cruises. The highest value of 14.1 mg/L (saturation over 200%) was recorded in the transition zone in July 2002, and the second-highest value of 13.6 mg/L was recorded in Mirs Bay in February 2016. However, the peak in summer was not clear in Mirs Bay.

|
| Fig.3 Spatial and temporal variation in DO concentration (mg/L) at the surface (a) and the bottom (b) in the study area from 1994 to 2019 |
The DO in the bottom water showed a clear seasonal pattern, with the greatest annual average value in February (winter) and the lowest average value in August (summer), ranging from 3.9 to 7.8 mg/L in all three zones. The average DO values in August were 3.49, 4.49, and 4.11 mg/L in Mirs Bay, the shelf zone and the transition zone, respectively. The lowest value of 0.2 mg/L (saturation of 3%) was recorded at station MM3 (Mirs Bay) in August 1999.
Hypoxia in the bottom water varied greatly in the different study areas. The occurrence of bottom hypoxia in Mirs Bay was more frequent than that in the transition zone and the shelf zone (Fig. 4a). Hypoxia was continuously detected from July to September 2007, suggesting a potentially long-lasting hypoxia event. There was only one hypoxia event observed in the shelf zone (MM13–MM15) in September 2016. Bottom hypoxia mainly occurred from June to September, and reached a maximum in August (Figs. 3b & 4b). The bottom hypoxia also showed clear annual variations. Since 2007, hypoxia has been observed in the study area every year, particularly in Mirs Bay (Fig. 4c).

|
| Fig.4 Hypoxia events observed in the study area from 1994 to 2019 at each sampling station (a), in each month (b), and in each year (c) |
Stratification is an essential condition for the formation of hypoxia in coastal areas. In the summer, increasing freshwater runoff led to a buoyant plume floating seaward over the surface of the transition zone (Fig. 2a), whereas the low-temperature shelf water intruded landward from the bottom layer, driven by the East Asia summer monsoon (Zu and Gan, 2015). In addition, high solar radiation heated the surface water and created a vertical thermal gradient, which also contributed significantly to the stratification of the water column in summer. The strong temperature and salinity differences between the sea surface and bottom layer resulted in the development of strong stratification, which persisted for approximately five months from May to September (Fig. 2). This stratification left the bottom layer isolated from the surface layer and separated from the normal resupply of oxygen from the atmosphere. Consequently, the DO concentration decreased further. After late October, the water column approached vertical homogeneity in response to decreased river discharge and increasing vertical mixing owing to water cooling, particularly in the shallower water, destroying the hypoxia. In general, the DO saturation (%) value was higher in the surface water and decreased with increasing depth, and this gradient was more pronounced in July and August (data not shown). DO saturation was positively related to the chlorophyll-a concentration in the water surface (R=0.43, P < 0.001). This result indicates that DO was oversaturated owing to high primary production during this period, especially at the surface. As the water depths in the study area are shallower than 30 m, the strength of stratification of the water column can be shown as the density difference. △ σ =densitynear-bottom waters – densitysurface waters. A value close to zero indicates that the water column is well mixed vertically, and a relatively large positive value means that the water column is strongly stratified (Zhu et al., 2011). The results showed that the density differences between the surface and the near-bottom waters at the sampling stations gradually increased from May, reached a maximum (9.53 kg/m3) in July, with a mean value of 6.20 kg/m3, and then gradually decreased (Fig. 5). The density gradients in the transition zone from June to August were significantly higher than in Mirs Bay and the shelf zone, showing the influence of the freshwater plume. △σ was positively related to the bottom apparent oxygen utilization (AOU) (R= 0.620, P < 0.001, Fig. 6a) and negatively related to the bottom DO (R=0.616, P < 0.001), which verified that water column stratification was an essential prerequisite for the formation of bottom hypoxia in the study area in summer. The vertical temperature difference △T resembled △σ, but was lower in the transition zone than in the other two zones from June to August. △T was more significantly associated with the bottom AOU (R=0.683, P < 0.001; Fig. 6b). The R of the vertical salinity difference △S with AOU is 0.540 (P < 0.001). Even in the transition zone, which is influenced by Zhujiang River freshwater, the correlation coefficient between AOU and △S (R=0.686) was lower than that between AOU and △T (R=0.735). The results suggest that the seasonal thermocline contributed more to the oxygen consumption and hypoxia in the bottom layer than the halocline in all three zones.

|
| Fig.5 The climatological average density difference (a; △σ (kg/m3)) and temperature difference (b; △T (℃)) between the surface and bottom at each sampling station |

|
| Fig.6 AOU plotted against △σ (kg/m3) (a) and △T (℃) (b) of the water column in near-bottom waters The red lines represent the linear regression. |
Although seasonal variations in stratification and hydrodynamic transport are important in establishing low-oxygen conditions in the bottom layer, the maintenance of these conditions requires an increased supply of organic matter (Chen et al., 2007). Estuarine and coastal organic matter is derived from the sinking of in-situ produced organic matter or discharge from fluvial input (Rabalais et al., 2002), and the sources of nutrients are terrestrial inputs and organic matter decomposition. According to the mechanism of organic matter decomposition and the regeneration of nutrients, the most important respiration process that consumes oxygen can be expressed as follows (Redfield et al., 1963):
 (1)
(1)Hence, the mineralization of 1 mol of organic matter uses 138 mol of DO and releases 16 mol of nitrate and 1 mol of phosphorus. The mineralization of organic matter under aerobic conditions directly affects the dynamic processes between oxygen production (photosynthesis) and consumption (respiration).
In-situ phytoplankton is considered to be the dominant source of the estuarine particulate organic carbon pool in the Zhujiang River estuary during most seasons (Guo et al., 2015). In this study, the climatological mean chlorophyll-a concentration at the surface was higher than that at the bottom from May to October during 1994–2019, especially in the transition zone (Fig. 7a). This implies that a large amount of marine biogenic organic matter was deposited into the bottom water or sediment. Subsequent organism sinking and the amount of oxygen consumed during algal decomposition in the bottom waters resulted in a decrease in pH (Fig. 7b) and an increase in nutrients (Supplementary Fig.S1). However, the correlation between pH and chlorophyll-a concentration was not significant in Mirs Bay. For all of the bottom samples in summer, although nutrient (nitrate and dissolved inorganic phosphorous (DIP)) concentrations showed corresponding positive relationships with AOU, the relationships between AOU and nutrients were not significant (R=0.1 and 0.28, respectively) and did not follow the oxygen-consumption respiration process (Fig. 8; Eq.1). Dai et al. (2006) observed DO in the upper reach of the Zhujiang River estuary and also found a decoupling between oxygen depletion and nutrients. They suggested that nitrification partially contributes to the consumption of DO and may have an impact on the distribution of pH. Therefore, local eutrophication might not be the only important factor in oxygen depletion in bottom waters in the study areas.

|
| Fig.7 The climatological spatial and seasonal variations in chlorophyll a (μg/L) (a) and pH (b) in the 1994–2019 period |

|
| Fig.8 AOU (AOU > 0) plotted against nitrate (a) and DIP (b) in the near-bottom waters in summer The solid lines represent the linear relationship between the oxygen consumed and nutrients produced during aerobic respiration of organic matter (Eq.1). |
In the lower reach of the Zhujiang River estuary and adjacent areas, the ratio of oxygen-consuming organic matter derived from marine and terrestrial sources is about 65:35 (Su et al., 2017). Although we had no direct field data that would identify the relative importance of these two sources of organic matter in the study areas, the Environment State Report of Guangdong Province noted that the chemical oxygen demand (COD) emissions in wastewater increased sharply from 98×104 t in 2003 to 297×104 t in 2017 (Fig. 9) (http://gdee.gd.gov.cn/hjzkgb/index.html). This means that emissions of oxygen-depleting organics have nearly tripled in the past 15 years. Emissions of ammonia nitrogen during the same period were about equal to 12% of COD emissions. High loads of organic matter and NH4 also promoted DO consumption. This confirms a previous study by Li et al. (2012), who showed that the organic matter in the sediments was a mixture of both terrestrial and aquatic sources, and the terrestrial organic matter gradually increased relative to that from the aquatic source in Mirs Bay.

|
| Fig.9 Annual mean pH (a), DIP (b), NO3+NO2 (c), and COD (d) emissions in Guangdong Province (d: data before 2003 are industrial emissions only) COD data were obtained from the Report on the State of Guangdong Provincial Environment (http://gdee.gd.gov.cn/hjzkgb/index.html). |
Nutrients support increased phytoplankton in surface water. As the result of the pollutant reduction policy, DIP showed a significant decreasing trend; however, nitrate still increased from 1994 to 2019 (Fig. 9). For the sampling stations with nitrogen limitation, especially in Mirs Bay, the increase in nitrate exacerbated eutrophication and increased the potential for hypoxia occurrence. The annual decrease in bottom pH also corresponds with this trend. In particular, the pH value decreased significantly after 2008, consistent with frequent outbreaks of hypoxia events (Figs. 9a & 4c).
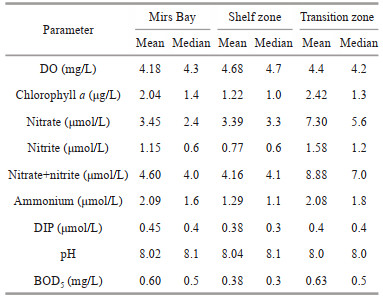
4.3 Hypoxia in Mirs BayThere are two interesting questions regarding hypoxia or low oxygen in Mirs Bay and its adjacent waters. One is why hypoxia events have rarely been observed in the shelf zone, and the other is why Mirs Bay has more hypoxia events than the transition zone, even though the nitrate concentration was almost half of the latter (Table 1).
|
The eastern coastal waters of Hong Kong (Mirs Bay and shelf zone) are relatively sheltered from Zhujiang River discharge; hence, they have more oceanic characteristics with relatively high surface salinity (Yin, 2002; Lee et al., 2006). The transition zone, which is located in the southern waters of Hong Kong, is strongly impacted by the Zhujiang River discharge in summer, the period of the maximum rainfall and river discharge, when the southwest monsoon prevails and moves the offshore plume water southeastward. The vertical differences in density and temperature verified this phenomenon (Fig. 5). In August, the salinity in the near-bottom waters of all stations was almost the same (approximately 34.4) owing to subsurface South China Sea water intrusion toward the coast. The climatological mean △S was 2.67, 4.27, and 7.61 in Mirs Bay, the shelf zone, and the transition zone, respectively. This also showed that the strength of the influence of freshwater discharge on surface salinity decreased from the transition zone and shelf zone to Mirs Bay. However, the month with the strongest stratification (July) was not the same as the month with the most hypoxia events (August), suggesting that stratification was not the only trigger of hypoxia.
In the shelf zone, the water column was characterized by ocean characteristics and relatively unaffected by Zhujiang River freshwater, which was verified by lower chlorophyll a and nutrients compared with Mirs Bay and the transition zone (Table 1). Some of the phytoplankton biomass may sink to the near bottom waters and then decay. The climatological mean bottom five-day biological oxygen demand (BOD5) in the shelf zone was 0.38 mg/L, which was 37% and 40% lower than that in Mirs Bay and the transition zone, respectively. It also implied that there is a lower amount of organic matter in the shelf zone than in the other two zones. Therefore, bottom hypoxia was seldom observed in the shelf zone, although it also had strong stratification during the summer period.
During the summer period, the ratios of nitrate to phosphate (N: P ratio) showed different geochemical behaviors in the three zones (Fig. 10). In Mirs Bay, the percentage of samples with an N : P ratio less than the Redfield ratio (16:1) was 87% at the surface and increased to approximately 89% in the near-bottom waters, showing the nitrogen limitation in the whole water column from the surface to the bottom. According to the Redfield ratio (Eq.1), corresponding nitrate and phosphate are produced when oxygen is consumed. Considering the nitrate (average 3.45 μmol/L) concentration, the phosphate concentration should be 0.22 μmol/L, and organic matter decomposition would result in an AOU of about 29.76 μmol/L (~0.95 mg/L). However, the linear relationship following the Redfield ratio between AOU and inorganic nutrients was not significant (Fig. 8), indicating that organic matter decomposition might not follow the Redfield ratio and that the consumption of DO was not only due to marine biogenic organic matter. Emissions of COD and ammonia nitrogen from the peripheral area also consumed oxygen (Fig. 9). The average AOU in the near-bottom water was actually 82.6 μmol/L (2.64 mg/L). If the mean DO (4.68 mg/L) in the bottom of the shelf zone is used as the background value, this reduces the DO concentration to 2.04 mg/L, close to the hypoxia threshold, and greatly increases the risk of bottom hypoxia events. The median N: P ratio at the bottom was approximately 6, which was less than the Redfield ratio and less than that in the shelf zone (about 8). It was likely that the remineralization of organic matter and possible release of phosphate from the sediment took place and contributed to such low values. Organic matter decomposition involves various biochemical degradation processes, producing different inorganic forms and organic forms. Lower DO conditions in near-bottom waters can lead to the release of phosphorus from sediments back into the water (Conley et al., 2002). If only the contribution from phosphate produced by organic matter decomposition was considered, the nitrate concentration would be 7.04 μmol/L, which is more than the average value (3.45 μmol/L). This result suggests that denitrification might occur in the bottom waters under low oxygen conditions, convert nitrate to nitrogen gases and release it from the system.

|
| Fig.10 Scatter plot of N: P ratios in the surface and bottom layers in Mirs Bay (a), the shelf zone (b), and the transition zone (c) The black lines present the Redfield slope. |
In the transition zone, the N: P ratios in most of the samples were higher than the Redfield ratio at the surface, indicating phosphorous limitation and the deep influence of Zhujiang River discharge. It was clear that a higher chlorophyll-a concentration occurred in the surface water of the transition zone, relative to Mirs Bay (Fig. 6a). Although the ratios in the near-bottom water decreased, 43% of samples still had N: P ratios higher than 16:1. The median N: P ratio in the near bottom (14) was closer to the Redfield ratio in summer (Fig. 10b). Low DIP (average value 0.4 μmol/L) and high nitrate (average value 7.3 μmol/L) concentrations at the bottom might be derived from the delivery of high concentrations of nutrients by the freshwater plume and/or organic matter decomposition. Based on the Redfield ratio, nitrate produced by organic matter decomposition would result in AOU of less than 57.53 μmol/L (~1.84 mg/L). The actual AOU was about 75.2 μmol/L, which was lower than the AOU concentration in Mirs Bay, although the concentrations of nitrate and nitrite in the transition zone were 2.1 and 1.4 times higher than those in Mirs Bay, respectively.
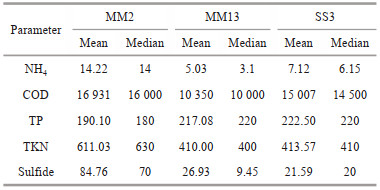
We determined the biochemical characteristics of the sediment at three stations in Mirs Bay, the shelf zone and the transition zone (Table 2). There were significantly high concentrations of NH4, total Kjeldahl nitrogen (TKN), and sulfide at station MM2 in Mirs Bay. Sulfide is thought to enhance dissimilatory nitrate reduction to ammonia (Brunet and Garcia-Gil, 1996), which is often related to sulfidic marine and estuarine sediments. Sulfide is present close to the sediment/water interface, and porewater concentrations increase during bottom-water hypoxia (McCarthy et al., 2008). In this study, sulfide was several times higher in Mirs Bay than in the other areas (P < 0.05). In addition, the concentrations of TKN and NH4 in Mirs Bay were also much higher than those in the transition zone. Respiration and nitrification of the sediment continuously consumed DO and contributed to the occurrence of hypoxia. Although Mirs Bay had no large river inflow, it was surrounded by several municipal outfalls that discharged large amounts of COD and NH4 into the bay (Fig. 9). Geeraert et al. (2021) found that Mirs Bay and the shelf zone were dissolved-organic-nitrogen-dominated regimes and the transition zone was a NO3-dominated regime. Different sources of oxygen-depleting organic matter influenced the spatiotemporal distribution of hypoxia in Mirs Bay and the adjacent areas.
|
Xia et al. (2011) used a numerical model to study the water self-purification capacity in Mirs Bay. The results indicated that the half-exchange period was more than 30 days in most of the waters inside the bay and approximately 5 days outside the bay. As a semi-enclosed bay, water exchange is limited between the inner bay and the outer bay, which results in the purification of terrestrial inputs that depend on biochemical degradation rather than on shelf-water dilution. Therefore, Mirs Bay has become a more favorable site for organic matter decomposition and DO consumption, and the risk of bottom hypoxia events has increased significantly.
5 CONCLUSIONThe long-term field observations of DO in Mirs Bay and its adjacent coastal waters showed that there were significant seasonal, interannual, and spatial variations of hypoxia in near-bottom waters. Hypoxia events occurred from June, when the stratification of the water column started to develop. Hypoxia occurrence reached a maximum in August, when the high-salinity and cold South China Sea subsurface water continuously intruded into and resided in Mirs Bay and the coastal waters for several months. The eastward Zhujiang River plume covered the southern surface waters around Hong Kong, and also created and maintained favorable physical conditions for hypoxia formation. After late September, river discharge and solar radiation decreased, leading to a breakdown of water column stratification and the ventilation of near-bottom waters. Thus, bottom hypoxia exhibited seasonal variation in Mirs Bay and the southern coastal waters near Hong Kong.
The vertical density difference was positively related to the bottom AOU and negatively related to the bottom DO, indicating that water column stratification supported an essential prerequisite for the formation of bottom hypoxia. The relationship between AOU and nutrients in the near-bottom waters did not follow the classic Redfield ratio. It suggested that AOU was not only due to the aerobic degradation of marine biogenic organic matter, and that local eutrophication might not be the only important source of oxygen depletion. Over the past few decades, COD and NH4 emissions have increased markedly and contributed to the consumption of DO in the study area. The annual increase in nitrate exacerbated eutrophication and increased the probability of hypoxia.
The water column of the shelf zone was characterized by ocean characteristics, with the lowest chlorophyll-a, nutrient, and BOD5 concentrations compared with Mirs Bay and the transition zone. Therefore, bottom hypoxia was seldom observed in the shelf zone, although it was also strongly stratified during summer.
The relationship between AOU and inorganic nutrients in Mirs Bay did not follow the Redfield ratio, indicating that the source of oxygen consumption was not only derived from marine-sourced organic matter. Other oxygen-consuming substances, such as organic matter and ammonia released from the peripheral area, should also contribute to the AOU. The high NH4, TKN in the sediment and longest residence time of the near-bottom water in Mirs Bay increased the risk of bottom hypoxia events, even though the nutrient contents were lower than those in the transition zone.
The DO distribution and hypoxia were affected by local inputs of oxygen-depleting organic matter from the peripheral areas of Mirs Bay. Future work needs to be done to better understand and quantify the drivers responsible for the development and maintenance of bottom hypoxia in Mirs Bay.
6 DATA AVAILABILITY STATEMENTAll data generated and/or analyzed during this study are available from Environmental Protection Department of the Hong Kong Government, https://cd.epic.epd.gov.hk/EPICRIVER/marine/?lang=en.
7 ACKNOWLEDGMENTWe thank the Environmental Protection Department of the Hong Kong Government for providing the relevant data and allowing us to use them.
Electronic supplementary material
Supplementary material (Supplementary Fig.S1) is available in the online version of this article at https://doi.org/10.1007/s00343-022-2025-1.
Bianchi T S, DiMarco S F, Cowan Jr J H, et al. 2010. The science of hypoxia in the Northern Gulf of Mexico: a review. Science of the Total Environment, 408(7): 1471-1484.
DOI:10.1016/j.scitotenv.2009.11.047 |
Breitburg D, Levin L A, Oschlies A, et al. 2018. Declining oxygen in the global ocean and coastal waters. Science, 359(6371): eaam7240.
DOI:10.1126/science.aam7240 |
Brunet R C, Garcia-Gil L J. 1996. Sulfide-induced dissimilatory nitrate reduction to ammonia in anaerobic freshwater sediments. FEMS Microbiology Ecology, 21(2): 131-138.
DOI:10.1111/j.1574-6941.1996.tb00340.x |
Cai W J, Hu X P, Huang W J, et al. 2011. Acidification of subsurface coastal waters enhanced by eutrophication. Nature Geoscience, 4(11): 766-770.
DOI:10.1038/ngeo1297 |
Chen C C, Gong G C, Shiah F K. 2007. Hypoxia in the East China Sea: one of the largest coastal low-oxygen areas in the world. Marine Environmental Research, 64(4): 399-408.
DOI:10.1016/j.marenvres.2007.01.007 |
Conley D J, Humborg C, Rahm L, et al. 2002. Hypoxia in the Baltic Sea and basin-scale changes in phosphorus biogeochemistry. Environmental Science & Technology, 36(24): 5315-5320.
DOI:10.1021/es025763w |
Dai M H, Guo X H, Zhai W D, et al. 2006. Oxygen depletion in the upper reach of the Pearl River estuary during a winter drought. Marine Chemistry, 102(1-2): 159-169.
DOI:10.1016/j.marchem.2005.09.020 |
Diaz R J. 2001. Overview of Hypoxia around the World. Journal of Environmental Quality, 30(2): 275-281.
DOI:10.2134/jeq2001.302275x |
Geeraert N, Archana A, Xu M N, et al. 2021. Investigating the link between Pearl River-induced eutrophication and hypoxia in Hong Kong shallow coastal waters. Science of the Total Environment, 772: 145007.
DOI:10.1016/j.scitotenv.2021.145007 |
Gray J S, Wu R S S, Or Y Y. 2002. Effects of hypoxia and organic enrichment on the coastal marine environment. Marine Ecology Progress Series, 238: 249-279.
DOI:10.3354/meps238249 |
Guo W, Ye F, Xu S D, et al. 2015. Seasonal variation in sources and processing of particulate organic carbon in the Pearl River estuary, South China. Estuarine Coastal and Shelf Science, 167: 540-548.
DOI:10.1016/j.ecss.2015.11.004 |
Huang X P, Huang L M. 2003. Hydrodynamic characteristics of Dapeng Bay and its ecological and environmental effects. Journal of Tropical Oceanography, 22(5): 47-54.
(in Chinese with English abstract) |
Kemp W M, Testa J M, Conley D J, et al. 2009. Temporal responses of coastal hypoxia to nutrient loading and physical controls. Biogeosciences, 6(12): 2985-3008.
DOI:10.5194/bg-6-2985-2009 |
Lee J H W, Harrison P J, Kuang C et al. 2006. Eutrophication dynamics in Hong Kong coastal waters: physical and biological interactions. In: Wolanski E ed. The Environment in Asia Pacific Harbours. Springer, Dordrecht. p. 187-206, https://doi.org/10.1007/1-4020-3655-8_13.
|
Li X L, Shi H M, Xia H Y, et al. 2014. Seasonal hypoxia and its potential forming mechanisms in the Mirs Bay, the northern South China Sea. Continental Shelf Research, 80: 1-7.
DOI:10.1016/j.csr.2014.03.003 |
Li X L, Zhou Y P, Xia H Y. 2012. Multi-year measurements of carbon, nitrogen and phosphorus and sources of organic matter in the surface sediments of the Mirs Bay. Acta Scientiae Circumstantiae, 32(5): 1113-1119.
(in Chinese with English abstract) |
Liu J, Hills P. 1998. Sustainability and coastal zone management in Hong Kong—the case of Mirs Bay. International Journal of Sustainable Development & World Ecology, 5(1): 11-26.
DOI:10.1080/13504509809469966 |
Luo L, Li S Y, Wang D X. 2009. Hypoxia in the Pearl River Estuary, the South China Sea, in July 1999. Aquatic Ecosystem Health & Management, 12(4): 418-428.
DOI:10.1080/14634980903352407 |
Luo X, Jiao J J, Moore W S, et al. 2018. Significant chemical fluxes from natural terrestrial groundwater rival anthropogenic and fluvial input in a large-river deltaic estuary. Water Research, 144: 603-615.
DOI:10.1016/j.watres.2018.07.004 |
McCarthy M J, McNeal K S, Morse J W, et al. 2008. Bottom-water hypoxia effects on sediment-water interface nitrogen transformations in a seasonally hypoxic, shallow bay (Corpus Christi Bay, TX, USA). Estuaries and Coasts, 31(3): 521-531.
DOI:10.1007/s12237-008-9041-z |
Middelburg J J, Levin L A. 2009. Coastal hypoxia and sediment biogeochemistry. Biogeosciences, 6(7): 1273-1293.
DOI:10.5194/bg-6-1273-2009 |
Naqvi S W A, Bange H W, Farías L, et al. 2010. Marine hypoxia/ anoxia as a source of CH4 and N2O. Biogeosciences, 7(7): 2159-2190.
DOI:10.5194/bg-7-2159-2010 |
Rabalais N N, Díaz R J, Levin L A, et al. 2010. Dynamics and distribution of natural and human-caused hypoxia. Biogeosciences, 7(2): 585-619.
DOI:10.5194/bg-7-585-2010 |
Rabalais N N, Turner R E, Wiseman Jr W J. 2002. Gulf of Mexico hypoxia, A. K. A. "The dead zone". Annual Review of Ecology and Systematics, 33: 235-263.
DOI:10.1146/annurev.ecolsys.33.010802.150513 |
Rabouille C, Conley D J, Dai M H, et al. 2008. Comparison of hypoxia among four river-dominated ocean margins: the Changjiang (Yangtze), Mississippi, Pearl, and Rhône rivers. Continental Shelf Research, 28(12): 1527-1537.
DOI:10.1016/j.csr.2008.01.020 |
Rakocinski C F, Menke D P. 2016. Seasonal hypoxia regulates macrobenthic function and structure in the Mississippi Bight. Marine Pollution Bulletin, 105(1): 299-309.
DOI:10.1016/j.marpolbul.2016.02.006 |
Redfield A C, Ketchum B H, Richards F A. 1963. The influence of organisms on the composition of seawater. In: Hill M N ed. The Sea. John Wiley, New York. p. 26-77.
|
Scully M E. 2010. Wind modulation of dissolved oxygen in Chesapeake Bay. Estuaries and Coasts, 33(5): 1164-1175.
DOI:10.1007/s12237-010-9319-9 |
Silva N, Vargas C A. 2014. Hypoxia in Chilean Patagonian Fjords. Progress in Oceanography, 129: 62-74.
DOI:10.1016/j.pocean.2014.05.016 |
Su J Z, Dai M H, He B Y, et al. 2017. Tracing the origin of the oxygen-consuming organic matter in the hypoxic zone in a large eutrophic estuary: the lower reach of the Pearl River Estuary, China. Biogeosciences, 14: 4085-4099.
DOI:10.5194/bg-14-4085-2017 |
Topcu H D, Brockmann U H. 2015. Seasonal oxygen depletion in the North Sea, a review. Marine Pollution Bulletin, 99(1-2): 5-27.
DOI:10.1016/j.marpolbul.2015.06.021 |
Xia H Y, Li X L, Han K. 2011. Studies on the environmental capacity of the Dapeng Bay, Part Ⅰ: numerical study of water self-purification capacity. China Environmental Science, 31(12): 2031-2038.
|
Yin K D. 2002. Monsoonal influence on seasonal variations in nutrients and phytoplankton biomass in coastal waters of Hong Kong in the vicinity of the Pearl River estuary. Marine Ecology Progress Series, 245: 111-122.
DOI:10.3354/meps245111 |
Yin K D, Lin Z F, Ke Z Y. 2004. Temporal and spatial distribution of dissolved oxygen in the Pearl River Estuary and adjacent coastal waters. Continental Shelf Research, 24(16): 1935-1948.
DOI:10.1016/j.csr.2004.06.017 |
Yin K D, Xu J, Harrison P J. 2010. A comparison of eutrophication processes in three Chinese subtropical semi-enclosed embayments with different buffering capacities. In: Kennish M, Paerl H W eds. Coastal Lagoons: Critical Habitats of Environmental Change. CRC Press, Boca Raton. p. 367-398.
|
Zhang H, Cheng W C, Chen Y R, et al. 2018. Controls on the interannual variability of hypoxia in a subtropical embayment and its adjacent waters in the Guangdong coastal upwelling system, northern South China Sea. Ocean Dynamics, 68(8): 923-938.
DOI:10.1007/s10236-018-1168-2 |
Zhang J, Gilbert D, Gooday A J, et al. 2010. Natural and human-induced hypoxia and consequences for coastal areas: synthesis and future development. Biogeosciences, 7(5): 1443-1467.
DOI:10.5194/bg-7-1443-2010 |
Zhu Z Y, Zhang J, Wu Y, et al. 2011. Hypoxia off the Changjiang (Yangtze River) Estuary: oxygen depletion and organic matter decomposition. Marine Chemistry, 125(1-4): 108-116.
DOI:10.1016/j.marchem.2011.03.005 |
Zu T, Gan J. 2015. A numerical study of coupled estuary-shelf circulation around the Pearl River Estuary during summer: responses to variable winds, tides and river discharge. Deep-Sea Research Ⅱ, 117: 53-64.
DOI:10.1016/j.dsr2.2013.12.010 |