Institute of Oceanology, Chinese Academy of Sciences
Article Information
- WU Meilin, XUE Huijie, CHAI Fei
- Asymmetric chlorophyll responses enhanced by internal waves near the Dongsha Atoll in the South China Sea
- Journal of Oceanology and Limnology, 41(2): 418-426
- http://dx.doi.org/10.1007/s00343-022-1434-5
Article History
- Received Dec. 29, 2021
- accepted in principle Feb. 9, 2022
- accepted for publication Mar. 7, 2022
2 State Key Laboratory of Tropical Oceanography, South China Sea Institute of Oceanology, Chinese Academy of Sciences, Guangzhou 510301, China;
3 Southern Marine Science and Engineering Guangdong Laboratory (Guangzhou), Guangzhou 511458, China;
4 Innovation Academy of South China Sea Ecology and Environmental Engineering, Chinese Academy of Sciences, Guangzhou 510301, China
Internal waves (IWs) are ubiquitous in stratified oceans across the globe, especially on continental shelves and in marginal seas with steep topography features. IWs can mix water vertically via turbulent mixing when they propagate into continental shelves and impinge upon rough bottom topography, where they break and dissipate. Therefore, IW dissipation may play an important role in vertical nutrient supply and may be responsible for increasing phytoplankton biomass in areas with vigorous IWs. Previous studies have shown that there are three major processes leading to enhanced surface chlorophyll a (Chl a): 1) entrainment mixing from a pre-existing subsurface chlorophyll maximum (Da Silva et al., 2002), 2) diapycnal mixing in the upper layer, lifting nutrients to the surface layer (Holligan et al., 1985), and 3) horizontal transport from coastal waters with high Chl a (Vázquez et al., 2009).
The Dongsha Plateau is on the shelf of the northern South China Sea (nSCS), where IWs are very active during spring and summer. About 78% of IW packets are concentrated within a range from 116°E to 118°E. This area is a transition zone from the deep basin to the continental shelf, with depth shoaling from 1 000 to 100 m (Zheng et al., 2007). The IWs in the nSCS pass through the Dongsha Atoll (DSA) area mainly during spring and summer (April–August); they are less frequent during autumn and winter (October – February) (Zheng et al., 2007; Ho et al., 2009). These IWs originate in the Luzon Strait, propagate westward into the nSCS, and then impinge upon the DSA (Alford et al., 2015). Most of them reach the continental shelf break east of the DSA and dissipate a large fraction of their energy in this area (Zhao et al., 2004; Wang et al., 2011, 2013; Li et al., 2013). The IW energy flux decreases sharply from 8.50 kW/m on the Dongsha Plateau to 0.25 kW/m on the continental shelf about 220 km to the west (Chang et al., 2006). The maximum turbulent dissipation and diapycnal mixing rate of the IWs also occur near the Dongsha Plateau (Xu et al., 2012). Energy is converted into small-scale motion or overturns and dissipates in the upper ocean layer. Consequently, IW dissipation results in strong vertical mixing, which brings the subsurface Chl-a maximum to the surface and increases the surface chlorophyll concentration. Another impact of enhanced vertical mixing is entrainment of the deep nutrient-rich water, which stimulates phytoplankton growth in the euphotic layer. Surface Chl a increased dramatically after the passage of IWs at the DSA (Wang et al., 2007; Pan et al., 2013). The Chl a on the northern side of the DSA was 43% higher than that in a nearby area not affected by IWs (Pan et al., 2012). These studies focused on one individual IW and its impact on surface Chl a near the DSA. Satellite remote sensing observations show a clear north-south asymmetric distribution of surface Chl a during spring and summer (Pan et al., 2012).
In this study, satellite-derived Chl-a data were used to explore the mechanisms that cause the north-south asymmetric distribution of Chl a at the DSA from April to September. This paper is organized as follows. Section 2 covers the materials and methods used in this study, including MODISA Chl-a data and the observed nutrient concentration. Section 3 documents the asymmetric distribution in phytoplankton responses to IWs, including the normalized time series of Chl a on the northern and southern sides of the DSA during 40 IWs. Section 4 gives a summary and the conclusions of this study.
2 DATA AND METHODRemote sensing images of the nSCS from 1995 to 2001 were used to identify 116 internal wave packets. The images were captured by a variety of satellites including ERS-1/2, RADARSAT-1, and SPOT (Zhao et al., 2004). IWs occurred in these images 12–28 times each year between April and September (Zheng et al., 2007; Ho et al., 2009). After considering the influence of clouds on satellite ocean color measurements and extreme events such as passages of typhoons, 40 IWs were included in our analysis (Table 1).
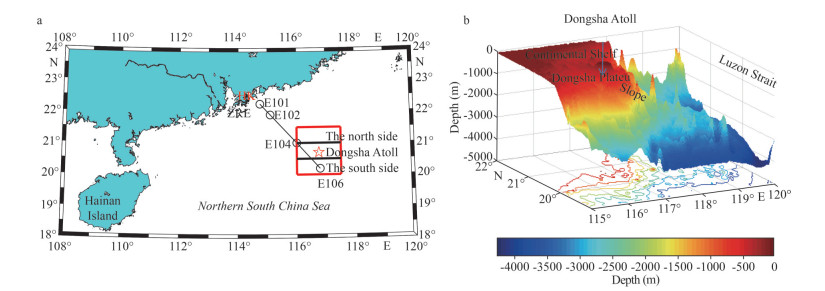
We analyzed daily and monthly MODISA level-3 Chl-a remote sensing data with a spatial resolution of 4 km×4 km from July 2002 to December 2014 (http://oceancolor.gsfc.nasa.gov/cms/). We also included some observational data on both sides of the DSA from a research cruise in the nSCS during September 2004. Water samples from the surface to the bottom were taken with Niskin bottles. Nutrient concentrations were determined in triplicate using methods from "The specialties for oceanography survey (GB12763-91, China)." To examine the asymmetric distribution of Chl a at the DSA, this study focused on the area from 20°N to 21.5°N and from 116°E to 117.5°E (Fig. 1). To show a clearer distribution of Chl a near the DSA, the shallow-water area inside the atoll was masked out.
|
| Fig.1 Location and topography of the study area a. the study area (red box) and four field observational stations along a transect during September 2004. Location of the DSA is denoted by a star; b. three-dimensional topography of the study area. ZRE: Zhujiang (Pearl) River estuary; HK: Hong Kong. |
IWs are observed year-round in the nSCS, but are more active during summer and less active in winter (Wang et al., 2011). During summer, the upper layer of the nSCS is strongly stratified, which favors the formation of nonlinear solitary IWs (Qu et al., 2007; Shaw et al., 2009). The high occurrence frequencies (> 8%) are from April to September, while there is a minimum frequency of 1.5% from December to February (Zheng et al., 2007). In this study, we focused on the high IW occurrence period from April to September. Since IWs play an important role in determining the asymmetric distribution of Chl a in the DSA area (Pan et al., 2012), we asked whether the asymmetric pattern is more pronounced during the summer, corresponding to more frequent occurrence of IWs. Figure 2 shows the monthly climatological distribution of Chl a averaged from 2002 to 2014.

|
| Fig.2 Monthly climatological mean Chl a between 2002 and 2014 derived from MODISA level-3 data The white box represents the DSA area that was masked out because much higher Chl a existed inside the shallower-water area. |
There are two distinguishing features of the Chl- a distribution in the DSA. First, the spatial variation was greater in the north-south direction than in the east-west direction. Second, from October to the following March, Chl a was almost uniform meridionally across the DSA.
The Chl-a level from April to September was higher by 30% on the northern side than on the southern side (Fig. 2). Moreover, the north-south asymmetry of Chl a was most pronounced in April, June, and July. The occurrence frequency of IWs in the nSCS reached a peak in June (Zheng et al., 2007) and July (Ho et al., 2009), so the Chl-a level was expected to be high on the northern side during June and July (Fig. 2). We used the 40 IWs that occurred from April to September (Table 1) to explore the mechanisms of asymmetric distribution of Chl a with respect to IW events. Strong wind-induced vertical mixing in April may play a role in increasing the surface Chl a. Average wind speed at the DSA during April–August 2013 was 1.8 m/s (http://dongsha.mr.nsysu.edu.tw). Average mixed layer depth (MLD) in the nSCS was 80, 40, 28, and 43 m in winter, spring, summer, and autumn, respectively (Chen, 2005). Average surface Chl a in the South China Sea (SCS) was 0.29, 0.14, 0.10, and 0.11 mg/m3 in winter, spring, summer, and autumn, respectively (Chen, 2005). From March to May, the wind changes from a northeasterly monsoon to a southwesterly monsoon. Vertical mixing in the nSCS gradually decreases, which contributes to a decrease in surface Chl a from March to May on the northern side of the DSA. IWs become more active beginning in April, which may contribute to higher surface Chl a on the northern side of the DSA from April onward. The IW occurrence frequency is higher (roughly 11%) in April than from October to February (Zheng et al., 2007). Therefore, it is necessary to distinguish the contribution to increasing Chl a from vertical mixing and from IW breaking. We will discuss these two mechanisms further in the following two subsections.
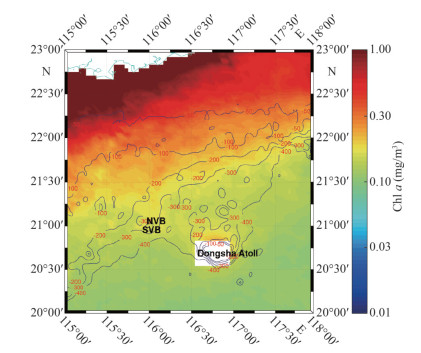
It is unknown whether horizontal transportation from the coastal waters induces higher Chl a near the DSA. A suction process takes place by which coastal waters with higher chlorophyll are drawn toward the center of the channel and then accompany the IWs as they move toward the Alboran Sea (Vázquez et al., 2009). In our study, if horizontal transportation contributed to higher chlorophyll north of the DSA, we would expect to see a continuous decrease from the coastal region to the northern side of the DSA. However, there is an area with lower Chl-a concentration between the northern shelf and the DSA (Fig. 3), which corresponds to the SCS Warm Current along the slope (Hu et al., 2010; Wang et al., 2010). Based on the remote sensing analysis here, the higher Chl a near the DSA is a result of local production instead of horizontal transportation from the coastal zone (Pan et al., 2012).
|
| Fig.3 Composite Chl a from April to September during 2002–2014 The streak of water with lower Chl a lies between the 300-m isobath on the onshore shelf and 300-m isobath on the northern side of the Dongsha Atoll. Blue contours are water depths. NVB and SVB denote the North Vereber Bank and the South Vereber Bank, respectively. |
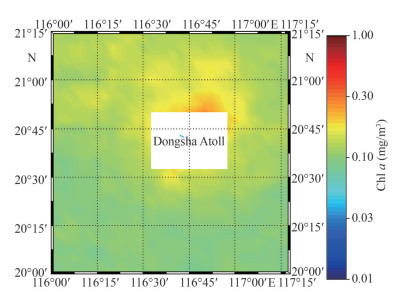
A five-day composite of Chl a at the DSA after the passage of 40 IWs is shown in Fig. 4. The Chl-a level around the DSA was significantly higher than in the rest of the study area. In particular, the northern side had Chl a higher (0.13 mg/m3) than the southern side (0.10 mg/m3). The water depth north of the DSA is less than 200 m, where the topography favors IW breaking and dissipation (Fig. 1). South of the DSA, water depth abruptly increases to more than 700 m (see Fig. 1) where IWs can propagate freely without breaking and strong dissipation (Wang et al., 2011).
|
| Fig.4 Composite map of Chl a averaged from day +1 to day +5 after the passage of 40 IWs near Dongsha in the nSCS The area of the atoll is masked out due to the much higher Chl a inside the shallow-water area. |
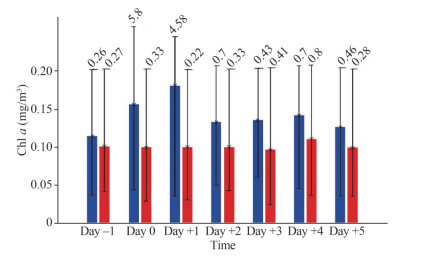
To analyze the north-south asymmetric distribution of Chl a near the DSA, a more detailed time series of Chl-a changes was used. The normalized, composite Chl-a time series was considered to be Day –1 prior to the arrival of IWs, Day 0 during the passing of IWs, and Day +1 to Day +5 after the passage of IWs. Figure 5 shows that Chl a increased dramatically on the northern side of the DSA during these observed IW events, especially during Day 0 (0.15 mg/m3) and Day +1 (0.18 mg/m3). Chl a then remained relatively constant at 0.13 mg/m3 from Day +2 to Day +5. In contrast, Chl a was stable at 0.10 mg/m3 on the southern side of the DSA during the same period (Fig. 5). One day before an IW event (Day –1), Chl a was higher by ~14% on the northern side than on the southern side, suggesting that an asymmetric distribution of Chl a existed near the DSA. However, the asymmetry of Chl a between the northern and southern sides were intensified significantly during and after IW events. On average, Chl a was ~60% higher on the northern side than on the southern side during these 40 IW events. One day after the IW events, Chl a on the northern side was almost twice the value on the southern side.
|
| Fig.5 Time series of Chl-a concentration on the northern (blue) and southern (red) sides of the DSA before, during, and after the passage of 40 IW events Error bar donates the range of Chl a. The number at the top is the maximum Chl a. |
One hypotheses, based on observations in the central Bay of Biscay, is that the elevated surface Chl-a results from the uplifting of subsurface Chl-a maximum by passing IWs (Da Silva et al., 2002). The time series described in Fig. 5 appears to imply that the Chl-a increase on the northern side was induced directly by entrainment from a pre-existing subsurface chlorophyll maximum. Given the rapid and short response of surface Chl a during the passage of IWs, it is unlikely that the increase in surface Chl a was attributable to new phytoplankton biomass growth associated with the injection of nutrients from subsurface by IWs. Phytoplankton blooms generally last for several days with an increase, which is followed by a decreasing trend in phytoplankton concentration. For example, in the Gulf of Maine phytoplankton abundance began to rise, peaked a few days later, and went back to the background level (McGillicuddy et al., 2014). However, in our study, high surface chlorophyll values lasted for only two days (Day 0 and Day +1) during the passages of all 40 IW events, and then abruptly decreased at Day +2. From Day +2 to Day +5 after the passage of the 40 IWs in Table 1, the surface Chl-a concentration was still slightly higher than the value before the IW arrival (Day –1). In summary, the high surface chlorophyll concentration was a result of IW breaking causing the uplift of a pre-existing subsurface Chl-a maximum. This conclusion is in agreement with a previous study of individual IWs near Dongsha (Pan et al., 2012).
3.3 Phytoplankton growth after the passage of IWsAfter the passage of IWs on the northern side of the DSA, the surface Chl-a concentration was slightly higher (0.13 mg/m3) than the value before the arrival of IWs (0.11 mg/m3) (see Fig. 5). This enhanced surface Chl a might be the result of new phytoplankton biomass growth due to the injection of nutrients from IW breaking. Some studies reported that IWs were generated in the Luzon Strait, propagated westward, and impinged upon the Dongsha Slope (Alford et al., 2015). Most of the westward propagating IWs broke and dissipated on the northern side of the DSA. IW breaking and dissipation can make the upper water column homogenous, which can bring nutrient-rich deep water to the surface layer. Injection of nutrient-rich deep water can lead to phytoplankton growth and produce more biomass at the surface, but an increase in surface chlorophyll due to additional new phytoplankton biomass may take a few days. We speculate that surface chlorophyll increases a few days after the passage of IWs on the northern side of the DSA may be due to nutrient enhancement by IW breaking and dissipation.
We separated the surface Chl a into three components: background level (e.g., the value before the arrival of IWs); uplift of subsurface Chl-a maximum (e.g., Day 0 and Day +1); and newly produced phytoplankton biomass due to nutrient injection caused by IWs. The rapid increase of surface chlorophyll from 0.11 mg/m3 on Day –1 to 0.18 mg/m3 on Day +1 represents a 64% increase, which was due to the uplift of a pre-existing subsurface Chl- a maximum. The injection of nutrients is assumed to support phytoplankton growth from Day +2 to Day +5, which accounts for an 18% increase.
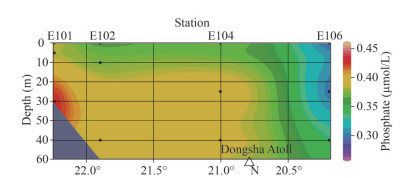
In addition to the enhancement of vertical mixing due to IW breaking and dissipation, nutrient concentration and vertical distribution near the DSA were also important in the injection of nutrients to the surface. Figure 6 shows the distribution of phosphate in the upper layer from the coastal region to the DSA. The average phosphate concentration in the upper layer decreased from 0.41 μmol/L in the coastal water (E101) to 0.37 μmol/L in the shelf region (E102). It increased slightly to 0.40 μmol/L on the northern side of the DSA (E104), but decreased to 0.30 μmol/L on the southern side (E106). These measurements are in good agreement with results from He et al. (2009), which reported that the mean value of phosphate concentration at the surface was as high as 0.3 μmol/L during September. Phosphate concentration was slightly higher on the northern side of the DSA (E104) than that on the shelf (E102) or the southern side (E106). This indicates that the high phosphate level in the surface layer on the northern side of the DSA may result from frequent IW breaking and dissipation, which would inject nutrients to support new phytoplankton growth locally.
|
| Fig.6 Distribution of phosphate (unit: μmol/L) on the northern side (E104: 116.0031°E; 21.0026°N) and the southern side (E106: 116.7914°E; 20.1923°N) of the DSA on September 19, 2004 The dots denote the sampling depths. |
MODIS Chl-a data from 2002 to 2014 were used to examine the distribution of Chl a near the DSA. Composite Chl a from 40 IWs during spring and summer showed a stronger response on the northern side than on the southern side of the DSA. The normalized time series of surface Chl a on the northern side increased from 0.11 to 0.18 mg/m3 one day after the passage of IWs, decreased to 0.13 mg/m3 over the next four days, and then remained relatively constant for several days.
The physical and biological interactions and unique topographic setting near the DSA caused the north-south asymmetric distribution of surface Chl a in the region. The schematic diagram illustrates the detailed mechanisms that were responsible for the north-south asymmetric distribution of phytoplankton, which were induced by IWs near the DSA (Fig. 7). The IWs are generated in the Luzon Strait, propagate westward into the nSCS, and then impinge upon the Dongsha Slope. Most of the IWs break and dissipate on the northern side of the DSA, resulting in strong vertical mixing that uplifts the subsurface Chl-a maximum. The enhanced mixing injects nutrient-rich deep waters into the surface layer, which stimulates new phytoplankton growth. To the southern side of the DSA, IWs continue to propagate westward freely due to deeper water depth. The north-south difference of IW activity near the DSA intensifies the asymmetric distribution of surface Chl a during the spring and summer. More detailed studies, including coupled physical-biological models, will help to address the effects of IWs on nutrient transport and vertical displacement of subsurface chlorophyll maximum, and their long-term impacts on physical and biological processes in the nSCS.

|
| Fig.7 Schematic diagram of the mechanisms responsible for the asymmetric distribution of phytoplankton induced by internal waves at the Dongsha Atoll |
The 40 IWs in time and location of internal wave events during 2002–2011 are available in table of this study. The daily and monthly MODISA level-3 Chl-a remote sensing data with a spatial resolution of 4 km×4 km from July 2002 to December 2014 is available for webpage (http://oceancolor.gsfc.nasa.gov/cms/).
Alford M H, Peacock T, MacKinnon J A, et al. 2015. The formation and fate of internal waves in the South China Sea. Nature, 521(7550): 65-69.
DOI:10.1038/nature14399 |
Chang M H, Lien R C, Tang T Y, et al. 2006. Energy flux of nonlinear internal waves in northern South China Sea. Geophysical Research Letters, 33(3): L03607.
|
Chao Y H, Hsu M K, Chen H W, et al. 2008. Sieving nonlinear internal waves through path prediction. International Journal of Remote Sensing, 29: 6391-6402.
DOI:10.1080/01431160802175413 |
Chen G Y, Liu C T, Wang Y H, et al. 2011. Interaction and generation of long-crested internal solitary waves in the South China Sea. Journal of Geophysical Research-Oceans, 116: C06013.
DOI:10.1029/2010JC006392 |
Chen G Y, Wu R J, Wang Y H. 2010. Interaction between internal solitary waves and an isolated atoll in the Northern South China Sea. Ocean Dynamics, 60: 1285-1292.
DOI:10.1007/s10236-010-0323-1 |
Chen Y L L. 2005. Spatial and seasonal variations of nitrate-based new production and primary production in the South China Sea. Deep Sea Research Part I: Oceanographic Research Papers, 52(2): 319-340.
DOI:10.1016/j.dsr.2004.11.001 |
Chen Y F L, Chen H Y. 2006. Seasonal dynamics of primary and new production in the northern South China Sea: the significance of river discharge and nutrient advection. Deep-Sea Research Part I-Oceanographic Research Papers, 53: 971-986.
DOI:10.1016/j.dsr.2006.02.005 |
Da Silva J C B, New A L, Srokosz M A, et al. 2002. On the observability of internal tidal waves in remotely-sensed ocean colour data. Geophysical Research Letters, 29(12): 1569.
DOI:10.1029/2001GL013888 |
DeCarlo T M, Karnauskas K B, Davis K A, et al. 2015. Climate modulates internal wave activity in the Northern South China Sea. Geophysical Research Letters, 42: 831-838.
DOI:10.1002/2014GL062522 |
Fu K H, Wang Y H, St Laurent L, et al. 2012. Shoaling of large-amplitude nonlinear internal waves at Dongsha Atoll in the northern South China Sea. Continental Shelf Research, 37: 1-7.
DOI:10.1016/j.csr.2012.01.010 |
Guo C, Chen X. 2014. A review of internal solitary wave dynamics in the northern South China Sea. Progress in Oceanography, 121: 7-23.
DOI:10.1016/j.pocean.2013.04.002 |
Guo C, Vlasenko V, Alpers W, et al. 2012. Evidence of short internal waves trailing strong internal solitary waves in the northern South China Sea from synthetic aperture radar observations. Remote Sensing of Environment, 124: 542-550.
DOI:10.1016/j.rse.2012.06.001 |
He L, Yin K D, Yuan X C, et al. 2009. Spatial distribution of viruses, bacteria and chlorophyll in the northern South China Sea. Aquatic Microbial Ecology, 54(2): 153-162.
|
Ho C R, Su F C, Kuo N J et al. 2009. Internal wave observations in the northern South China Sea from satellite ocean color imagery. In: Oceans 2009-Europe. IEEE, Bremen. p. 1-5.
|
Holligan P M, Pingree R D, Mardell G T. 1985. Oceanic solitons, nutrient pulses and phytoplankton growth. Nature, 314(6009): 348-350.
DOI:10.1038/314348a0 |
Hong D B, Yang C S, Ouchi K. 2015. Estimation of internal wave velocity in the shallow South China Sea using single and multiple satellite images. Remote Sensing Letters, 6: 448-457.
DOI:10.1080/2150704X.2015.1034884 |
Hsu M-K, Liu A K. 2000. Nonlinear internal waves in the South China Sea. Canadian Journal of Remote Sensing, 26: 72-81.
DOI:10.1080/07038992.2000.10874757 |
Hu J Y, Kawamura H, Li C Y, et al. 2010. Review on current and seawater volume transport through the Taiwan Strait. Journal of Oceanography, 66(5): 591-610.
DOI:10.1007/s10872-010-0049-1 |
Li X F, Jackson C R, Pichel W G. 2013. Internal solitary wave refraction at Dongsha Atoll, South China Sea. Geophysical Research Letters, 40(12): 3128-3132.
DOI:10.1002/grl.50614 |
Lien R C, D'Asaro E A, Henyey F, et al. 2012. Trapped core formation within a shoaling nonlinear internal wave. Journal of Physical Oceanography, 42: 511-525.
DOI:10.1175/2011JPO4578.1 |
Lien R C, Henyey F, Ma B, et al. 2014. Large-amplitude internal solitary waves observed in the northern South China Sea: properties and energetics. Journal of Physical Oceanography, 44: 1095-1115.
DOI:10.1175/JPO-D-13-088.1 |
Lin F L, Hou Y J, Liu Y H, et al. 2014. Internal solitary waves on the southwest shelf of Dongsha Island observed from mooring ADCP. Chinese Journal of Oceanology and Limnology, 32: 1179-1187.
DOI:10.1007/s00343-014-3254-8 |
Liu B, Yang H, Ding X et al. 2013. Fusion of SAR and MODIS images for oceanic internal waves tracking in the South China Sea. The 8th Symposium on Multispectral Image Processing and Pattern Recognition (MIPPR) -Remote Sensing Image Processing, Geographic Information Systems, and Other Applications. Wuhan, China.
|
Liu B Q, Yang H, Ding X W, et al. 2014. Tracking the internal waves in the South China Sea with environmental satellite sun glint images. Remote Sensing Letters, 5: 609-618.
DOI:10.1080/2150704X.2014.949365 |
McGillicuddy D J Jr, Brosnahan M L, Couture D A, et al. 2014. A red tide of Alexandrium fundyense in the gulf of Maine. Deep Sea Research Part II: Topical Studies in Oceanography, 103: 174-184.
DOI:10.1016/j.dsr2.2013.05.011 |
Pan X J, Wong G T F, Ho T Y, et al. 2013. Remote sensing of picophytoplankton distribution in the northern South China Sea. Remote Sensing of Environment, 128: 162-175.
DOI:10.1016/j.rse.2012.10.014 |
Pan X J, Wong G T F, Shiah F K, et al. 2012. Enhancement of biological productivity by internal waves: observations in the summertime in the northern South China Sea. Journal of Oceanography, 68(3): 427-437.
DOI:10.1007/s10872-012-0107-y |
Qu T D, Du Y, Gan J P, et al. 2007. Mean seasonal cycle of isothermal depth in the South China Sea. Journal of Geophysical Research: Oceans, 112(C2): C02020.
|
Shaw P T, Ko D S, Chao S Y. 2009. Internal solitary waves induced by flow over a ridge: with applications to the northern South China Sea. Journal of Geophysical Research: Oceans, 114(C2): C02019.
|
Su F C, Ho C R, Zheng Q, et al. 2008. Estimating amplitudes of internal waves using satellite ocean colour imagery of the South China Sea. International Journal of Remote Sensing, 29: 6373-6380.
DOI:10.1080/01431160802175397 |
Tang Q S, Wang C X, Wang D X, et al. 2014. Seismic, satellite, and site observations of internal solitary waves in the NE South China Sea. Scientific Reports, 4: 5374.
DOI:10.1038/srep05374 |
Vázquez A, Flecha S, Bruno M, et al. 2009. Internal waves and short-scale distribution patterns of chlorophyll in the strait of Gibraltar and Alborán Sea. Geophysical Research Letters, 36(23): L23601.
DOI:10.1029/2009GL040959 |
Wang D X, Hong B, Gan J P, et al. 2010. Numerical investigation on propulsion of the counter-wind current in the northern South China Sea in winter. Deep Sea Research Part I: Oceanographic Research Papers, 57(10): 1206-1221.
DOI:10.1016/j.dsr.2010.06.007 |
Wang J, Huang W G, Yang J S et al. 2011. The distribution, sources, and propagation of internal waves in South China Sea based on satellite remote sensing. In: Proceedings of the Seventh International Symposium on Multispectral Image Processing and Pattern Recognition. SPIE, Guilin. p. 80062E.
|
Wang J, Huang W G, Yang J S, et al. 2013. Study of the propagation direction of the internal waves in the South China Sea using satellite images. Acta Oceanologica Sinica, 32(5): 42-50.
DOI:10.1007/s13131-013-0312-6 |
Wang Y H, Dai C F, Chen Y Y. 2007. Physical and ecological processes of internal waves on an isolated reef ecosystem in the South China Sea. Geophysical Research Letters, 34(18): L18609.
DOI:10.1029/2007GL030658 |
Xu J X, Xie J S, Chen Z W, et al. 2012. Enhanced mixing induced by internal solitary waves in the South China Sea. Continental Shelf Research, 49: 34-43.
DOI:10.1016/j.csr.2012.09.010 |
Yang H, Liu B Q, Zhao Z X et al. 2014. Inferring internal wave phase speed from multi-satellite observations. 2014 IEEE International Geoscience and Remote Sensing Symposium (Igarss).
|
Zhao W, Huang X D, Tian J W. 2012. A new method to estimate phase speed and vertical velocity of internal solitary waves in the South China Sea. Journal of Oceanography, 68: 761-769.
DOI:10.1007/s10872-012-0132-x |
Zhao Z X, Klemas V, Zheng Q A, et al. 2004. Remote sensing evidence for baroclinic tide origin of internal solitary waves in the northeastern South China Sea. Geophysical Research Letters, 31(6): L06302.
|
Zheng Q A, Susanto R D, Ho C R, et al. 2007. Statistical and dynamical analyses of generation mechanisms of solitary internal waves in the northern South China Sea. Journal of Geophysical Research: Oceans, 112(C3): C03021.
|
 2023, Vol. 41


