 2023, Vol. 41
Institute of Oceanology, Chinese Academy of Sciences
Article Information
- LI Zhe, QI Haigang, YU Ying, LIU Cong, CONG Rihao, LI Li, ZHANG Guofan
- Near-infrared spectroscopy method for rapid proximate quantitative analysis of nutrient composition in Pacific oyster Crassostrea gigas
- Journal of Oceanology and Limnology, 41(1): 342-351
- http://dx.doi.org/10.1007/s00343-022-1347-3
Article History
- Received Oct. 21, 2021
- accepted in principle Dec. 10, 2021
- accepted for publication Jan. 12, 2022


2 Laboratory for Marine Biology and Biotechnology, Pilot National Laboratory for Marine Science and Technology(Qingdao), Qingdao 266237, China;
3 Laboratory for Marine Fisheries Science and Food Production Processes, Pilot National Laboratory for Marine Science and Technology(Qingdao), Qingdao 266237, China;
4 Public Technical Service Center, Institute of Oceanology, Chinese Academy of Sciences, Qingdao 266071, China;
5 National&Local Joint Engineering Key Laboratory of Ecological Mariculture, Institute of Oceanology, Chinese Academy of Sciences, Qingdao 266071, China;
6 University of Chinese Academy of Sciences, Beijing 100049, China
Oysters (phylum Mollusca, class Bivalvia, order Ostreoida, family Ostreidae) are typical marine bivalves. As filter feeders and reef-builders, they constitute essential components of neritic and estuarine ecosystems (Walles et al., 2016). They are of great economic importance and have a long history as a human food source, playing a considerable role in the fishery and aquaculture industries. The Pacific oyster Crassostrea gigas originated in northeastern Asia and is naturally distributed along the coasts of China, Japan, and Korea. It was introduced to Europe (d'Auriac et al., 2017), Australia (Bishop et al., 2010; Gillies et al., 2018), and America (René, 2005) for aquaculture purposes during the 20th century owing to its fast growth rate, high disease resistance, and ability to adapt to different environments. According to Food and Agriculture Organization records (http://www.fao.org), the annual production of C. gigas in most years from 2005-2019 was over 4.0 million tons. C. gigas has become the oyster species with the highest production worldwide. Owing to its great economic and ecological value, the Pacific oyster has become one of the most well-studied mollusks, with many genetic and genomic resources and considerable breeding programs.
With their delicious taste and abundant nutrients, oysters are among the most popular sea foods. They are rich in glycogen, taurine, free amino acids, unsaturated fatty acids, and zinc (van Houcke et al., 2016; Murata et al., 2020). The glycogen content in the wild oyster population is 14.9%–49.4% of the dry weight (Liu et al., 2019a) and is closely related to amino acids and free fatty acids (Li et al., 2017). The eicosapentaenoic acid and docosahexaenoic acid content in C. gigas is extremely high, accounting for approximately 24% of the proportion of unsaturated fatty acids (Li et al., 2018). Free amino acids play an essential role in the evaluation of the freshness and flavor of aquatic foods. In oysters, flavor amino acids contribute 42.28% of the total amino acid content (Zheng et al., 2014). As the most important umami agent in free amino acids, glutamic acid (Glu) has liver-protection and physiological functions and an extremely high nutritional value (Zhang et al., 2017). Taurine and other special amino acids also contribute to the umami taste of oysters, and sugar can be used to enhance this taste (Teng et al., 2005). As nutrients play essential roles in oyster life processes, particularly in gonad development and gametogenesis which trigger complex energy transformation processes, the concentrations of many nutrients show seasonal variation. For example, the glycogen content is usually higher in winter and lower in summer (Liu et al., 2019a).
The nutrient content strongly influences oyster quality and is emerging as a target trait in genetic and biological research (Qin et al., 2018; Tan et al., 2019). Studies have shown that the glycogen, protein, and fat content in oysters has moderate to high heritability (Liu et al., 2019b), suggesting that it may be feasible to improve oyster meat quality through selective breeding programs. Detection of their nutritional composition is a basic requirement for the evaluation of oyster quality and is also necessary for other research purposes. The protein or amino acid content is generally quantified using an amino acid analyzer, which relies on high-performance liquid chromatography (Smon et al., 2019). The composition of fatty acids is often detected and analyzed using capillary gas chromatography-based methods (Quehenberger et al., 2011). The glycogen content is often determined by a kit that relies on chemical reactions and colorimetric/fluorometric assay methods (Krisman, 1962; Nahorski and Rogers, 1972). The chemical reactions comprise of the reaction of glycogen with concentrated sulfuric acid forming furfural or its derivatives, and then with anthrone or phenol leading to the formation of colored compounds. However, the above-mentioned traditional methods of nutrient quantification are usually complex, difficult to implement, time-consuming, and expensive. There is an urgent need to develop a fast, simple, and cost-effective method suitable for the quantitative analysis of oyster nutrition, especially for studies that involve large sample sizes.
With the rapid development of spectroscopy and computer technologies, near-infrared spectroscopy (NIRS) has become a highly competitive spectral quantitative analysis method. It is based on the principle that samples with similar organic compositions have similar infrared spectra; thus, the compositions of the measured samples can be quantitatively or qualitatively inferred according to a calibration model established from a wide range of sampling data including chemical composition and content data and the corresponding near-infrared spectra (Eric and Standish, 2016; Eric et al., 2017). NIRS has been widely used in agricultural fields, as reviewed by García-Sánchez et al. (2017) and Cortés et al. (2019). In mollusk research, NIRS has been used in several species for the analysis of chemical composition (Malcolm et al., 2011; Wang et al., 2015). The purpose of the present study is to further optimize the NIRS model for the fast and proximate quantification of Pacific oyster nutrient composition, especially for glycogen, taurine, flavor amino acids, and fatty acids, based on data from a wide range of samples. This will enhance our understanding of the nutrient quality traits of C. gigas and further contribute to ongoing selective breeding programs aimed at improving the nutrient quality of oysters.
2 MATERIAL AND METHOD 2.1 Sample collection and preparationWe collected wild C. gigas individuals from 19 sites along the coast of China (Supplementary Figure) and maintained them temporarily in a seedling farm in Jiaonan, Qingdao, China. Female oysters were selected from each of the above populations and crossed with a local male C. gigas through artificial insemination. A total of 427 half-sib families were produced, and the offspring were cultured for approximately 1 year in the Jiaonan sea area of Qingdao. Individuals from 263 families were used as materials for nutrient composition detection and NIRS modeling. Briefly, the oysters were opened and the whole soft body was frozen in liquid nitrogen. The samples were then dried in a freeze-dryer (SCIENTZ-48, China) for approximately 48 h and crushed into fine powder using a high-throughput tissue grinder (SCIENTZ-10N, China). The powdered samples of 30 oysters from each family were mixed in equal amounts, divided into two parts, one for nutrient composition detection using traditional methods and the other for NIRS scanning, and stored at -80 ℃.
2.2 Nutrient composition determination using traditional methods 2.2.1 Glycogen contentUsing the principle of anthrone colorimetry, a liver muscle glycogen assay kit (A043, Nanjing Jiancheng Bioengineering Institute, China) was used to determine the glycogen content. A 0.01-mg/mL glucose standard application solution and a chromogenic agent were prepared. Samples were hydrolyzed with lye and diluted to form a glycogen detection solution. The test solution was configured according to the manufacturer's instructions to test the absorbance. Glycogen content (mg/g)=(test tube OD/standard tube OD)℅standard tube glycogen content℅150℅10/1.11, where OD is the optical density, 150 is the dilution ratio before sample determination, 10 is the dilution ratio of the sample in the detection process, and 1.11 is the coefficient by which the glucose content is converted to the corresponding glycogen content.
2.2.2 Determination of amino acids and fatty acidsIn total, 18 amino acids were identified. Approximately 20 mg of dry powder was weighed and added to an ampere bottle, with 10-mL hydrochloric acid. It was then filled with nitrogen and sealed. It was hydrolyzed for 24 h in oven at 110 ℃ and then decompressed and dried. Next, 200 μL of the prepared sample was added to 100 μL of triethylamine solution and 100-μL benzene isothiocyanate and mixed vigorously. This mixture was then incubated at room temperature for 1 h. Then, 400 μL of n-hexane was added to the mixture and shaken for 10 min. The bottom layer of the solution was aspirated, filtered with 0.45-μm membrane, and examined by amino acid analyzer (LC-3000, Aupos, Germany).
Total lipids were extracted using ultrasonic extraction and saponification (Quehenberger, 2011). The freeze-dried samples were added with internal standard solution and butylhydroxytoluene with 0.01% methanol solution was used as antioxidants. The total fat was extracted by methylene chloride: methanol solution and blow-dried with high-purity nitrogen. Next, 1 mL of KOH-methanol solution was added and it was saponified for 2 h in a water bath maintained at 80 ℃ with nitrogen. The solution was then cooled and 1 mL of 14% BF3 methanol solution was added to the sample and incubated in water bath at 80 ℃ for 1 h for methyesterification. Finally, the fatty acid methyl esters were extracted with n-hexane. The composition and content of the fatty acids in the obtained organic phase were analyzed by gas chromatograph (Agilent 7890A, USA). The conditions used for chromatographic separation were as follows: Capillary column db-FFAP (30 m℅ 0.32 mm℅0.25 μm); Inlet temperature: 220 ℃; Detector temperature: 280 ℃.
The detection was performed at the Analysis and Testing Center of the Institute of Oceanology, Chinese Academy of Sciences (Qingdao, China).
2.3 Establishment and optimization of quantitative analysis modelsAfter the Fourier NIR spectrometer (Thermo Fisher Scientific, USA) was turned on and preheated for 30 min, 3–5 g of dry oyster powder sample was placed directly on the collection point. Result-Integration software (Thermo Fisher Scientific, USA) was used to design the information collection workflow. The collection parameters were set to scan 32 times within the range of 4 000–10 000 cm-1 with a resolution of 8.0 cm-1, and the spectrum was collected by diffuse reflection. A background spectrum was collected to eliminate its influence. Each sample was scanned three times, to obtain an average spectrum.
The quantitative analysis software TQ Analyst (Thermo Fisher Scientific, USA) was used for modeling. NIRS results do not only reflect the chemical composition and content of the samples. They are also affected by physical factors, such as sample density and particle size, and can even contain irrelevant information, such as background noise and stray light. Spectral preprocessing methods such as multiplication scattering correction, first derivative, and Norris smoothing can eliminate interference by irrelevant information and extract as much information as possible from the spectrum related to the chemical components being measured (Ozaki et al., 2001). Partial least squares was selected as the mathematical method to establish the quantitative analysis model (Mehmood et al., 2012). The effective modeling band was selected by referring to the characteristic spectral region of the functional groups related to each component (Manley, 2014; Eric et al., 2021) and combining it with the band range automatically recommended by the software (Prieto et al., 2009; Schwanninger et al., 2011). Outliers were removed according to Mahalanobis distance. An external validation method was used to verify the effect of the model.
The indices representing the modeling effect of the NIRS quantitative model include the correlation coefficient (R), the smallest root mean square error (RMSE), and the ratio of the RMSE to the standard deviation (SD) of the reference data in the prediction (RPD). The calculation equations for each parameter are as follows:

where Ci is the reference value obtained by the standard method, 

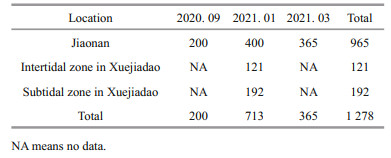
To evaluate the variation in nutrient composition of oysters from diverse locations in different seasons, a total of 1 278 C. gigas samples were collected from Jiaonan (cultured in the subtidal zone) and Xuejiadao (cultured in the intertidal and subtidal zones) in Qingdao, China during September 2020, January 2021, and March 2021 (Table 1). The oysters were treated as mentioned above, and the glycogen, amino acids, fatty acids, and taurine content were assessed using the NIRS models.
|
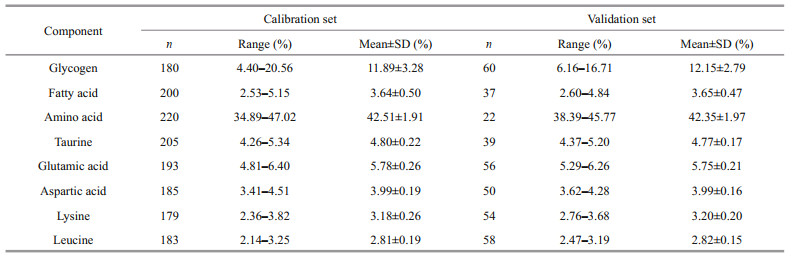
The glycogen and other nutrient compositions of 263 samples were determined and selected for NIRS modeling. The glycogen content varied from 4.40%–20.56%, and the maximum variation was 4.67 (Table 2). The total amino acid content varied from 34.89%–47.02%. For most amino acids, the fold change between individuals was between 1.4 and 3.2. Flavor amino acids (glutamate, aspartic acid, alanine, glycine, tyrosine, and phenylalanine) accounted for 41% of the total amino acids. Among the 18 amino acids, the glutamic acid content was the highest, accounting for 14% of the total amino acid content. The results indicate that the content of glycogen and other components in the samples have wide distribution ranges and strong representativeness, meeting the requirements of NIRS quantitative modeling.
|
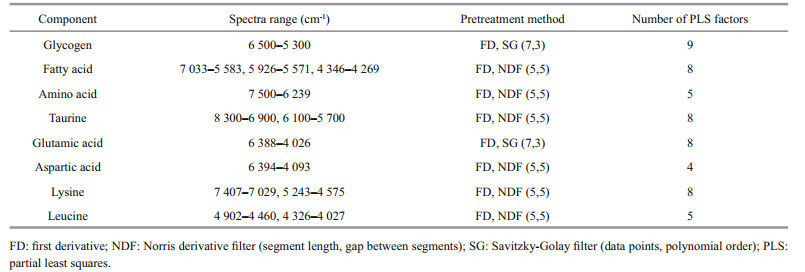
The original spectra were collected using an NIR spectrometer, and the spectral curves were consistent. The spectral curves of the samples differed slightly, indicating that the composition of each sample was different (Fig. 1). After treatment with the first derivative of the original spectrum, the absorption peaks corresponding to various nutrients were more obvious (Fig. 1). According to the automatic recommendations of the TQ Analyst software, combined with relevant literature and repeated manual adjustments, the appropriate spectral range, pretreatment method, and number of partial least squares factors were selected (Table 3), theoretically ensuring the validity of the modeling.

|
| Fig.1 Near-infrared reflectance spectra of freeze-dried Crassostrea gigas oyster samples |
NIRS models of eight components of the C. gigas samples were ultimately established, and the evaluation parameters of the models are shown in Table 4. The Rc values for glycogen, fatty acids, amino acids, and taurine were 0.967 8, 0.931 2, 0.913 2, and 0.892 8, respectively, and the corresponding RMSEc values were 0.826, 0.183, 0.777, and 0.099, respectively. The RPD values for glycogen, fatty acids, amino acids, and taurine were 3.15, 2.16, 3.11, and 1.59, respectively. The external model verification results also showed a strong correlation between the model-predicted values and the actual measured values (Fig. 2). Except for taurine and glutamate, the correlation coefficients in the calibration of the quantitative models were all higher than 0.90 and the verified correlation coefficients were all higher than 0.88.


|
| Fig.2 Correlations between observed and predicted values of glycogen, fatty acids, amino acids, and taurine Table 3 Key parameters for NIRS modeling |
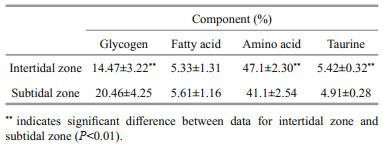
A total of 1 278 samples from Jiaonan and Xuejiadao were scanned by NIRS and the obtained spectra were imported into the established model to obtain the nutrient content of the samples. As shown in Fig. 3, the glycogen and fatty acid levels were higher in January and lower in September, while the amino acid content showed the opposite trend. The variation in taurine content was consistent with that of the amino acids. There were significant differences in glycogen content between January and September (ANOVA, P < 0.01). The average glycogen and fatty acid content in oysters in the subtidal zone was higher than that in the intertidal zone (Table 5). The glycogen, amino acid, and taurine content of C. gigas in the subtidal and intertidal zones was significantly different (t-test, P < 0.01).

|
| Fig.3 Glycogen (a), fatty acid (b), amino acid (c), and taurine (d) content The letters (a, b, c) indicate significant differences in multiple comparisons (P < 0.01). |
|
With the increasing attention paid to mollusk nutrient compositions (Wang et al., 2019; Zhukova, 2019) and research on the molecular bases of nutrient quality (Li et al., 2017; Meng et al., 2019; Shi et al., 2020), a method for the simple and rapid acquisition of the nutrient content of oysters is urgently needed. In this study, we developed a rapid and cost-effective approach that can measure the content of glycogen, taurine, amino acids, and fatty acids in Pacific oysters based on NIRS technology.
R, RMSE, and RPD are widely adopted parameters for evaluating models. A higher R and a lower RMSE generally indicate a model with better prediction performance (Fan et al., 2018; Iqbal et al., 2019). Nevertheless, there seems to be no absolute standard to determine whether a model can be used in further studies merely according to these parameters. In most studies, the R of acceptable models was between 0.80– 0.99, the RMSE was usually < 1, and the RPD was > 1.4 (Jittima et al., 2011; Rosales et al., 2011; Cozzolino and Murray, 2012; Chen et al., 2015). In our study, the glycogen model showed the best performance, which was also observed in some previous studies (Wang et al., 2015; Bartlett et al., 2018). This may be because glycogen is a pure macromolecular organic material with a high content, and its content is highly variable in oysters (Table 2). The taurine and glutamic acid models had lower R and RPD values, and those of other flavor amino acids had even lower R values. This suggests that it may be more difficult to build accurate models for components with low molecular weights and little content variation in oysters. The model for total fatty acids was less accurate but is still acceptable, while the model for unsaturated fatty acids was unacceptable (R < 0.85, Supplementary Table). This indicates that further efforts are needed to explore the possibility of a better model for unsaturated fatty acids.
We applied the models to assess the nutrient compositions of Pacific oyster samples collected in Qingdao, China, in different months and in the subtidal and intertidal zones. The change in nutrient content with time and the correlation between the traits are consistent with previous studies by our research group (Liu et al., 2020). We confirmed that the glycogen content changed seasonally and was higher in January, which is consistent with previous studies that observed a higher glycogen content in winter (Dridi et al., 2007; Liu et al., 2020). The changes in glycogen content were positively correlated with fatty acids and negatively correlated with amino acids, which is also in agreement with Futagawa's findings (Futagawa et al., 2011). A novel finding was that the glycogen content of oysters from the same population showed significant divergence when cultured in the subtidal and intertidal zones. These findings imply that tide level may be an important factor affecting the nutrient content of cultured Pacific oysters. As the environmental changes in the intertidal zone is more severe than that of the subtidal zone, organisms living in the intertidal region undergo increased exposure to air, drastic temperature variations, and reduced food supplies. Under such environmental stress, bivalves are likely to allocate more energy in maintaining homeostasis, thereby leading to the reduction of the glycogen content (Ojeda et al., 2019).
The cost of measuring the above-mentioned nutrient compositions via the NIRS models was greatly reduced, representing only 1/20–1/30 of the cost of traditional detection methods. At least 50 samples can be analyzed per day and the samples can be recycled for other applications, such as nucleic acid extraction and genotyping, if they are quickly returned to a low-temperature environment after scanning. In conclusion, the proposed NIRS models of Pacific oyster nutrient contents can act as a routine approach to phenotyping these slaughter traits and possesses great potential in future genetic and breeding-related studies on Pacific oysters.
5 DATA AVAILABILITY STATEMENTThe datasets generated during and/or analyzed during the current study are available from the corresponding author on reasonable request.
Electronic supplementary material
Supplementary material (Supplementary Figure and Table) is available in the online version of this article at https://doi.org/10.1007/s00343-022-1347-3.
Bartlett J K, Maher W A, Purss M B J. 2018. Near infra-red spectroscopy quantitative modelling of bivalve protein, lipid and glycogen composition using single-species versus multi-species calibration and validation sets. Spectrochimica Acta Part A: Molecular and Biomolecular Spectroscopy, 193: 537-557.
DOI:10.1016/j.saa.2017.12.046 |
Bishop M J, Krassoi F R, McPherson R G, et al. 2010. Change in wild-oyster assemblages of Port Stephens, NSW, Australia, since commencement of non-native Pacific oyster (Crassostrea gigas) aquaculture. Marine and Freshwater Research, 61(6): 714-723.
DOI:10.1071/MF09177 |
Chen J S, Zhu R F, Xu R X, et al. 2015. Evaluation of Leymus chinensis quality using near-infrared reflectance spectroscopy with three different statistical analyses. PeerJ, 3: e1416.
DOI:10.7717/peerj.1416 |
Cortés V, Blasco J, Aleixos N, et al. 2019. Monitoring strategies for quality control of agricultural products using visible and near-infrared spectroscopy: a review. Trends in Food Science & Technology, 85: 138-148.
DOI:10.1016/j.tifs.2019.01.015 |
Cozzolino D, Murray I. 2012. A review on the application of infrared technologies to determine and monitor composition and other quality characteristics in raw fish, fish products, and seafood. Applied Spectroscopy Reviews, 47(3): 207-218.
DOI:10.1080/05704928.2011.639106 |
d'Auriac M B A, Rinde E, Norling P, et al. 2017. Rapid expansion of the invasive oyster Crassostrea gigas at its northern distribution limit in Europe: naturally dispersed or introduced?. PLoS One, 12(5): e0177481.
DOI:10.1371/journal.pone.0177481 |
Dridi S, Romdhane M S, Elcafsi M H. 2007. Seasonal variation in weight and biochemical composition of the Pacific oyster, Crassostrea gigas in relation to the gametogenic cycle and environmental conditions of the Bizert lagoon, Tunisia. Aquaculture, 263(1-4): 238-248.
DOI:10.1016/j.aquaculture.2006.10.028 |
Eric G, Joseph LM, Standish KA. 2017. Glycogen Concentration in freeze-dried tissues of eastern oyster (Crassostrea virginica) using near infrared reflectance spectroscopy to determine the relationship between concentrations of the tissues excised for histological sampling and the remaining tissues. Journal of Shellfish Research, 36(2): 325-333.
DOI:10.2983/035.036.0204 |
Eric G, Ryan B C, Laura W S, et al. 2021. Near infrared reflectance spectroscopy to quantify Perkinsus Marinus infecting Crassostrea Virginica. Aquaculture, 533: 736063.
DOI:10.1016/j.aquaculture.2020.736063 |
Eric G, Standish K A. 2016. Use of Near infrared reflectance spectroscopy (NIRS) for the rapid compositional analysis of di-, tri-, and tetraploid eastern oysters (Crassostrea virginica). Aquaculture, 459: 203-209.
DOI:10.1016/j.aquaculture.2016.03.022 |
Fan Y X, Liao Y T, Cheng F. 2018. Predicting of intramuscular fat content in pork using near infrared spectroscopy and multivariate analysis. International Journal of Food Properties, 21(1): 1180-1189.
DOI:10.1080/10942912.2018.1460606 |
Futagawa K, Yoshie-Stark Y, Ogushi M. 2011. Monthly variation of biochemical composition of Pacific oysters Crassostrea gigas from two main cultivation areas in Japan. Fisheries Science, 77(4): 687-696.
DOI:10.1007/s12562-011-0364-5 |
García-Sánchez F, Galvez-Sola L, Martínez-Nicolás J J et al. 2017. Using near-infrared spectroscopy in agricultural systems. In: Kyprianidis K, Skvaril J eds. Developments in Near-Infrared Spectroscopy. InTech, Rijeka. p. 97-127.
|
Gillies C L, McLeod I M, Alleway H K, et al. 2018. Australian shellfish ecosystems: past distribution, current status and future direction. PLoS One, 13(2): e0190914.
DOI:10.1371/journal.pone.0190914 |
Iqbal Z, Herodian S, Widodo S. 2019. Development of partial least square (PLS) prediction model to measure the ripeness of oil palm fresh fruit bunch (FFB) by using NIR spectroscopy. IOP Conference Series: Earth and Environmental Science, 347: 012079.
DOI:10.1088/1755-1315/347/1/012079 |
Jittima W, Gerard D, Paul A, et al. 2011. A review of near infrared spectroscopy in muscle food analysis: 2005-2010. Journal of Near Infrared Spectroscopy, 19(2): 61-104.
DOI:10.1255/jnirs.924 |
Krisman C R. 1962. A method for the colorimetric estimation of glycogen with lodine. Analytical Biochemistry, 4(1): 17-23.
DOI:10.1016/0003-2697(62)90014-3 |
Li B S, Song K, Meng J, et al. 2017. Integrated application of transcriptomics and metabolomics provides insights into glycogen content regulation in the Pacific oyster Crassostrea gigas. BMC Genomics, 18(1): 713.
DOI:10.1186/s12864-017-4069-8 |
Li C Y, Wang J P, Song K, et al. 2018. Construction of a high-density genetic map and fine QTL mapping for growth and nutritional traits of Crassostrea gigas. BMC Genomics, 19(1): 626.
DOI:10.1186/s12864-018-4996-z |
Liu S, Li L, Meng J, et al. 2019a. Association and functional analyses revealed that PPP1R3B plays an important role in the regulation of glycogen content in the Pacific oyster Crassostrea gigas. Frontiers in Genetics, 10: 106.
DOI:10.3389/fgene.2019.00106 |
Liu S, Li L, Wang W, et al. 2020. Characterization, fluctuation and tissue differences in nutrient content in the Pacific oyster (Crassostrea gigas) in Qingdao, northern China. Aquaculture Research, 51(4): 1353-1364.
DOI:10.1111/are.14463 |
Liu S, Li L, Zhang S D, et al. 2019b. Heritability estimates for nutritional quality-related traits of the Pacific oyster, Crassostrea gigas. Journal of the World Aquaculture Society, 50(4): 738-748.
DOI:10.1111/jwas.12588 |
Malcolm R B. 2011. Rapid compositional analysis of oysters using visible-near infrared reflectance spectroscopy. Aquaculture, 317(1-4): 233-239.
DOI:10.1016/j.aquaculture.2011.04.017 |
Manley M. 2014. Near-infrared spectroscopy and hyperspectral imaging: non-destructive analysis of biological materials. Chemical Society Reviews, 43(24): 8200-8214.
DOI:10.1039/C4CS00062E |
Mehmood T, Liland K H, Snipen L, et al. 2012. A review of variable selection methods in partial least squares regression. Chemometrics and Intelligent Laboratory Systems, 118: 62-69.
DOI:10.1016/j.chemolab.2012.07.010 |
Meng J, Song K, Li C Y, et al. 2019. Genome-wide association analysis of nutrient traits in the oyster Crassostrea gigas: genetic effect and interaction network. BMC Genomics, 20(1): 625.
DOI:10.1186/s12864-019-5971-z |
Murata Y, Touhata K, Miwa R. 2020. Correlation of extractive components and body index with taste in oyster Crassostrea gigas brands. Fisheries Science, 86(3): 561-572.
DOI:10.1007/s12562-020-01417-1 |
Nahorski S R, Rogers K J. 1972. An enzymic fluorometric micro method for determination of glycogen. Analytical Biochemistry, 49(2): 492-497.
DOI:10.1016/0003-2697(72)90453-8 |
Ojeda M, Boy C C, Giménez J. 2019. Reproductive aspects and energy allocation compromise to aerial exposure in the intertidal mussel Brachidontes rodriguezii. A case study at two tidal levels. Journal of Sea Research, 155: 101824.
DOI:10.1016/j.seares.2019.101824 |
Ozaki Y, Šašić S, Jiang J H. 2001. How can we unravel complicated near infrared spectra?—Recent progress in spectral analysis methods for resolution enhancement and band assignments in the near infrared region. Journal of Near Infrared Spectroscopy, 9(2): 63-95.
DOI:10.1255/jnirs.295 |
Prieto N, Roehe R, Lavín P, et al. 2009. Application of near infrared reflectance spectroscopy to predict meat and meat products quality: a review. Meat Science, 83(2): 175-186.
DOI:10.1016/j.meatsci.2009.04.016 |
Qin Y P, Zhang Y H, Ma H T, et al. 2018. Comparison of the biochemical composition and nutritional quality between diploid and triploid Hong Kong oysters, Crassostrea hongkongensis. Frontiers in Physiology, 9: 1674.
DOI:10.3389/fphys.2018.01674 |
Quehenberger O, Armando A M, Dennis E A. 2011. High sensitivity quantitative lipidomics analysis of fatty acids in biological samples by gas chromatography-mass spectrometry. Biochimica et Biophysica Acta (BBA)-Molecular and Cell Biology of Lipids, 1811(11): 648-656.
DOI:10.1016/j.bbalip.2011.07.006 |
René E L. 2005. Oyster culture in north America history, present and future. In: The 1st International Oyster Symposium Proceedings. Tokyo. 9p.
|
Rosales A, Galicia L, Oviedo E, et al. 2011. Near-infrared reflectance spectroscopy (NIRS) for protein, tryptophan, and lysine evaluation in quality protein maize (QPM) breeding programs. Journal of Agricultural and Food Chemistry, 59(20): 10781-10786.
DOI:10.1021/jf201468x |
Schwanninger M, Rodrigues J C, Fackler K. 2011. A review of band assignments in near infrared spectra of wood and wood components. Journal of Near Infrared Spectroscopy, 19(5): 287-308.
DOI:10.1255/jnirs.955 |
Shi R H, Li C Y, Qi H G, et al. 2020. Construction of a high-resolution genetic map of Crassostrea gigas: QTL mapping and GWAS applications revealed candidate genes controlling nutritional traits. Aquaculture, 527: 735427.
DOI:10.1016/j.aquaculture.2020.735427 |
Smon A, Cuk V, Brecelj J, et al. 2019. Comparison of liquid chromatography with tandem mass spectrometry and ion-exchange chromatography by post-column ninhydrin derivatization for amino acid monitoring. Clinica Chimica Acta, 495: 446-450.
DOI:10.1016/j.cca.2019.05.007 |
Tan K S, Zhang H K, Liu H X, et al. 2019. Enhancing lipid nutritional quality of oysters by hybridization between Crassostrea gigas and C. angulata. Aquaculture Research, 50(12): 3776-3782.
DOI:10.1111/are.14340 |
Teng Y, Wang C L. 2005. The study on nutrition and sugar-lowered action of Crassostrea talienwhanensis. Marine Fisheries Research, 2005(06): 39-44.
DOI:10.1111/j.1744-7909.2005.00136.x |
van Houcke J, Medina I, Linssen J, et al. 2016. Biochemical and volatile organic compound profile of European flat oyster (Ostrea edulis) and Pacific cupped oyster (Crassostrea gigas) cultivated in the Eastern Scheldt and Lake Grevelingen, the Netherlands. Food Control, 68: 200-207.
DOI:10.1016/j.foodcont.2016.03.044 |
Walles B, Smaal A C, Herman P M J, et al. 2016. Niche dimension differs among life-history stages of Pacific oysters in intertidal environments. Marine Ecology Progress Series, 562: 113-122.
DOI:10.3354/meps11961 |
Wang L C, Di L Q, Li J S, et al. 2019. Elaboration in type, primary structure, and bioactivity of polysaccharides derived from mollusks. Critical Reviews in Food Science and Nutrition, 59(7): 1091-1114.
DOI:10.1080/10408398.2017.1392289 |
Wang W J, Yang J M, Li Q, et al. 2015. Development of calibration models for rapid determination of chemical composition of Pacific oyster (Crassostrea gigas) by near infrared reflectance spectroscopy. Journal of Shellfish Research, 34(2): 303-309.
DOI:10.2983/035.034.0212 |
Zhang S P, Qiu W Q, Lu Q, et al. 2017. Determination of glutathione and free amino acids in muscles of four shellfish species by automatic amino acid analyzer. Food Science, 38(4): 170-176.
(in Chinese with English abstract) DOI:10.7506/spkx1002-6630-201704027 |
Zheng H N, Zhang J J, Zhou C X, et al. 2014. Extraction of oyster protein by alkali solution acid precipitation and its amino acid and protein composition analysis. Journal of Chinese Institute of Food Science and Technology, 14(7): 230-235.
DOI:10.16429/j.1009-7848.2014.07.035 |
Zhukova N V. 2019. Fatty acids of marine mollusks: Impact of diet, bacterial symbiosis and biosynthetic potential. Biomolecules, 9(12): 857.
DOI:10.3390/biom9120857 |