 2023, Vol. 41
Institute of Oceanology, Chinese Academy of Sciences
Article Information
- ABATE Rediat, HETHARUA Buce Hanoch, PATIL Vishal, LIN Daner, KIFLE Demeke, LIANG Junrong, CHEN Changping, SUN Lin, KAO Shuh-Ji, BI Yonghong, HUANG Bangqin, GAO Yahui
- Responses of phytoplankton and its satellite bacteria to exogenous ethanol
- Journal of Oceanology and Limnology, 41(1): 203-214
- http://dx.doi.org/10.1007/s00343-021-1224-5
Article History
- Received Jul. 13, 2021
- accepted in principle Nov. 4, 2021
- accepted for publication Dec. 29, 2021


2 School of Life Sciences, Xiamen University, Xiamen 361102, China;
3 Key Laboratory of the Ministry of Education for Coastal and Wetland Ecosystem, College of Environment & Ecology, Xiamen University, Xiamen 361102, China;
4 State Key Laboratory of Marine Environmental Sciences, Xiamen University, Xiamen 361101, China;
5 Department of Zoological Sciences, Addis Ababa University, Addis Ababa, PO Box 1176, Ethiopia
Phytoplankton contributes approximately 50% of global net primary production (Field et al., 1998), and bacteria feed and processes on average 50% of photosynthetically fixed carbon in a sunlit aquatic system (Azam and Malfatti, 2007) and it facilitates the availability of nutrients for phytoplankton through remineralization (Mayali, 2018). In addition, phytoplankton may provide a microhabitat for aquatic bacteria (Cole, 1982), which can lead to complex and diverse ways of interaction between phytoplankton and bacteria. This interaction allowed uni-algal phytoplankton cultures to harbor a substantial number of commensal bacteria, which has been termed as "satellite" bacteria (Borisova, 1986 cited by Sch fer et al., 2002). Some satellite bacteria populations in the nonaxenic uni-algal phytoplankton culture could be selected as they passed through several successive generations of culturing and could establish commensal interactions with the co-existing phytoplankton (Jasti et al., 2005). The commensal interaction between satellite bacteria and phytoplankton is a function of the physiology and composition of both communities and the physical and chemical conditions of the surrounding environment. Moreover, studying phytoplankton and its satellite bacteria needs more attention as recent studies showed that the cultivation of some symbiotic bacteria and microalgae gives better results in environmental biotechnology applications (Yao et al., 2019). However, due to the diffculties in finding mutually beneficial and compatible symbiotic bacteria and microalgae as a result of the complex interaction and diversity of microbes in natural systems, studying phytoplankton and its satellite bacteria is becoming one of the preferred approaches. However, the scientific research regarding the effect of environmental factors including ethanol on phytoplankton and its satellite bacteria is scarce.
Phytoplankton and bacteria rapidly respond to ethanol (Menzyanova and Bozhkov, 2003; Chatterjee et al., 2006). Generally, ethanol has diverse effects on microorganisms; it can serve as a metabolic organic carbon source or growth inhibitory. Traditionally, ethanol has been considered inhibitory and toxic to most bacteria. Several studies showed that most bacteria exhibit growth-inhibition over the range of 0 to 10% ethanol in a dose-dependent manner, while a few (ethanol-loving bacteria) grow at concentrations above 10% (Ingram and Buttke, 1985; Kato et al., 1991). However, studies on Escherichia coli (Ferraro and Finkel, 2019) and Staphylococcus aureus (Chatterjee et al., 2006) indicated that ethanol might have some other function than a simple source of organic carbon or inhibitor. However, the exact effect of ethanol on the growth of satellite bacteria was unknown, and whether ethanol serves as organic carbon or a growth stimulant to these bacteria remains unexplored.
Studies on the effect of ethanol on microbes have been carried out for several decades (Stratton, 1987; Ghosh et al., 1995; Clark and Cronan, 2005; Chen et al., 2014; Tashiro et al., 2014). However, in recent years, a great deal of scientific attention is required to elucidate the effect of ethanol on microorganisms as the release of ethanol into the environment has been alarmingly increasing and become a concern of environmental pollution (Willey et al., 2019; Milani et al., 2020; Sharma et al., 2021). This issue become serious as the winery industry has ethanol as the major component of organic waste (Milani et al., 2020) and the emission of ethanol to the environment during industrial production of ethanol and consumption as a biofuel (Willey et al., 2019) is increasing rapidly. For example, global industrial ethanol production has been increasing from 10 billion liters in 1980 to 30 billion liters in 2000 and 86 billion liters in 2009 (Kirstine and Galbally, 2012). Recent studies show that the winery wastewater produced in Italy (Milani et al., 2020) and South Africa (Rodriguez-Caballero et al., 2012) reached up to 10 million cubic meters per annum, and ethanol concentration in air and rainwater has increased fourfold between 2011 and 2017 in North Carolina (USA) (Willey et al., 2019). The accumulated ethanol in the atmosphere is dissolved in the rainwater and joins surface water, which partly flows into the aquatic environment and can affect the microorganisms. Furthermore, ethanol produced in the aquatic system by natural processes also affects the growth and physiology of microorganisms (Feris et al., 2008; Kirstine and Galbally, 2012). This implies that studying the effect of ethanol on the microbes generally, and uni-algal phytoplankton culture and its satellite bacteria in particular has a great scientific interest.
Thus, this research was intended to deepen our knowledge about the effects of exogenous ethanol on the growth of phytoplankton and its satellite bacteria. The objectives of the study were: a) to investigate the effect of various concentrations of exogenous ethanol on the growth of a pure culture of phytoplankton and satellite bacteria; b) to investigate the effect of exogenous ethanol on species composition of satellite bacteria in uni-algal cultures; and c) to investigate whether exogenous ethanol serves as a metabolic carbon source or growth stimulatory molecule for the satellite bacteria.
2 MATERIAL AND METHOD 2.1 The response of phytoplankton to ethanolAll single strains of phytoplankton used in this research were obtained from the microalgae strains collection center of the Diatom Laboratory, School of Life Sciences, Xiamen University (China). The growth and physiological responses of monoculture-phytoplankton to ethanol were tested on two phytoplankton strains (Skeletonema costatum (MMDL50645) and Phaeodactylum tricornutum (MMDL5071)). The S. costatum and P. tricornutum were cultured in a sterilized f/2 medium (Guillard and Ryther, 1962). Then, the various concentration of ethanol (0, 0.01%, 0.1%, 1%, and 10% v/v) was added into triplicates of 100-mL culture flasks on the initial day, which contained the microalgae S. costatum and P. tricornutum. The flasks were placed in a microalgalgrowth chamber (Ruihua, HP250G) in which the temperature, light intensity, and light-dark cycle were set at 20 ℃ (±0.1 ℃), 100 μmol photons/(m2·s) and 12 h 12 h, respectively. The flasks were manually shaken twice every day. The culturing flasks were allowed to stand for 7 d and their cultures were sampled daily. The growth of phytoplankton biomass was measured by counting the cell numbers. The cell number was estimated by taking 1-mL samples, which were fixed with 1% acidic Lugol's solution, and enumerating the cells using Sedgewick-Rafter counting chamber (Guillard and Sieracki, 2005) at 100× magnification under a light microscope (BH-2, Olympus). The physiological response of phytoplankton to ethanol was determined by the maximum quantum yield effciency of photosystem II (Fv/Fm), which was measured after the samples were kept in the dark for 15 min. The Fv/Fm was determined by measuring the fluorescenceabsorption by pulse-amplitude modulation (PAM) fluorometry (Phyto-PAM, Heinz Walz GmbH, Effeltrich, Germany) (Suggett et al., 2004).
2.2 The response of satellite bacteria to ethanol 2.2.1 Isolation of satellite bacterial strainsSingle-cell strains of bacteria were isolated from nonaxenic monoculture of two classes of phytoplankton, S. costatum and Dunaliella salina (MMDL60231). We have chosen these strains to see if there are any differences in cultivable satellite bacteria composition between various phytoplankton classes. To isolate single colonies of satellite bacteria, diluted (×10-6) cultures of S. costatum and D. salina were spread onto agar plates. The agar plate media were prepared using sterilized f/2 liquid media modified by omitting silica (MFM) and enriched with 3-g/L peptone and 5-g/L yeast extract with 15-g/L agar. Then, the plates were incubated in the same conditions with phytoplankton cultures, mentioned in Section 2.1. After 3 d of incubation on the petri dish plate, single colonies of bacteria were picked and streaked onto new petri dish plates. Next, the isolated and purified bacteria strains were identified by DNA sequencing. The DNA samples of the isolates were extracted using Steady Pure DNA extraction kit (Accurate Biology, Changsha, Hunan, China), and the full length of the 16S rRNA gene was amplified and sequenced according to the method described by Hetharua et al. (2018). The sequences were deposited at the National Center for Biotechnology Information (NCBI) (Table 1).

The growth response of monoculture satellite bacteria to ethanol was investigated on commonly appeared four pure strains that were isolated from selected two phytoplankton class (diatom and green algae) cultures and one enterobacterium strain (E. coli DH5α (TAKARA)) investigated for comparison purposes. The bacteria isolated from the two microalgae cultures were cultured in MFM enriched with 1 g/L of tryptone and 0.5 g/L of yeast extract. The E. coli was cultured in normal Lysogeny broth (LB) media. The cultures were incubated in the dark at 30 ℃ and 130 r/min using a shaker (AHYQ-SD-85A). This experiment was performed by adding 0 (control), 0.01%, and 1% (v/v) ethanol into 100-mL triplicate flasks on the initial day. Then, the growth of the bacteria was followed by measuring optical density at 600 nm (OD600) after 4, 8, 12, 16, and 24 h of the culturing period. The OD600 was measured using UV/Vis spectrophotometer (Mapada, V-1100D).
2.2.3 The response of satellite bacterial species composition to ethanolTo investigate the response of satellite bacterial assemblages to ethanol, the species composition of the bacterial community in nonaxenic phytoplankton cultures was analyzed after the addition of ethanol and compared with the control. To investigate this, three nonaxenic cultures of phytoplankton (S. costatum, P. tricornutum, and Dunaliella bardawil (MMDL60217)) were used and incubated in the same condition mentioned in Section 2.1. Then, the cultures were exposed to 0 (control) and 0.1% (v/v) ethanol concentrations on the initial day, and the DNA content was extracted after 5 d of culturing. The DNA was extracted using Steady Pure (Accurate Biology, Changsha, Hunan, China). The V3–V4 region of the bacterial 16S rRNA gene amplicon was amplified and purified as described in a previous study (Lin et al., 2019), and then submitted to MJB (Shanghai Majorbio Bio-Pharm Tech, China) for sequencing (pair-end) on the Illumina MiSeq PE300 platform. The raw reads obtained were deposited in the NCBI Sequence Read Archive database (the accession numbers: SRP259698).
Raw FASTQ files were quality-filtered using Trimmomatic and merged with FLASH according to methods described by Lin et al. (2019). Then, the open reference operational taxonomic units (OTU) picking script (pick_open_reference_otus.py) (Rideout et al., 2014) was employed using QIIME 1.9.0, to first cluster the sequences with the Silva 16S rRNA database (SSU123, http://www.arb-silva.de); OTUs that did not cluster with known taxa (at 97% identity) in the database were then clustered de novo. The taxonomy of each representative sequence was analyzed using an RDP Classifier (http://rdp.cme.msu.edu/) against the Silva 16S rRNA database (SSU128, http://www.arb-silva.de) using a confidence threshold of 80%. The α-rarefaction and β-diversity analyses were conducted based on the OTU table with a minimal sequence number of the samples. The statistical analysis was carried out using STAMP (version 2.1.3) (Parks et al., 2014).
2.3 Effects of ethanol on satellite bacteria metabolism and alcohol dehydrogenase (adhA) geneTo test whether ethanol serves as a metabolic carbon source or growth stimulatory molecule, the response of a bacterium to ethanol as a sole carbon source was investigated in a modified (without NaHCO3) artificial seawater media (Kester et al., 1967). The modified artificial seawater media was prepared by adding the following chemicals (in gram) into 1 L of distilled water; NaNO3 (0.075), NaH2PO4∙H2O (0.005), NaCl (23.476), MgCl2 (4.981), Na2SO4 (3.917), CaCl2 (1.102), KCl (0.664), KBr (0.096), H3BO3 (0.026), SrCl2 (0.024), and NaF (0.003). In the artificial seawater media there was no addition of organic nutrients for the control group, while either ethanol or glucose was provided as the sole carbon source for the treatment groups. Then, the growth performance tested in the prepared media devoid of any carbon source (control), containing 0.5% (v/v) ethanol or 0.5% (v/v) glucose, these carbon sources were provided on the initial day. The experiment was performed in 100-mL triplicate flasks and incubated in the same condition mentioned in Section 2.2.2. Finally, the growth of the bacteria was determined by measuring OD600 values at the initial, on 3rd and 6th days of the culturing periods. This experiment was tested on a bacterium isolated from S. costatum culture.
To investigate the response of the alcohol dehydrogenase (adhA) gene to ethanol exposure independent experiment was performed on a bacterium isolated from S. costatum culture. Initially, as inoculum, a single colony of the bacterium was grown overnight in LB media with conditions mentioned in Section 2.2.2. Then, 100-μL aliquot (with OD 600 value of 1) inoculum was used to inoculate each flask. Next, the treatment group received 0.5% (v/v) ethanol, while the control group did not receive any ethanol. The experiment was performed in sterilized MFM enriched with 1 g/L of tryptone and 0.5 g/L of yeast extract in triplicate 100-mL flasks incubated in the same condition mentioned in Section 2.2.2. The growth of the bacterium was determined by measuring OD600 values after 0, 8, 24 and 40 h. To determine adhA activity, the total RNA was extracted using the Eastep®Super RNA extraction kit according to the manufacturer's instruction (Shanghai Promega Biological Products LTD). Residual DNA content in the samples was removed using DNase and complementary DNA (cDNA) was synthesized using PrimeScript cDNA Synthesis Kit (TaKaRa). Then, adhA was amplified using a pair of primers adh-F 5′-TSGATGCSAAGACCGG-3′ and adh-R 5′-CCCCAGCCCACTTCAAC-3′ (Trcek, 2005) from genomic DNA of a pure bacterium to conform the bacterium harbor adhA gene. Next, amplification of adhA from cDNA samples was performed to test the expression of the adhA gene qualitatively. Furthermore, 16S rRNA gene was amplified using a pair of primers ArBa515F and Arch806R (He et al., 2018) in the same PCR reaction with adhA gene at a melting temperature of 55 ℃ to validate the success of RNA extraction and reverse transcription of samples. Then, the PCR products were mounted in 1% agarose for agarose gel electrophoresis. The expected product for adhA was ~500 bp and for 16S rRNA it was ~290 bp. The following thermal standard profile was used to amplify the adhA: pre-denaturation at 95 ℃ for 5 min, denaturation at 95 ℃ for 15 s, annealing at 55 ℃, and prolongation at 72 ℃ for 20 s, 35 cycles.
2.4 Calculations and statistical analysisThe diversity of satellite bacteria in the nonaxenic monoculture phytoplankton was estimated by Shannon diversity index calculated using Majorbio Life science and technology service (http://www.majorbio.com). One-way ANOVA was used to test the significant effect (P < 0.05) of ethanol on the growth of bacteria.
3 RESULT 3.1 The response of phytoplankton cell density and photosynthetic effciency to ethanolThe cell density of phytoplankton in the monoculture system was increased at 0.01% of ethanol and decreased at the 0.1%–1% ethanol treatment. Cells were dead at 10% of ethanol (Fig. 1a & c). The cell density decline with the increase of ethanol concentration (Supplementary Fig.S1). Fv/Fm values of the phytoplankton in 0.01% treatment were also greater than those of the control (Fig. 1b & d). The Fv/Fm values declined with the increase of the ethanolconcentration above 0.1%. The Fv/Fm value becomes zero throughout the culturing time at 10% ethanol.

|
| Fig.1 The cell density (a & c) and photosynthetic effciency (Fv/Fm) values (b & d) of Skeletonema costatum (a & b) and Phaeodactylum tricornutum (c & d) under 0 (control), 0.01%, 0.1%, 1%, and 10% ethanol concentration Sampling was conducted hourly (h). The data points represent the mean of triplicate analysis. |
In total, 12 strains of bacteria were isolated, of which 9 strains were from S.costatum culture and 3 strains were from D. salina culture. We were able to isolate strains belonging to the genera Marinobacter, Mameliella (Ponticoccus), and Alteromonas from S. costatum culture, and Chromohallomonas and Marinobacter from D. salina culture (Table 1).
3.2.2 The growth response of satellite bacteria to ethanolThe growth response of satellite bacteria to ethanol was investigated on pure strains of Alteromonas marina A12, Marinobacter adhaerens A3, Chromohalobacter salexigens B7 and Mameliella alba SC-07-1. The results indicated that the growth of pure isolates of satellite bacteria and E. coli was significantly (df=2; P < 0.05) stimulated at 0.01%– 1% ethanol (Fig. 2a–e). Moreover, in addition to the promotion of growth, ethanol promoted the formation of long filamentous cells of bacteria (Supplementary Fig.S2). The satellite bacteria showed the highest growth at 1% ethanol, while E. coli showed the highest growth at 0.1% ethanol (Fig. 2f).

|
| Fig.2 The growth response (OD600) of Alteromonas marina A12 (a), Marinobacter adhaerens A3 (b), Chromohalobacter salexigens B7 (c), Mameliella alba SC-07-1 (d), E. coli DH5α (e), and their maximum growth response (f) whencultured at 0 (control), 0.01%, and 1% ethanol Sampling periods were in hour (h). The data points represent the mean of triplicate analysis. |
During the analysis of satellite bacteria, species composition response to ethanol, quality trimming and de-multiplexing showed 796 783 valid sequences (the accession number: SRP259698) from 18 samples and clustered into 45 OTUs at equal sequencing depth. Based on the comparison with a confidence threshold of 80% against the SILVA 16S rRNA database, these OTUs were classified into 34 families and 41 genera of the bacterial community. The Bray-Curtis distance showed that the bacteria community of each phytoplankton strain was distinct (Fig. 3a). The microbial community profile at the genus level pointed out that the S. costatum culture harbor about 32 genera and was dominated by Marivita (~80%), P. tricornutum harbor about 34 genera and wasdominated by Dinoroseobacter (~47%), and that of D. bardawil harbor 48 genera and was dominated by Halomonas (~87%) (Fig. 3b & Supplementary Fig.S3). The bacterial community composition in ethanol-treated cultures and control groups remained similar (Fig. 3b), showing no significant difference (P > 0.05) (Supplementary Fig.S4) in bacterial community composition between control and ethanol-treated cultures. However, compared to control, the Shanon diversity index slightly declined from 0.97±0.04, 0.86±0.12, and 0.50±0.71 to 0.90±0.12, 0.59±0.30, and 0.46±0.01 in the ethanol-treated culture of P. tricornutum, S. costatum, and D. bardawil, respectively.

|
| Fig.3 Community structure based on Illumina sequencing of bacterial 16S rRNA a. the Bray-Curtis dissimilarity distance of all samples at the OTU level observed in a principal component analysis (PCA); b. microbial community heat map at the genus level. Dun-ck, Pt-ck, and Sk-ck/Dun-eth, Pt-eth, and Sk-eth represent the control/ethanol-treated cultures of Dunaliella bardawil, Phaeodactylum tricornutum, and Skeletonema costatum, respectively. |
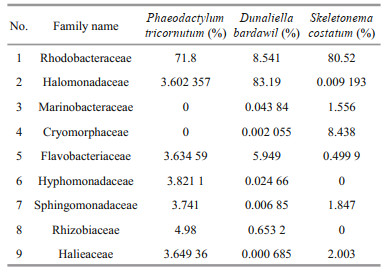
The Rhodobacteraceae was the dominant family in the marine diatom groups, P.tricornutum and S. costatum contributing more than 70% of the bacterial community. On the other hand, the saline green alga D. bardawil was dominated by the family Halomonadaceae (> 80%) preceded by Rhodobacteraceae (8.5%) (Table 2).
|
The mechanism whether ethanol serves as a metabolic carbon source or stimulatory molecule was tested on a bacterium Mameliella alba SC-07-1 that was provided with none (control), glucose, or ethanol as the only carbon sources. The result indicated that, compared to its initial day, the final-day growth of M. alba increased by more than a hundredfold (df=2; P < 0.001) when the treatment was provided with 0.5% glucose. However, compared to its initial day, the final-day growth of M. alba was negligible in the control and 0.5% ethanol treatment groups (Fig. 4). Moreover, the growth variation between the control and 0.5% ethanol-treated groups was not significant (df=2; P > 0.45).

|
|
Fig.4
The growth response (OD600) of Mameliella alba SC-07-1 grown in an artifi cial media provided with 0 (control), 0.5% ethanol, and 0.5% glucose as the only carbon sources
The data points represent the mean of triplicate analysis. *: P < 0.001, significant difference. |
Furthermore, to investigate whether ethanol is serving as a metabolic carbon source, we have performed another experiment where M. alba SC-07-1 was cultured in LB media (provided with all necessary organic nutrients) and 0.5% ethanol, then RNA was extracted. The result indicated that, even though we have already confirmed that the strain SC-07-1 possessed the adhA gene (Fig. 5a), the adhA gene was not expressed at the transcriptional level (Fig. 5b) while the growth of M. alba SC-07-1 significantly (df=2;P < 0.001) increased in ethanol-treated cultures (Supplementary Fig.S5).

|
| Fig.5 Gel electrophoresis analysis of 16S rRNA and adhA gene amplified from genomic DNA of Mameliella alba SC-07-1 (a) and amplified from cDNA (b) of ethanol experiment CK: the control; ET: treatment group (0.5% ethanol); T0–T3: the experimental time line of 0, 8, 24, and 40 h. |
Ethanol significantly affected the growth and physiology of phytoplankton. The result revealed ethanol either inhibits or promotes the growth and physiology of S.costatum and P. tricornutum at high (0.1%–1%), or low concentration (0.01%), respectively. The promotion of growth of phytoplankton monocultures under low ethanol treatment resulted from the fact that phytoplankton can use ethanol as an energy and carbon source (Bezerra et al., 2014). Ethanol can be oxidized to acetaldehyde by alcohol dehydrogenase and acetate by aldehyde dehydrogenase in mitochondria and/or cytosol (Ono et al., 1995; Fujita et al., 2008). Several studies reported that the growth (Bezerra et al., 2014; Matsudo et al., 2017) and cell content (Menzyanova et al., 2002; Wu et al., 2013) of phytoplankton monocultures were promoted by the supply of ethanol in the mixotrophic culture system. In line with our result, the increase in light utilization effciency of the green alga Chlorella sp. in ethanol provision has been reported (Huo et al., 2018). Navakoudis et al. (2007) showed that 0.5% (v/v) methanol slightly enhanced the photosynthetic effciency of the microalga Scenedesmus obliquus, while reducing the heat dissipation during photochemical quenching. Moreover, Navakoudis et al. (2007) suggested that methanol could supply carbon dioxide to the photochemical systems as the catabolic pathway from methanol to carbon dioxide contains an intermediate compound, formate, which protects the photosynthetic apparatus from photoinhibition (Shiraishi et al., 2000). Similarly, the higher photosynthetic effciency of microalgae in the presence of ethanol could be resulted from the reduced damage of photosystem apparatus under photoinhibition conditions, as formate is an intermediate compound in the process of ethanol catabolism as well.
The inhibitory effect of ethanol at a relatively higher (0.1%–1%) concentration in uni-algal culture is expected as ethanol disrupts the cell metabolism and function of most microbes (Ingram and Buttke, 1985). Miazek et al. (2017) described that the growth of phytoplankton can be stimulated by lower ethanol concentration, up to 3 g/L depending on the strain, and the increase in ethanol concentration can cause inhibition to microalgae. El Jay (1996) also reported that the growth of Chlorella vulgaris was inhibited by 37%, 86%, and 95% when exposed to 0.05%, 0.5%, and 1% ethanol, respectively.
4.2 A low concentration of ethanol stimulated the growth of satellite bacteriaThis study clearly showed that ethanol significantly affected the growth of bacteria depending on the concentration of ethanol. The increased growth of satellite bacteria at a low concentration of ethanol (0.01%–1%) revealed that exogenous ethanol promoted the growth of bacteria. Our result indicated, in addition to the growth-promoting effect, ethanol promoted the formation of long filamentous cells of satellite bacterium, which may be resulted from stress response to ethanol (Jones et al., 2013). Similarly, the formation of filamentous cells by E. coli has been reported when exposed to ethanol (Ingram, 1981) and high hydrostatic pressure (Zobell and Cobet, 1964; Kawarai et al., 2004).
The mechanism of how ethanol affects bacteria is still controversial; to elucidate this we have cultured M. alba in an artificial media devoid of carbon which can allow us to examine whether ethanol serves as a carbon source or stimulant. The result showed that the growth of M. alba was promoted when the artificial media was provided with glucose as the only carbon source, indicating M. alba used glucose as a carbon source. On the other hand, there was no growth when the artificial media was provided with ethanol as the only carbon source, indicating M. alba did not use ethanol as a metabolic carbon source. Furthermore, another experiment (where M.alba cultured in LB media treated with ethanol) showed that the adhA gene was not expressed while there was higher biomass growth in the ethanol-treated culture of M. alba. This indicates that the response to ethanol did not involve the expression of the alcohol dehydrogenase gene, which in turn, indicated that the cells did not use ethanol as a metabolic carbon source. Our results disagreed with those of a study reported by Takemura et al. (1993), in which alcohol dehydrogenase enzyme activity of Acetobacter pasteurianus increased in the ethanol-treated group. Furthermore, in contrast to our result, Crocker et al. (2019) also showed that the human opportunistic pathogen Pseudomonas aeruginosa exhibited significant growth in a mediawhere ethanol was the only carbon source, indicating ethanol was used as metabolic carbon. Other studies also showed that ethanol can serve as a metabolic carbon source (Fukui et al., 1988; Clark and Cronan, 2005; Mohammadkazemi et al., 2015). Nonetheless, our finding agreed with the recent report of Ferraro and Finkel (2019), where mutant E. coli (lacking alcohol dehydrogenase genes) significantly responded to the addition of ethanol and butanol, suggesting that alcohol catabolism was not required to cause delayed stationary phase of E. coli. Moreover, ethanol was reported as a signal molecule that stimulates salt stress tolerance in the bacteria Acinetobacter (Smith et al., 2004). In Staphylococcus aureus culture ≤0.1%, ethanol resulted in a delayed transition from primary to secondary metabolite catabolism (Chatterjee et al., 2006). This agrees with our speculation that ethanol serves as a growth stimulatory factor.
4.3 Ethanol does not affect the species composition of satellite bacteria in phytoplankton monocultureThe extended use of Illumina sequencing of bacterial 16S rRNA revealed that the three phytoplankton culture strains harbor peculiar bacteria communities. This indicated that every phytoplankton culture harbors a different type of satellite bacterial community. This could be explained as the bacteria that were initially present in the phycosphere and are capable of growing in association with the algae are selected for successive transfers (Jasti et al., 2005). This meant specific bacteria communities could be selected in the culture systems as species-specific interaction between phytoplankton and bacteria has been observed in the phycosphere (Rooney-Varga et al., 2005). Moreover, field observation (Sison-Mangus et al., 2016) and seawater microcosm experiments in the northwestern Mediterranean Sea (Pinhassi et al., 2004) suggested that phytoplankton-associated bacterial communities are strongly affected by the type of algal species that dominates in the natural blooms than just the phytoplankton bloom. Sch fer et al. (2002) also reported six uni-algal species of diatom showed distinct bacterial phylotypes associated with each genus. Similar to our result the genus Sphingomonadaceae found in S. costatum, and two other marine microalgae cultures (Jasti et al., 2005), and the species Mameliella alba found in uni-algal culutres of marine microlaga Symbiodinium (Varasteh et al., 2020).
There was no significant difference in microbial community composition between control and ethanol treatments, indicating ethanol does not cause changes in bacterial community structure. The slight decline of satellite bacterial species diversity in ethanol-treated cultures could be associated with the increase in the number of few dominant satellite bacteria. Moreover, ethanol promoted the growth of all satellite bacterial strains isolated from phytoplankton cultures and E. coli. That means, ethanol, did not stimulate only aparticular group (taxa) of bacteria. Our result is not in agreement with that of Ferraro and Finkel (2019), who reported that the bacterial genera associated with humans, such as the strains of Pseudomonas, Streptococcus, and Klebsiella are affected by ethanol, whereas the non-human associated strains such as those of Vibrio and Shewanella showed no effect. The growth of satellite bacteria increased with the increase of ethanol concentration from 0.01%–1%, while E. coli did not show a similar pattern. This indicates that the satellite bacteria community has higher ethanol tolerance than E. coli. Moreover, as is shown in Fig. 2, the response level to ethanol was varied among various satellite bacteria. This indicates, some bacteria might grow more than the others in the same culture system and they might cause their pronounced effects on the microalgae. Some of these effects could have resulted from the physiological changes in bacteria and consequent release of some bioactive compounds that might inhibit or promote the microalgae. Similarly, some of the satellite bacteria change their morphology (Supplementary Fig.S2) as a stress response to ethanol which might have some effects on the growth of microalgae. Furthermore, future studies on the effect of ethanol on nonaxenic culture of microalgae, axenic culture of microlagae, axenic culture satellite bacteria, and co-culture of single strains of microalgae and single strains of satellite bacteria would give a more comprehensive idea about the response of microalgae to ethanol under nonaxenic culture system.
5 CONCLUSIONThis study indicate that ethanol significantly affected the growth of phytoplankton and its satellite bacteria. The congruent occurrence of 1) distinct and statistically significant increase of M. alba growth in ethanol-receiving treatments when provided with basic growth media (LB) that has organic carbon source, 2) the negligible growth difference between the initial and final day values of both control and ethanol-receiving treatment when there was no carbon source, and 3) the statistically insignificant variation between ethanol-receiving treatment and control when there was no carbon source indicates that ethanol promoted the growth of satellite bacterium serving as a growth stimulatory factor rather than as only a metabolic carbon source. Moreover, this study revealed that a low concentration of ethanol stimulate the growth of satellite bacteria indiscriminately, and every phytoplankton has their distinct satellite bacteria communities. The outcome of this study on the physiological and growth stimulatory effect of ethanol on satellite bacteria would help us to augment our knowledge about the effect of ethanol on bacteria and its application on environmental microbiology and can be used as a baseline for future biotechnological research.
6 DATA AVAILABILITY STATEMENTThe authors declare that all the data are available without restriction.
7 AUTHORSHIP CONTRIBUTIONY G, R A, B H A, and B H conceived the project; V P and D E, methodology; L S prepared samples and laboratory facilities; R A and B H A performed the experiment and data analysis; C C and J L contributed to experimental design; and R A, D K, S K, Y B, B H, and Y G wrote and edit the manuscript.
Electronic supplementary material
Supplementary material (Supplementary Figs.S1–S5) is available in the online version of this article at
Azam F, Malfatti F. 2007. Microbial structuring of marine ecosystems. Nature Reviews Microbiology, 5(10): 782-791.
DOI:10.1038/nrmicro1747 |
Bezerra R P, Matsudo M C, Pérez Mora L S, et al. 2014. Ethanol effect on batch and fed-batch Arthrospira platensis growth. Journal of Industrial Microbiology & Biotechnology, 41(4): 687-692.
|
Chatterjee I, Somerville G A, Heilmann C, et al. 2006. Very low ethanol concentrations affect the viability and growth recovery in post-stationary-phase Staphylococcus aureus populations. Applied and Environmental Microbiology, 72(4): 2627-2636.
DOI:10.1128/AEM.72.4.2627-2636.2006 |
Chen A I, Dolben E F, Okegbe C, et al. 2014. Candida albicans ethanol stimulates Pseudomonas aeruginosa WspR-controlled biofilm formation as part of a cyclic relationship involving phenazines. PLoS Pathogens, 10(10): e1004480.
DOI:10.1371/journal.ppat.1004480 |
Clark D P, Cronan J E. 2005. Two-carbon compounds and fatty acids as carbon sources. EcoSal Plus, 1(2): 1-34.
DOI:10.1128/ecosalplus.3.4.4 |
Cole J J. 1982. Interactions between bacteria and algae in aquatic ecosystems. Annual Review of Ecology and Systematics, 13: 291-314.
DOI:10.1146/annurev.es.13.110182.001451 |
Crocker A W, Harty C E, Hammond J H, et al. 2019. Pseudomonas aeruginosa ethanol oxidation by AdhA in low-oxygen environments. Journal of Bacteriology, 201(23): e00393-19.
|
El Jay A. 1996. Toxic effects of organic solvents on the growth of Chlorella vulgaris and Selenastrum capricornutum. Bulletin of Environmental Contamination and Toxicology, 57(2): 191-198.
DOI:10.1007/s001289900174 |
Feris K, Mackay D, de Sieyes N, et al. 2008. Effect of ethanol on microbial community structure and function during natural attenuation of benzene, toluene, and o-xylene in a sulfate-reducing aquifer. Environmental Science & Technology, 42(7): 2289-2294.
|
Ferraro C M, Finkel S E. 2019. Physiological, genetic, and transcriptomic analysis of alcohol-induced delay of Escherichia coli death. Applied and Environmental Microbiology, 85(2): e02113-18.
|
Field C B, Behrenfeld M J, Randerson J T, et al. 1998. Primary production of the biosphere: integrating terrestrial and oceanic components. Science, 281(5374): 237-240.
DOI:10.1126/science.281.5374.237 |
Fujita T, Aoyagi H, Ogbonna J C, et al. 2008. Effect of mixed organic substrate on ǁ-tocopherol production by Euglena gracilis in photoheterotrophic culture. Applied Microbiology and Biotechnology, 79(3): 371-378.
DOI:10.1007/s00253-008-1443-0 |
Fukui K, Kato K, Kodama T, et al. 1988. ATP formation in aerobic catabolism of ethanol by oral Streptococci. Proceedings of the Japan Academy, Series B, 64(1): 13-16.
DOI:10.2183/pjab.64.13 |
Ghosh M, Anthony C, Harlos K, et al. 1995. The refined structure of the quinoprotein methanol dehydrogenase from Methylobacterium extorquens at 1.94 å.. Structure, 3(2): 177-187.
DOI:10.1016/S0969-2126(01)00148-4 |
Guillard R R L, Ryther J H. 1962. Studies of marine planktonic diatoms: I. Cyclotella nana Husted, and Detonula confervacea (Cleve) Gran. Canadian Journal of Microbiology, 8(2): 229-239.
|
Guillard R R L, Sieracki M S. 2005. Counting cells in cultures with the light microscope. In: Andersen R A ed. Algal Culturing Techniques. Elsevier Academic Press, London. p. 239-252.
|
He P J, Han W H, Shao L M, et al. 2018. One-step production of C6-C8 carboxylates by mixed culture solely grown on CO. Biotechnology for Biofuels, 11(1): 4.
DOI:10.1186/s13068-017-1005-8 |
Hetharua B, Min D R, Liao H, et al. 2018. Litorivita pollutaquae gen. nov., sp. nov., a marine bacterium in the family Rhodobacteraceae isolated from surface seawater of Xiamen Port, China.. International Journal of Systematic and Evolutionary Microbiology, 68(12): 3908-3913.
DOI:10.1099/ijsem.0.003084 |
Huo S H, Kong M, Zhu F F, et al. 2018. Mixotrophic Chlorella sp. UJ-3 cultivation in the typical anaerobic fermentation effluents.. Bioresource Technology, 249: 219-225.
DOI:10.1016/j.biortech.2017.10.042 |
Ingram L O N, Buttke T M. 1985. Effects of alcohols on microorganisms. Advances in Microbial Physiology, 25: 253-300.
|
Ingram L O. 1981. Mechanism of lysis of Escherichia coli by ethanol and other chaotropic agents. Journal of Bacteriology, 146(1): 331-336.
DOI:10.1128/jb.146.1.331-336.1981 |
Jasti S, Sieracki M E, Poulton N J, et al. 2005. Phylogenetic diversity and specificity of bacteria closely associated with Alexandrium spp. and other phytoplankton. Applied and Environmental Microbiology, 71(7): 3483-3494.
DOI:10.1128/AEM.71.7.3483-3494.2005 |
Jones T H, Vail K M, McMullen L M. 2013. Filament formation by foodborne bacteria under sublethal stress. International Journal of Food Microbiology, 165(2): 97-110.
DOI:10.1016/j.ijfoodmicro.2013.05.001 |
Kato S, Kitamura E, Yamamoto S, et al. 1991. Effects of sodium chloride, ethanol, glucose content and pH on the growth of lactic acid bacteria isolated from salted pDaikonq(Raphanus sativus). Nippon Shokuhin Kogyo Gakkaishi, 38(10): 962-966.
DOI:10.3136/nskkk1962.38.962 |
Kawarai T, Wachi M, Ogino H, et al. 2004. SulA-independent filamentation of Escherichia coli during growth after release from high hydrostatic pressure treatment. Applied Microbiology and Biotechnology, 64(2): 255-262.
DOI:10.1007/s00253-003-1465-6 |
Kester D R, Duedall I W, Connors D N, et al. 1967. Preparation of artificial seawater. Limnology and Oceanography, 12(1): 176-179.
DOI:10.4319/lo.1967.12.1.0176 |
Kirstine W V, Galbally I E. 2012. Ethanol in the environment: a critical review of its roles as a natural product, a biofuel, and a potential environmental pollutant. Critical Reviews in Environmental Science and Technology, 42(16): 1735-1779.
DOI:10.1080/10643389.2011.569874 |
Lin L A, Liu W W, Zhang M P, et al. 2019. Different height forms of Spartina alterniflora might select their own Rhizospheric bacterial communities in southern coast of China. Microbial Ecology, 77(1): 124-135.
DOI:10.1007/s00248-018-1208-y |
Matsudo M C, Sousa T F, Pérez-Mora L S, et al. 2017. Ethanol as complementary carbon source in Scenedesmus obliquus cultivation. Journal of Chemical Technology & Biotechnology, 92(4): 781-786.
|
Mayali X. 2018. Editorial: metabolic interactions between bacteria and phytoplankton. Frontiers in Microbiology, 9: 727.
DOI:10.3389/fmicb.2018.00727 |
Menzyanova N G, Bozhkov A I, Sotnik N N. 2002. Influence of ethanol on the growth dynamics and metabolism of triacylglycerides and ǂ-carotene in Dunaliella viridis Teod. International Journal on Algae, 4: 99-111.
DOI:10.1615/InterJAlgae.v4.i2.80 |
Menzyanova N G, Bozhkov A I. 2003. Influence of ethanol on metabolism of algae. Growth dynamics, content of nucleic acids, proteins, and lipids in Chlorella vulgaris Beijer and Spirulina platensis (Nordst.) Geitl. Cells.. International Journal on Algae, 5(3): 64-73.
DOI:10.1615/InterJAlgae.v5.i3.50 |
Miazek K, Kratky L, Sulc R, et al. 2017. Effect of organic solvents on microalgae growth, metabolism and industrial bioproduct extraction: a review. International Journal of Molecular Sciences, 18(7): 1429.
DOI:10.3390/ijms18071429 |
Milani M, Consoli S, Marzo A, et al. 2020. Treatment of winery wastewater with a multistage constructed wetland system for irrigation reuse. Water, 12(5): 1260.
DOI:10.3390/w12051260 |
Mohammadkazemi F, Doosthoseini K, Azin M. 2015. Effect of ethanol and medium on bacterial cellulose (BC) production by Gluconacetobacter xylinus (PTCC 1734). Cellulose Chemistry and Technology, 49(5-6): 455-462.
|
Navakoudis E, Ioannidis N E, Dörnemann D, et al. 2007. Changes in the LHCII-mediated energy utilization and dissipation adjust the methanol-induced biomass increase. Biochimica et Biophysica Acta (BBA)-Bioenergetics, 1767(7): 948-955.
DOI:10.1016/j.bbabio.2007.05.003 |
Ono K, Kawanaka Y, Izumi Y, et al. 1995. Mitochondrial alcohol dehydrogenase from ethanol-grown Euglena gracilis. The Journal of Biochemistry, 117(6): 1178-1182.
DOI:10.1093/oxfordjournals.jbchem.a124841 |
Parks D H, Tyson G W, Hugenholtz P, et al. 2014. STAMP: statistical analysis of taxonomic and functional profiles. Bioinformatics, 30(21): 3123-3124.
DOI:10.1093/bioinformatics/btu494 |
Pinhassi J, Sala M M, Havskum H, et al. 2004. Changes in Bacterioplankton composition under different phytoplankton regimens. Applied and Environmental Microbiology, 70(11): 6753-6766.
DOI:10.1128/AEM.70.11.6753-6766.2004 |
Rideout J R, He Y, Navas-Molina J A, et al. 2014. Subsampled open-reference clustering creates consistent, comprehensive OTU definitions and scales to billions of sequences. PeerJ, 2: e545.
DOI:10.7717/peerj.545 |
Rodriguez-Caballero A, Ramond J B, Welz P J, et al. 2012. Treatment of high ethanol concentration wastewater by biological sand filters: enhanced COD removal and bacterial community dynamics. Journal of Environmental Management, 109: 54-60.
|
Rooney-Varga J N, Giewat M W, Savin M C, et al. 2005. Links between phytoplankton and bacterial community dynamics in a coastal marine environment. Microbial Ecology, 49(1): 163-175.
DOI:10.1007/s00248-003-1057-0 |
Schäfer H, Abbas B, Witte H, et al. 2002. Genetic diversity of nsatelliteo bacteria present in cultures of marine diatoms. FEMS Microbiology Ecology, 42(1): 25-35.
|
Sharma B, Felix J D, Myles L T, et al. 2021. Wet deposition ethanol concentration at US atmospheric integrated research monitoring network (AIRMoN) sites. Journal of Atmospheric Chemistry, 78(2): 125-138.
DOI:10.1007/s10874-020-09414-5 |
Shiraishi T, Fukusaki E I, Miyake C, et al. 2000. Formate protects photosynthetic machinery from photoinhibition. Journal of Bioscience and Bioengineering, 89(6): 564-568.
DOI:10.1016/S1389-1723(00)80058-4 |
Sison-Mangus M P, Jiang S, Kudela R M, et al. 2016. Phytoplankton-associated bacterial community composition and succession during toxic diatom bloom and non-bloom events. Frontiers in Microbiology, 7: 1433.
|
Smith M G, Des Etages S G, Snyder M. 2004. Microbial synergy via an ethanol-triggered pathway. Molecular and Cellular Biology, 24(9): 3874-3884.
DOI:10.1128/MCB.24.9.3874-3884.2004 |
Stratton G W. 1987. Toxic effects of organic solvents on the growth of blue-green algae. Bulletin of Environmental Contamination and Toxicology, 38(6): 1012-1019.
DOI:10.1007/BF01609089 |
Suggett D J, MacIntyre H L, Geider R J. 2004. Evaluation of biophysical and optical determinations of light absorption by photosystem II in phytoplankton. Limnology and Oceanography: Methods, 2(10): 316-332.
DOI:10.4319/lom.2004.2.316 |
Takemura H, Kondo K, Horinouchi S, et al. 1993. Induction by ethanol of alcohol dehydrogenase activity in Acetobacter pasteurianus. Journal of Bacteriology, 175(21): 6857-6866.
DOI:10.1128/jb.175.21.6857-6866.1993 |
Tashiro Y, Inagaki A, Ono K, et al. 2014. Low concentrations of ethanol stimulate biofilm and pellicle formation in Pseudomonas aeruginosa. Bioscience, Biotechnology, and Biochemistry, 78(1): 178-181.
DOI:10.1080/09168451.2014.877828 |
Trcek J. 2005. Quick identification of acetic acid bacteria based on nucleotide sequences of the 16S-23S rDNA internal transcribed spacer region and of the PQQ-dependent alcohol dehydrogenase gene. Systematic and Applied Microbiology, 28(8): 735-745.
DOI:10.1016/j.syapm.2005.05.001 |
Varasteh T, Moreira A P B, Lima A W S, et al. 2020. Genomic repertoire of Mameliella alba Ep20 associated with Symbiodinium from the endemic coral Mussismilia braziliensis. Symbiosis, 80(1): 53-60.
DOI:10.1007/s13199-019-00655-x |
Willey J D, Avery G B, Felix J D, et al. 2019. Rapidly increasing ethanol concentrations in rainwater and air. npj Climate and Atmospheric Science, 2(1): 3.
DOI:10.1038/s41612-018-0059-z |
Wu C C, Wang W, Yue L, et al. 2013. Enhancement effect of ethanol on lipid and fatty acid accumulation and composition of Scenedesmus sp. Bioresource Technology, 140: 120-125.
DOI:10.1016/j.biortech.2013.04.079 |
Yao S, Lyu S, An Y, et al. 2019. Microalgaeʜbacteria symbiosis in microalgal growth and biofuel production: a review. Journal of Applied Microbiology, 126(2): 359-368.
DOI:10.1111/jam.14095 |
Zobell C E, Cobet A B. 1964. Filament formation by Escherichia coli at increased hydrostatic pressures. Journal of Bacteriology, 87(3): 710-719.
DOI:10.1128/jb.87.3.710-719.1964 |