 2023, Vol. 41
Institute of Oceanology, Chinese Academy of Sciences
Article Information
- DENIS Michel, LEFEVRE Dominique, THYSSEN Melilotus, R.JENKINSON Ian, GRÉGORI Gérald
- Pulsed export of carbon in the north-western Mediterranean Sea
- Journal of Oceanology and Limnology, 41(1): 189-202
- http://dx.doi.org/10.1007/s00343-022-2026-0
Article History
- Received Jan. 20, 2022
- accepted in principle Feb. 25, 2022
- accepted for publication Apr. 24, 2022


3 Agency for Consultation and Research in Oceanography, Lavergne, 19320 La Roche Canillac, France
Biological activity in the ocean occurs primarily in the sunlit layer. The ocean occupies about 70% of the Earth surface, the oceanic primary production comprises about half that of the planet (Field et al., 1998), driven by phytoplankton photosynthetic activity. The short life cycle of phytoplankton cells implies they are highly biodynamic, enabling them to sustain the oceanic primary production from a phytoplankton, which represents only 0.2% of the total world biomass. In a first phase, most of the efforts of the scientific community focused on characterizing and quantifying oceanic primary production. Then the fate of this primary production was assessed in the sunlit layer where biological activity seemed concentrated and organic matter mineralisation became an increasing topic of interest, unveiling the role of heterotrophic microbes (Williams, 1981; see also a review by del Giorgio and Duarte, 2002). To investigate the export of the primary production to the deep ocean, the biological activity in the mesopelagic (200–1 000 m) and bathypelagic (1 000–4 000 m) realms has to be quantified, because it is there that heterotrophic prokaryotes (HP) are the main agents of organic matter mineralisation, the key difference between the mesopelagic layer and deeper being the water mass residence-time, decades for the former, centuries for deeper layers (Arístegui et al., 2009). Whereas it was long considered that biological activity was negligible in deep waters (Menzel and Ryther, 1968), in-situ determinations in the mesopelagic layer and calculation of vertically integrated respiratory activity (Packard et al., 1988; Lefèvre et al., 1996; Boyd et al., 1999) supported the idea that biological activity below the epipelagic layer could be of the same order as biological activity in oceanic upper 200 m. This dark-ocean activity was thought to be fuelled by export of particulate organic carbon (Boyd et al., 1999), but it has since been shown that dissolved organic carbon is the main source of organic matter mineralisation in the mesopelagic layer (Lefèvre et al., 1996; Karl et al., 1998). Primary production, calculated from the dynamics of particulate organic matter variation, is not the only source of dissolved organic matter; phytoplankton exudation, which has rarely been included in budgets of primary production, is now suspected of playing a significant auxiliary role in the export of organic matter. Indeed, transparent exopolymeric particles (TEP), formed from dissolved polysaccharide precursors, have received much attention (Passow, 2002; Verdugo et al., 2004), and their implication in organic matter export is now clearly established (Engel et al., 2004).
The present study was a contribution to a national programme dedicated to the Dynamics of rapid processes in the water column. We report here experimental evidence of pulsed export of HP cells from the epipelagic layer that did not exhibit a clear periodicity. This pulsed export was revealed by investigating the short-term (hourly scale) variation of the vertical HP distribution from the surface down to 1 150 m. The distribution and viability of HP cells was established by on-board flow cytometry analysis of freshly collected samples. Their respiratory activity was assessed later in the laboratory. Results are interpreted by hypothesising a mechanism of TEP-mediated particle export to the mesopelagic layer in line with that demonstrated in mesocosm experiments by Engel et al. (2004).
2 MATERIAL AND METHOD 2.1 Sampling site and strategySampling was carried out on board R/V Thalassa during the cruise DYNAPROC2 (DYNAmics of the rapid PROCesses in the water column) conducted through 2 legs from 14 September (Julian day of the year 2004, JD258) to 18 October 2004 (JD292) at a station 28 miles offshore (43°25ʹ04ʺN, 8°00ʹ05ʺE) located near the permanent DYFAMED station (43°25ʹ02ʺN, 7°51ʹ08ʺE), depth 2 350 m, in the north-western (NW) Mediterranean Sea (Fig. 1). Seawater was collected with a rosette sampler carrying 24 Niskin bottles of 12 dm3 and a multi-sensor profiler (CTD-SeaBird SBE 911 plus) for the measurements of conductivity, temperature, depth, and fluorescence. In the epipelagic layer, seawater was collected at 5, 20, 30, 40, 50, 60, 70, 80, 90, 100, 120, and 150 m. Sampling was conducted through 4 cycles of 5 days each with CTD casts every 6 h. Within cycles 2 and 4, additional casts increased the sampling frequency to every 3 h over 36 h.

|
| Fig.1 Location of the site investigated in the north-western Mediterranean Sea during the DYNAPROC2 cruise, from 14 September (Julian day, JD258) to 18 October (JD292) 2004 The purple square dots illustrate stations of the transect sampled to verify that the TSS station remained beyond the Liguro-Provence front and the Ligurian coastal current. The permanent DYFAMED station corresponds to the square dot in the coastal side of the 16 station grid (blue asterisks). The red star represents the Time Series Station (TSS) located at 43°25ʹ04ʺN, 8°00ʹ05ʺE between Nice and Corsica. A network of 16 satellite stations was also sampled 3 times to verify horizontal gradients surrounding the TSS central point as weak (Andersen et al., 2009). |
During each leg, seawater was collected in the mesopelagic layer at 300, 350, 430, 510, 590, 670, 750, 830, 910, 990, 1 070, and 1 150 m, over a period of 36 h, with CTD casts every 3 h.
2.2 Flow cytometryFor flow cytometry analysis, seawater samples were collected at each depth in 150-cm3 flasks not completely filled to enable homogenisation. Seawater was filtered through a 100-μm mesh size net to prevent clogging of the flow cytometer, and homogenised before taking subsamples for the subsequent flow cytometry analysis following vortexing. Results are therefore representative of abundances averaged over the initial volume (between 100 and 150 cm3). Under these conditions, replicates would improve neither the information nor the accuracy defined by the reproducibility of the instrument and the Poisson law regarding count levels (Shapiro, 2003).
The HP analyses by flow cytometry were carried out on board, directly upon collection of the seawater from the Niskin bottles, after each CTD cast, by using a flow cytometer (Cytoron Absolute, Ortho Diagnostic Systems) equipped with an air-cooled 488-nm argon laser. The sample and sheath rates were 1 and 100 mm3/s respectively. For each cell, 5 optical variables were recorded: two scatter variables, namely forward angle scatter (related to particle size) and right angle scatter (related to cell structure), and three fluorescence variables measured emissions in the red (> 620 nm), orange (565–592 nm) and green (515–530 nm) wavelength ranges. Data were collected and stored in list-mode with the IMMUNOCOUNT® software (ORTHO Diagnostic Systems) that also provided the cell concentrations (cells/cm3) of the cell groups resolved by the cluster analyses.
Two protocols were applied to each sample. One subsample was stained with SYBRGreen™ (Molecular Probes® solution diluted 1/5 000 in final solution; see also Zhao et al., 2020), staining nucleic acids for the overall cell counting and cell group resolution. For this purpose, each 1-cm3 seawater sample was supplemented with 10-mm3 SYBRGreen™ and incubated 15 min in the dark before analysis. Counting reproducibility was better than 3.7 standard deviation (SD) (n=23) over a range of concentrations extending one order of magnitude (Grégori et al., 2001).
The other subsample was subjected to the nucleic acid double staining (NADS) experiment to test cell viability. These subsamples were supplemented with SYBRGreen™ and propidium iodide (PI, Sigma), according to Grégori et al. (2001).
2.3 Respiratory activityFor respiratory activity measurements, two Niskin bottles were filled at each depth and these seawater samples were further filtered onto 47-mm GFF glass fibre filters. Filters were then preserved in cryovials, freeze trapped and stored in liquid nitrogen until their use in the laboratory where they were submitted to the electron transport system (ETS) assay of Packard (1971), following the upgraded protocol (Packard and Williams, 1981; Packard et al., 1996; Packard and Christensen, 2004) based on the kinetics of INT (iodonitrotetrazolium salt) reduction by NADH dehydrogenase upon nicotinamide adenine dinucleotide (NADH) addition.
2.4 HP Integrated abundanceIntegrated abundances of HP were calculated according to the trapezoidal method for the different ocean layers that were assessed: epipelagic (0– 200 m), mesopelagic (200–1 000 m), bathypelagic (1 000–1 150 m). HP abundances at 200 and 1 000 m were derived by interpolation from the study data.
3 RESULTA grid of 16 stations was sampled 3 times to locate the most suitable station for this study, which was chosen as the cruise Time Series Station (TSS), 43°25ʹN, 8°00ʹE, between Nice and the Corsica island, the central point (Fig. 1), where horizontal gradients were observed to be weak (Andersen et al., 2009). Such conditions favoured the investigation of short-term processes in the vertical dimension, with the least interference possible from horizontal effects such as lateral advection.
3.1 HP viabilityFigure 2 displays a typical cytogram illustrating HP viability in all the analysed samples, whether belonging to the epipelagic or mesopelagic layers. Such cytograms distinguished (i) live cells, only exhibiting the green fluorescence of SYBRGreen™, (ii) damaged cells, distinguished by their red fluorescence from PI which only penetrates cells when they are damaged. These cells strongly bind nucleic acids as an intercalant, indicating their strong affnity for one another. PI emits red fluorescence upon excitation by the 488-nm laser. If PI binds a nucleic acid close (< 70 Å) to a bound SYBRGreen™ probe, it induces a fluorescence resonance energy transfer from SYBRGreen™ to propidium that triggers the PI red fluorescence emission and prevents the green fluorescence emission of SYBRGreen™. This is why when the cell damage is large enough, the damaged cells are characterised not only by red fluorescence but also by a lower green fluorescence than the live cells. The cytograms also distinguished (iii) rapidly decaying cells for which both green and red fluorescence signals are lower than those of the damaged cells exhibiting the maximum red fluorescence. There was no accumulation of dead cells. The nucleic acid degradation decreases the number of binding sites for both PI and SYBRGreen™. The average percentage of live cells through all the study was 94.8%±2.2% (n=240).

|
| Fig.2 Flow cytogram visualisation of heterotrophic prokaryote viability All samples were subject to this kind of flow cytometry according to the double staining procedure of Grégori et al. (2001). The Green fluorescence versus red fluorescence cytograms enabled the distinction of (i) live cells, only exhibiting the green fluorescence of SYBRGreen™, (ii) damaged cells exhibiting red fluorescence from propidium iodide and a lower green fluorescence under the occurrence of fluorescence resonance energy transfer (FRET) between SYBRGreen™ and propidium iodide that penetrates damaged membranes, and (iii) rapidly decaying cells for which both green and red fluorescence are decreasing compared to damaged cells that exhibit the maximum red fluorescence signal. Damaged cells were decaying quickly enough to prevent accumulation of dead cells which reflects the loss of binding sites on nucleic acids for both PI and SYBRGreen™. a.u.: arbitrary unit. |
The viability control does not distinguish the clusters resolved with a specific protocol (Fig. 3). It is therefore reasonable to extend to each cluster the overall percentage of live cells (94.8%).

|
| Fig.3 Depth dependence of the structure of the heterotrophic prokaryote community in the epipelagic layer from nucleic acid content Cells were stained with SYBRGreen™ (Molecular Probes). a. 50 m, the green fluorescence versus side scatter signal cytograms resolved two groups, HNA1 and HNA2, with high nucleic acid content and one group, LNA, with low nucleic acid content. The HNA2 cells were restricted to the upper 50-m depth, and may belong to aerobic anoxygenic photoheterotrophic bacteria (AAPs, Kolber et al., 2000); b. 90 m, in the deeper epipelagic layer at 90-m depth only the classical HNA and LNA groups could be resolved, like in the mesopelagic layer (not shown). a.u.: arbitrary unit. |
Three distinct HP groups were resolved in the upper 150 m of the epipelagic layer (Fig. 3). In addition to the usual (Gasol et al., 1999) high nucleic acid content (here labeled HNA1) and low nucleic acid content (LNA) cells, a second HNA group, labeled HNA2 (Fig. 3) was observed. Its nucleic acid content (green fluorescence signal) and its side scatter signal were higher than those of the HNA1 group but its cell abundance was lower and depth-dependent, with a maximum at about 50-m depth and rapidly declining to become undetectable at 90-m depth (Fig. 3).
3.2.2 Vertical distribution variabilityThe vertical distribution of HP in the epipelagic (0–150 m) layer is displayed in Fig. 4. The figure regroups observations made during the four sampling cycles carried out in the epipelagic layer during the cruise. As a general trend, HP was mainly present in the upper 80 m where their abundance exhibited marked variability. For instance, in Cycle 1 at 50-m depth, the maximum abundance (1.82×10⁶ cells/cm3, Julian day 264.21) was about twice (1.9) the minimum abundance (0.97×106×106 cells/cm3) observed on Julian day 264.95. This variability quickly vanished in Cycle 4 after Julian day 287.45, following the sharp decrease in abundance, down to values about eight times less than the abundance value of Julian day 287.45. This large decrease in abundance appeared as a consequence of a strong wind event occurring on Julian day 287 with a wind speed > 25 m/s (Andersen et al., 2009).

|
| Fig.4 Abundance variability of the heterotrophic prokaryote distribution through the epipelagic layer over the four surveys (labeled cycle 1 to cycle 4), monitored during the DYNAPROC2 cruise Time is displayed as Julian days. Dots represent locations of sampled depths. |
A few secondary peaks of HP abundance were observed below 80 m, particularly during cycles 1 and 2, for instance at Julian days 265.72 and 271.72 respectively. A close examination of the related vertical distributions revealed that all these deeper abundance peaks were associated with an abundance trough at 60–80 m as shown in Fig. 5.

|
| Fig.5 Vertical profiles of heterotrophic prokaryote distributions in the epipelagic layer, showing examples of the occurrence of secondary abundance peaks at 100-m depth for samples collected at days 265.72 and 271.72 (red curve in (a), green curve in (b)), both with an abundance trough at about 60 m |
The vertical distribution of HPs in the 300–1 150-m layer established during the cruise over two periods of 36 h, through CTD casts run every 3 h, is displayed in Fig. 6. One notable feature is the sustained and large abundance of HPs at the 500-m level where their concentration reached values more than twice the background level in deeper water. Another striking observation is the presence of a number of abundance peaks found at different depths below 500 m (Figs. 6 & 7) and occurring without apparent periodicity.

|
| Fig.6 Abundance variability of the heterotrophic prokaryote distribution through the mesopelagic layer over two 36-h periods with CTD casts every 3 h There was a sustained accumulation of HP cells at about 500-m depth, a layer known to be occupied by mesozooplankton involved in diel vertical migration. Further deep, secondary abundance peaks were observed in an apparently random way regarding depth and time. No spatial or temporal periodicity could be inferred from the data. Typical individual vertical profiles of HP abundance exhibiting such deep maximum abundances are shown in Fig. 7. |

|
| Fig.7 Examples of vertical profiles of heterotrophic prokaryote distribution emphasising the accumulation of HP cells at the 500-m level and the apparently random occurrence of large peaks of HP abundance observed at greater depths See also Fig. 6. |
The respiration rate of HPs in the dark layer was determined as detailed in Section 2. Figure 8a displays a typical vertical distribution of the HP respiratory activity between 300- and 1 150-m depth, on Julian day 282.979. This distribution followed the same pattern as the HP abundance vertical distribution. The respiratory activity was always high at the 500-m depth level and peaks of respiratory activity were observed at greater depths in a non-periodic way and coinciding with the related peaks of HP abundance. On the same graph, with a distinct respiration rate scale, is represented the vertical distribution of the related specific respiration rate (fmol O2/(h·cell)). The comparison of these two vertical distributions highlights two remarkable features: (i) the trough in the respiration rate occurring in the 400–500-m layer coincides with a trough in HP cell-specific activity at 430 m, and (ii) the peaks of HP respiration rate observed at 590-, 750-, and 1 000-m coincide with peaks of HP specific activity at the same respective depths. The mean value of these 3 peaks of HP specific activity differs by only 2.5% from the specific activity at 300 m, assigned to cells sinking from the surface layer and penetrating into the mesopelagic layer. Figure 8b displays the time course of the mean cell-specific rate of each cast during leg 2. The highest mean cell-specific activity displayed in Fig. 8b corresponds to the vertical distribution in Fig. 8a (Julian day 282.979). Within 6 h, the mean cell-specific activity decreased from the highest observed value to a kind of base level. Indeed, for that low-level period, the HP cell-specific activity exhibited small variations with depth around the mean value (see Supplementary Fig.S1).

|
| Fig.8 HP respiratory activity during leg2 a. the vertical distribution of heterotrophic prokaryote respiration rate (blue curve) observed on Julian day 282.979. It is displayed with the vertical distribution of the corresponding HP specific activity (HP cell respiration rate, orange curve) using a different scale. Consistently, respiratory activity followed the same vertical distribution as abundance; b. the time course of the mean specific respiratory activity for each vertical distribution determined during leg 2. |
The abundance of HPs was monitored at 510 and 1 000-m depth between Julian days 277 and 290, taking advantage of all casts run during that period. The abundance variability at both depths is displayed in Fig. 9, together with that observed at 50-m depth. Fourier analysis of these three time-series could detect no potential periodicity.

|
| Fig.9 Comparative time courses of heterotrophic prokaryote abundance (×104 cells/cm3) at different depths The temporal variability of HP abundance followed a similar trend at 1 000-and 510-m depth and appeared similarly linked to the variability of HP abundance at 50-m depth, pointing at the epipelagic layer as the main source of the extra HP cells appearing seemingly randomly deeper in the vertical profiles. The arrows highlight the impact of the wind event through the water column evidenced by a simultaneous sharp decline of the HP abundance variability at all depths. |
The average abundance (1.13×10⁵ cells/cm3, n=56) at 1 000-m depth, represented 10.8% of the average abundance (1.05×10⁶ cells/cm3, n=43) at 50 m. Table 1 is given the ranges of abundance variation at 50, 510, and 1 000 m and their respective standard deviations.

The ranges of abundance variation at 510 and 1 000 m represent a very similar percentage (close to 7%) of the abundance variation range at 50-m depth, pointing to the epipelagic layer as the main factor responsible for the HP abundance variability in the mesopelagic realm.
Most of the extreme values (peaks and troughs) at 1 000-m depth correspond to similar extremes (peaks or troughs) at 510-m depth though the amplitudes were different.
The time course variations at the 3 selected depths in Fig. 9 reveal that the wind event that occurred on Julian day 287 not only induced a sharp (3 to 5-fold decrease between 20–70 m within less than 3 h) abundance decline in the epipelagic layer, but also simultaneously affected the whole dark-sampled-layer where HP abundance sharply declined to a depth-dependent baseline level during the remaining days of the experiment.
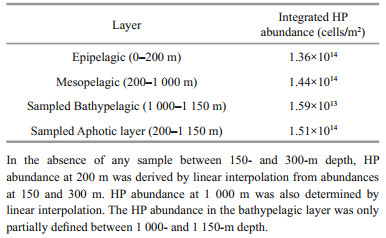
To document the characteristics of the widely accepted ocean layers defined with respect to depth (Arístegui et al., 2009), i.e., epipelagic (0–200 m), mesopelagic (200–1 000 m), and bathypelagic (1 000–4 000 m) within the limit of the study-sampled water column, we calculated the vertically integrated HP abundances over each layer as defined in Material and Method. Results are reported in Table 2. The lower limit of the mesopelagic layer (1 000 m) was interpolated between values determined at 990 and 1 070 m. HP abundance values for the bathypelagic layer were available only between 1 000 and 1 150 m. From our own observations, HP integrated abundance through the mesopelagic layer was quite similar to the one calculated for the epipelagic layer (Table 2).
|
The sampling strategy for the 2004 DYNAPROC2 cruise (present study) was designed to document potential rapid processes involving HP through their abundance and respiration rate. If respiration rates were determined in the laboratory after the cruise from seawater samples collected every 3 h over 36 h, HP abundances were established by on board flow cytometry analysis in almost real time through the 1 200-m water column at high frequency (up to every 3 h, based on Fourier analysis of the HP abundances). It rapidly became clear that the variation of the HP vertical distribution was not periodic (see Figs. 4, 6, & 7). In the same sea area as the present study, Méjanelle and Dachs (2009) found that variation was aperiodic in both biomass and vertical flux of various lipid biomarkers. This is consistent with the finding in the present study that variation of HP abundance was aperiodic in both the epipelagic layer (Fig. 4) and in deeper water (Fig. 6).
Our flow cytometry analysis of HP encompassed both free and attached cells as demonstrated by Mével et al. (2008) during the same cruise. This results from vortexing samples before analyzing them with the flow cytometer and indicates that cells were not tightly bound to the particles. Consequently, the abundances reported here encompass systematically attached and free cells. The observed percentage of viable HP through the study was very high (94.8%±2.2%; n=240). This is very similar to the percentage (96.7 %) observed in a Marseille yacht harbor in February 2000, but higher than the percentage (41.0%) of viable HP found in open sea during the same investigation by the end of March 2000 (Grégori et al., 2003). In fact, the real difference comes from the observation of dead cells (53.3% in March 2000) whereas none was detected in the present study, as if, once damaged, their decay was too rapid to let dead cells accumulate. Nevertheless, it is very important to know that almost all HP cells analysed down to 1 200 m were live cells.
4.1 Epipelagic layer (0–200 m)The HP community structure in the epipelagic layer appeared to be depth-dependent and apparently light dependent for the group labeled HNA2. The fact that this group was only present in the upper 90 m with a maximum abundance at 50-m depth (Fig. 3) makes it a good candidate for being aerobic anoxygenic photoheterotrophic bacteria (AAPs) (Kolber et al., 2000). This question remains open since this group was not sorted for identification and analysis of fingerprinting profiles by capillary electrophoresis single strand conformation polymorphism (CE-SSCP) conducted by Ghiglione et al. (2008) in samples from the same cruise. Our suggested identity (AAPs) thus remains tentative.
The HP abundance was highly variable in the upper 80 m but rarely declined below a relatively steady base-level abundance of around 0.5×10⁶ to 1.0×10⁶ cells/cm3 (Fig. 4). Further secondary peaks of abundance were observed in the 80–150-m subsurface layer as shown in Fig. 5. Interestingly, the vertical profiles of HP abundance exhibiting such peaks like the profiles established on Julian days 265.72 (Fig. 5a) and 271.72 (Fig. 5b) also exhibited an abundance trough in the surface layer, strongly suggesting that peaks in cell abundance appearing apparently randomly in subsurface layers were sinking from their upper location. This is consistent with the upcast seawater collection enabling to sample the trough generated by the sinking cells before it becomes filled by the gradient concentration effect.
4.2 Mesopelagic layer (200–1 000 m)The HP vertical distribution in the mesopelagic layer did not decrease continuously with depth like one would expect but revealed a layer of high abundance around 500 m, permanently occupied by HP (Fig. 6) with a mean abundance value of 1.91×10⁵ cells/cm3 (n=56) at 510 m, more than twice the mean abundance value (7.9×10⁴ cells/cm3 (n=56)) at 1 000 m. This layer is known to host a meso-zooplankton community, a large fraction of which is undergoing diel vertical migrations (Andersen and Sardou, 1992; Andersen et al., 2001a, b; Raybaud et al., 2008; Isla et al., 2015; Kelly et al., 2019). Their abundance is large enough to maintain the presence of the prokaryotic community through their exudation, supplying prokaryotes with fresh and labile dissolved organic matter. In contrast, peaks of HP abundance were observed deeper in an apparently random way regarding time and depth, reaching values as high as in the 500-m layer (Figs. 6–7). These cells were living (Fig. 2) and their respiratory activity was in agreement with earlier observations in this area (Savenkoff et al., 1992, 1993; Lefèvre et al., 1996). The reported deep abundances of HP are consistent with the results from the particle flux study at 200-m depth conducted at 6-h intervals during the cruise (Méjanelle and Dachs, 2009). No day-night periodicity could be inferred from the observations and those authors concluded that the short-term temporal variability of export fluxes was depending primarily on physical constraints exerted by carrier particle dynamics (Méjanelle and Dachs, 2009). The HP abundances exceeding the base line for abundance at each particular depth would thus be drawn down by particles sinking essentially from the epipelagic layer. This is consistent with the similarity of percentages at 510- and 1 000-m depth of abundance variation ranges with respect to that in the epipelagic layer (Table 1). The vertical distribution of HP strongly suggests that these cells were sinking in variable numbers of particles, that they were overwhelmingly alive thus preserving their capacities for respiration (Fig. 8a) and mineralisation activity. There is no reason to think that the particles would have been perfectly identical, carrying the same numbers of cells and sinking simultaneously from the same level. Furthermore, ongoing mineralisation during sinking may modify the particle morphology and their rheology (Jenkinson, 1986; Jenkinson et al., 1991) as may also increase hydrostatic pressure. Consequently, it is reasonable to consider that a sinking event starting in the epipelagic layer would give rise to sinking trails in the mesopelagic and bathypelagic layers, spreading vertically the pulsed nature of the initial event at the surface. The bathypelagic layer bottom depth (4 000 m) is close to the average world ocean depth (3 800 m). Consequently, the HP integrated abundance for the bathypelagic layer can be considered as representative of the bathypelagic ocean (1 000–4 000 m) where HP would be more abundant than in the epipelagic layer (0–200 m), and the mesopelagic layer (200–1 000 m) as well (Table 2). Such a difference might suggest that the CO2 sequestration capacity of the bathypelagic world ocean could be larger than the one of the mesopelagic layer, which remains to be substantiated.
4.3 Respiration rateHP cell-specific respiration rates have been found to closely reflect their metabolic activity (Baltar et al., 2009). The observed trough at 430-m depth in the vertical profile of HP respiratory rate (Fig. 8a) is reminiscent of the abundance troughs at 60-m depth displayed in Fig. 5. This trough strongly suggests that a fraction of the HP community sustained by the presence of meso-zooplankton was drawn down by the pulse of HP loaded particles. In this Fig. 8a, the vertical distribution of HP specific activity is displayed alongside the HP respiratory rate, exhibiting a minimum at 430-m depth where occurred the trough of HP respiratory rate. In contrast, both variables exhibited peak values at the same depths (490, 750, and 1 000 m) suggesting that HP specific activity remained unchanged during sinking as long as the colonised TEPs were not disintegrated. The alternating peaks and minimums in HP specific activity clearly illustrate the succession of pulses whose intensity may decline rapidly as illustrate by the sharp decrease of the mean specific activity in Fig. 8b.
4.4 Wind eventThe wind event that occurred on Julian day 287 with a wind speed > 12.8 m/s, lasted 3 days and was stronger than the one experienced during the DYNAPROC cruise conducted at the same site in May 1995 (Denis et al., 2003). The maximum wind speed was 16 m/s and this wind event affected the suspended particles throughout the water column, decreasing their abundance and their variability as observed by using an under-water video profiler (UVP, Stemman et al., 2000; Denis et al., 2003). In the present study, there was no deployed UVP throughout the whole water column, but the reduced variability of the vertical HP distribution upon the strong wind event suggests the same wind effect as the one observed with a UVP (Stemman et al., 2000; Denis et al., 2003). The wind-induced flocculation generated in the epipelagic layer has previously been found to produce large TEP-diatom aggregates massively and rapidly sinking at the end of the bloom (Passow et al., 1994). Unfortunately, our sampling was interrupted before the return to steady conditions. Nevertheless, this wind impact on the particle vertical distribution deserves specific investigations to quantify its role in carbon export.
4.5 Pulsed carbon-export hypothesisTo account for the reported observations, we formulate the hypothesis that, similarly to the critical micelle concentration (CMC), there exists a critical TEP concentration (cTEPc) above which auto-aggregation occurs to form particles dense enough to sink with the load of heterotrophic prokaryotes colonising them, following the conceptual scheme displayed in Fig. 10.

|
| Fig.10 Conceptual scheme of the pulsed export mechanism induced by the microorganism production of dissolved polysaccharides When this production exceeds 20 μmol/L C (Engel et al., 2004), TEPs are formed and colonised by HP. Beyond the hypothesised critical TEP concentration (cTEPc, defined by analogy with the critical micelle concentration (CMC) for lipids), auto-aggregation occurs leading to sinking of HP loaded particles. |
The existence and production of TEP have been the object of many investigations and are well documented (see a review by Passow, 2002). The rate at which cTEPc is reached depends naturally on the production rate of TEP precursors by phytoplankton whose spatial distribution is not isotropic. The size of TEP was found to be < 100 μm (Beauvais, 2003) which strongly suggests that acquiring a larger size upon aggregation triggers sinking of the particles. When the cTEPc threshold is exceeded in a given volume, TEP auto-aggregation generates one or several sinking particles that leave this volume and its close surroundings with a TEP concentration well below cTEPc, but not equal to zero. Our space and time resolution were insuffcient to provide estimates of such elementary volumes and frequency of sinking TEP particles. However, the data shown in Fig. 5a provides useful information: since the secondary peak in abundance at 100 m on Julian day 265.72 was generated by cells sinking from 60-m depth, and knowing cell concentrations with and without the sinking event in the sampling flasks, at 3-h intervals, it is possible to calculate that the equivalent of 30 to 50 cm3 of seawater with its HP load from 60 m before sinking had sunk to 100 m. Considering that the sinking HP are necessarily attached HP that may represent about 50% of HP in the epipelagic layer (Mével et al., 2008), the secondary abundance peak observed at 100-m depth would comprise cells initially contained at 60 m in a volume of 60 to 100 cm3.
This pulsed export is therefore far from negligible. It is highly likely that the TEP auto-aggregation step also entraps other organic material (including phytoplankton cells) and suspended particles, further reducing the buoyancy of the polysaccharide assemblage. The potentiality of this mechanism was soundly established by Engel et al. (2004) in a mesocosm experiment based on a triggered Emiliania huxleyi bloom. These authors highlighteda cascading aggregation mechanism, increasing collision, and coagulation rates with suspended particles, enhancing sedimentation rates. Additional TEP loading could take place when crossing the thick layer at about 500-m depth with sustained high HP abundance, through collision and coagulation, and perhaps also through the chemotactic behaviour of some HP (Smriga et al., 2016). Importantly, the concentration determined for a peak of HP abundance at depth with respect to the background level would essentially express the dissemination of the HP loading in the TEPs of the initial seawater sample. In the Fig. 7 profile (Julian day 283.979), at 750-m depth, the extra HP drawn down by TEPs would represent about 80 000 cells/cm3. If all these cells were loaded into a single TEP equivalent to a sphere of 500-μm radius, the HP concentration inside that TEP would be 1.53×10⁸ cells/cm3. This is similar to the bacterial concentration (1.9×10⁸ cells/cm3) in marine snow aggregates reported by Smith et al. (1992). In a spherical TEP of 50-μm radius in line with the size limit of 100 μm reported by Beauvais (2003), the HP concentration inside that TEP would be 1.523×10 11 cells/cm3. Assuming a value for HP concentration inside the collected TEPs similar to the bacteria concentration in marine snow (Smith et al., 1992), the TEP abundance spread throughout sample collected at 750-m depth would be 800 TEPs/cm3.
To our knowledge, the reported results are the first field data providing evidence for this pulsed carbon export from the epipelagic to the mesopelagic layer, that may add to other mechanisms contributing to the export function of the biological carbon pump. Our hypothesis is consistent with the very few in-situ TEP measurements (Annane et al., 2015).
The hypothesised pulsed carbon-export mechanism is of critical importance for sustaining the oceanic biological activity: (i) it permanently contributes to flush down the excess of organic matter produced at the surface, preventing its accumulation, (ii) it continuously seeds the water column with live HP cells, and (iii) it also supplies the water column with fresh and labile organic matter and it could release hydrolytic enzymes like marine snow aggregates do (Azam and Smith, 1991), while being a source of dissolved organic matter and HP in the dark ocean. TEP flushing together with diel vertical migrations of meso-zooplankton grazers may explain why the Secchi disk depth remained unchanged over decades and was considered insensitive to climate change (Falkowski and Wilson, 1992).
The reported observations challenge the current carbon export paradigm by providing supporting evidence for two export mechanisms: "pulsed export" and "water column flushing" not taken into account in the conventional export paradigm and still absent in the latest review on that topic (Le Moigne, 2019). Another overlooked carbon export mechanism involving dinoflagellates was recently reported by Larsson et al. (2022), further challenging the carbon export mechanism. Our study is in line with the consensus statement expressed by Cavicchioli et al. (2019), stressing the point that microorganisms that represent 90% of the ocean living biomass should not be left aside from investigations addressing interactions between ocean and global change.
New tools are needed to better characterise and quantify this pulsed export as well as the impact of strong wind events triggering a huge particle flushing throughout the whole water column. An automated flow cytometer designed for high frequency observation of HPs and developed in collaboration with a dedicated company, was validated by our group (Silovic et al., 2017). It should soon be operational, opening access to the dynamics of heterotrophic microorganisms. The next objective is to make this instrument submersible and able to run through the mesopelagic layer and further down where HP are active. This objective would comply with the statement that "assessing climate change involves new ways of studying the ocean's microbes" (Marx, 2020). Meanwhile, we will undertake modelling of this mechanism that could help to quantify the reported pulsed export that is not covered by the novel Microstructure, Multiscale, Mechanistic, Marine Aggregates in the Global Ocean (M4AGO) sinking scheme, that ties ballasting mineral and particulate organic carbon (Maerz et al., 2020).
5 CONCLUSIONThe short-term (hourly scale) variation of the vertical abundance, viability and respiratory-rate distributions of heterotrophic prokaryotes (HP) in the epipelagic and mesopelagic layers revealed that: (i) the average HP cell viability for all samples was 94.8%±2.2% (n=240); (ii) the epipelagic layer exhibited a large HP abundance variability restricted to the upper 80 m; (iii) secondary peaks of HP abundance occurred in the subsurface layer (80– 150 m) temporally associated with abundance troughs in the surface layer; (iv) a large and sustained HP community was present at about 500-m depth, a layer occupied by meso-zooplankton, partially involved in diel vertical migration; (v) below 500 m, coinciding peaks of abundance and respiratory activity occurred in a non-periodic way; and (vi) the vertical distribution of HP specific activity provides evidence that the pulsed carbon export is triggered in the epipelagic layer. This export may aggregate additional HP and suspended material when crossing the (400–500 m) layer occupied by meso-zooplankton.
The reported observations are fully consistent with the export mechanism characterized in a mesocosm experiment to investigate TEP formation, aggregation and sinking. The first in-situ evidence of this mechanism in the absence of TEP analysis was made possible by singling out pulses of HP that colonise the TEP aggregates. This pulsed carbon export mechanism is distinct from the "Enzyme Pathway" of carbon flow, which may proceed in parallel. It is also different from the particle flushing mechanism induced by strong wind events through the whole water column. Our approach is comforted by the recent article reporting another overlooked carbon export mechanism involving dinoflagellates that cannot be confused with the heterotrophic prokaryotes of the present study.
All these mechanisms deserve to be further investigated to be quantified and to refine carbon export estimates. At stake is the quantification of the CO2 sequestration capacity of the mesopelagic and bathypelagic layers and their respective roles in global change.
6 DATA AVAILABILITY STATEMENTThe datasets generated and/or analyzed during the current study are available from the corresponding author on reasonable request.
7 ACKNOWLEDGMENTWe thank the crew of the R/V Thalassa for ship operations. We thank Yunyan CHEN (MIO, IOCAS) for producing the Ocean Data View (ODV) graphs and David Nerini (MIO) for crucial Fourier analyses.
We are grateful to the chief scientist, our friend and colleague, Valérie Andersen (Laboratoire d'Océanographie, Villefranche sur mer, France), for organizing the DYNAPROC 2 cruise. She prematurely passed away in March 2007, and we affectionately dedicate this paper to her. We are particularly thankful to Roger Z. YU for the kind introduction in Chinese of our article in the Journal of Oceanology and Limnology.
8 OPEN ACCESSThis article is licensed under a Creative Commons Attribution 4.0 International License, which permits use, sharing, adaptation, distribution and reproduction in any medium or format, as long as you give appropriate credit to the original author(s) and the source, provide a link to the Creative Commons licence, and indicate if changes were made. The images or other third party material in this article are included in the article's Creative Commons licence, unless indicated otherwise in a credit line to the material. If material is not included in the article's Creative Commons licence and your intended use is not permitted by statutory regulation or exceeds the permitted use, you will need to obtain permission directly from the copyright holder. To view a copy of this licence, visit http://creativecommons.org/licenses/by/4.0/.
Electronic supplementary material
Supplementary material (Supplementary Fig.S1) is available in the online version of this article at
Andersen V J, Sardou J. 1992. The diel migrations and vertical distributions of zooplankton and micronekton in the Northwestern Mediterranean Sea. 1. Euphausiids, mysids, decapods and fishes. Journal of Plankton Research, 14(8): 1129-1154.
DOI:10.1093/plankt/14.8.1129 |
Andersen V, Goutx M, Prieur L, et al. 2009. Short-scale temporal variability of physical, biological and biogeochemical processes in the NW Mediterranean Sea: an introduction. Biogeosciences, 6(3): 453-461.
DOI:10.5194/bg-6-453-2009 |
Andersen V, Gubanova A, Nival P, et al. 2001a. Zooplankton community during the transition from spring bloom to oligotrophy in the open NW Mediterranean and effects of wind events. 2. Vertical distributions and migrations. Journal of Plankton Research, 23(3): 243-261.
DOI:10.1093/plankt/23.3.243 |
Andersen V, Nival P, Caparroy P, et al. 2001b. Zooplankton community during the transition from spring bloom to oligotrophy in the open NW Mediterranean and effects of wind events. 1. Abundance and specific composition. Journal of Plankton Research, 23(3): 227-242.
DOI:10.1093/plankt/23.3.227 |
Annane S, St-Amand L, Starr M, et al. 2015. Contribution of transparent exopolymeric particles (TEP) to estuarine particulate organic carbon pool. Marine Ecology Progress Series, 529: 17-34.
DOI:10.3354/meps11294 |
Arístegui J, Gasol J M, Duarte C M, et al. 2009. Microbial oceanography of the dark oceanos pelagic realm. Limnology and Oceanography, 54(5): 1501-1529.
DOI:10.4319/lo.2009.54.5.1501 |
Azam F, Smith D C. 1991. Bacterial influence on the variability in the ocean's biogeochemical state: a mechanistic view. In: Demers S ed. Particle Analysis in Oceanography. NATO ASI Series, Vol 27. Springer-Verlag, Berlin, Heidelberg. p. 213-236.
|
Baltar F, Arístegui J, Sintes E, et al. 2009. Prokaryotic extracellular enzymatic activity in relation to biomass production and respiration in the meso- and bathypelagic waters of the (sub)tropical Atlantic. Environmental Microbiology, 11(8): 1998-2014.
DOI:10.1111/j.1462-2920.2009.01922 |
Beauvais S. 2003. Etude des Particules Exopolymériques Transparentes (TEP) en milieu marin. Dynamique et r le dans le cycle du carbone. Thesis Université Pierre et Marie Curie - Paris VI.
|
Boyd P W, Sherry N D, Berges J A, et al. 1999. Transformations of biogenic particulates from the pelagic to the deep ocean realm. Deep Sea Research Part II: Topical Studies in Oceanography, 46(11-12): 2761-2792.
DOI:10.1016/S0967-0645(99)00083-1 |
Cavicchioli R, Ripple W J, Timmis K N, et al. 2019. Scientistso warning to humanity: microorganisms and climate change. Nature Reviews Microbiology, 17(9): 569-586.
DOI:10.1038/s41579-019-0222-5 |
Del Giorgio P A, Duarte C M. 2002. Respiration in the open ocean. Nature, 420(6914): 379-384.
DOI:10.1038/nature01165 |
Denis M, Martin V, Momzikoff A, et al. 2003. Pulsed remineralisation in the northwestern Mediterranean Sea: a hypothesis. Journal of Marine Systems, 39(1-2): 19-41.
DOI:10.1016/S0924-7963(02)00244-0 |
Engel A, Thoms S, Riebesell U, et al. 2004. Polysaccharide aggregation as a potential sink of marine dissolved organic carbon. Nature, 428(6986): 929-932.
DOI:10.1038/nature02453 |
Falkowski P G, Wilson C. 1992. Phytoplankton productivity in the North Pacific Ocean since 1900 and implications for absorption of anthropogenic CO2. Nature, 358(6389): 741-743.
DOI:10.1038/358741a0 |
Field C B, Behrenfeld M J, Randerson J T, et al. 1998. Primary production of the biosphere: integrating terrestrial and oceanic components. Science, 281(5374): 237-240.
DOI:10.1126/science.281.5374.237 |
Gasol J M, Zweifel U L, Peters F, et al. 1999. Significance of size and nucleic acid content heterogeneity as measured by flow cytometry in natural planktonic bacteria. Applied and Environmental Microbiology, 65(10): 4475-4483.
DOI:10.1128/aem.65.10.4475-4483.1999 |
Ghiglione J F, Palacios C, Marty J C, et al. 2008. Role of environmental factors for the vertical distribution (0-1000 m) of marine bacterial communities in the NW Mediterranean Sea. Biogeosciences, 5(6): 1751-1764.
DOI:10.5194/bg-5-1751-2008 |
Grégori G, Citterio S, Ghiani A, et al. 2001. Resolution of viable and membrane-compromised bacteria in freshwater and marine waters based on analytical flow cytometry and nucleic acid double staining. Applied and Environmental Microbiology, 67(10): 4662-4670.
DOI:10.1128/AEM.67.10.4662-4670.2001 |
Grégori G, Denis M, Lefèvre D, et al. 2003. Viabilité des bactéries hétérotrophes dans la baie de Marseille. Comptes Rendus Biologies, 326(8): 739-750.
DOI:10.1016/j.crvi.2003.07.001 |
Isla A, Scharek R, Latasa M. 2015. Zooplankton diel vertical migration and contribution to deep active Carbon flux in the NW Mediterranean. Journal of Marine Systems, 143: 86-97.
DOI:10.1016/j.jmarsys.2014.10.017 |
Jenkinson I R, Biddanda B A, Turley C M, et al. 1991. Rheological properties of marine organic aggregates importance for vertical flux, turbulence and microzones. Oceanologica Acta, 11: 101-107.
|
Jenkinson I R. 1986. Oceanographic implications of non-Newtonian properties found in phytoplankton cultures. Nature, 323(6087): 435-437.
DOI:10.1038/323435a0 |
Karl D M, Hebel D V, Björkman K, et al. 1998. The role of dissolved organic matter release in the productivity of the oligotrophic North Pacific Ocean. Limnology and Oceanography, 43(6): 1270-1286.
DOI:10.4319/lo.1998.43.6.1270 |
Kelly T B, Davison P C, Goericke R, et al. 2019. The importance of mesozooplankton diel vertical migration for sustaining a mesopelagic food web. Frontiers in Marine Science, 9: 508.
DOI:10.3389/fmars.2019.00508 |
Kolber Z S, Van Dover C L, Niederman R A, et al. 2000. Bacterial photosynthesis in surface waters of the open ocean. Nature, 407(6801): 177-179.
DOI:10.1038/35025044 |
Larsson M E, Bramucci A R, Collins S, et al. 2022. Mucospheres produced by a mixotrophic protist impact ocean carbon cycling. Nature Communications, 13: 1301.
DOI:10.1038/s41467-022-28867-8 |
Le Moigne F A C. 2019. Pathways of organic carbon downward transport by the oceanic biological carbon pump. Frontiers in Marine Science, 6: 634.
DOI:10.3389/fmars.2019.00634 |
Lefèvre D, Denis M, Lambert C E, et al. 1996. Is DOC the main source of organic matter remineralization in the ocean water column?. Journal of Marine Systems, 7(2-4): 281-291.
DOI:10.1016/0924-7963(95)00003-8 |
Maerz J, Six K D, Stemmler I, et al. 2020. Microstructure and composition of marine aggregates as co-determinants for vertical particulate organic carbon transfer in the global ocean. Biogeosciences, 17(7): 1765-1803.
DOI:10.5194/bg-17-1765-2020 |
Marx V. 2020. When microbiologists plunge into the ocean. Nature Methods, 17(2): 133-136.
DOI:10.1038/s41592-020-0736-9 |
Méjanelle L, Dachs J. 2009. Short scale (6 h) temporal variation of sinking fluxes of planktonic and terrigeneous lipids at 200 m in the NW Mediterranean Sea. Biogeosciences, 6(12): 3017-3034.
DOI:10.5194/bg-6-3017-2009 |
Menzel D W, Ryther J H. 1968. Organic carbon and the oxygen minimum in the South Atlantic Ocean. Deep Sea Research and Oceanographic Abstracts, 15(3): 327-337.
DOI:10.1016/0011-7471(68)90009-0 |
Mével G, Vernet M, Goutx M, et al. 2008. Seasonal to hour variation scales in abundance and production of total and particle-attached bacteria in the open NW Mediterranean Sea (0-1000 m). Biogeosciences, 5(6): 1573-1586.
DOI:10.5194/bg-5-1573-2008 |
Packard T T, Berdalet E, Blasco D, et al. 1996. Oxygen consumption in the marine bacterium Pseudomonas nautica predicted from ETS activity and bisubstrate enzyme kinetics. Journal of Plankton Research, 18(10): 1819-1835.
DOI:10.1093/plankt/18.10.1819 |
Packard T T, Christensen J P. 2004. Respiration and vertical carbon flux in the Gulf of Maine water column. Journal of Marine Research, 62(1): 93-115.
DOI:10.1357/00222400460744636 |
Packard T T, Denis M, Rodier M, et al. 1988. Deep-ocean metabolic CO2 production: calculations from ETS activity. Deep Sea Research Part A. Oceanographic Research Papers, 35(3): 371-382.
DOI:10.1016/0198-0149(88)90016-7 |
Packard T T, Williams P J Le B. 1981. Rates of respiratory oxygen consumption and electron transport in surface seawater from the Northwest Atlantic. Oceanologica Acta, 4(3): 351-358.
|
Packard T T. 1971. The measurement of respiratory electrontransport activity in marine phytoplankton. Journal of Marine Research, 29: 235-244.
|
Passow U, Alldredge A L, Logan B E. 1994. The role of particulate carbohydrate exudates in the flocculation of diatom blooms. Deep Sea Research Part I: Oceanographic Research Papers, 41(2): 335-357.
DOI:10.1016/0967-0637(94)90007-8 |
Passow U. 2002. Transparent exopolymer particles (TEP) in aquatic environments. Progress in Oceanography, 55(3-4): 287-333.
DOI:10.1016/S0079-6611(02)00138-6 |
Raybaud V, Nival P, Mousseau L, et al. 2008. Short term changes in zooplankton community during the summer-autumn transition in the open NW Mediterranean Sea: species composition, abundance and diversity. Biogeosciences, 5(6): 1765-1782.
DOI:10.5194/bg-5-1765-2008 |
Savenkoff C, Lins da Silva N, Lefèvre D, et al. 1992. Contribution of the different planktonic microbial assemblages to ETS activity in the Ligurian frontal area: north-west Mediterranean Sea. Journal of Plankton Research, 14(6): 835-850.
DOI:10.1093/plankt/14.6.835 |
Savenkoff C, Prieur L, Reys J P, et al. 1993. Deep microbial communities evidenced in the Liguro-Provencal front by their ETS activity. Deep Sea Research Part I: Oceanographic Research Papers, 40(4): 709-725.
DOI:10.1016/0967-0637(93)90067-D |
Shapiro H M. 2003. Practical Flow Cytometry. 4th edn. Wiley, Hoboken, NJ. 736p.
|
Silovic T, Grégori G, Dugenne M et al. 2017. A new automated flow cytometer for high frequency in situ characterisation of heterotrophic microorganisms and their dynamics in aquatic ecosystems. In: Proceedings IMEKO International Conference on Metrology for the Sea. Naples, Italy. p. 58-61.
|
Smith D C, Simon M, Alldredge A L, et al. 1992. Intense hydrolytic enzyme activity on marine aggregates and implications for rapid particle dissolution. Nature, 359(6391): 139-142.
DOI:10.1038/359139a0 |
Smriga S, Fernandez V I, Mitchell J G, et al. 2016. Chemotaxis toward phytoplankton drives organic matter partitioning among marine bacteria. Proceedings of the National Academy of Sciences of the United States of America, 113(6): 1576-1581.
DOI:10.1073/pnas.1512307113 |
Stemmann L, Picheral M, Gorsky G. 2000. Diel variation in the vertical distribution of particulate matter (> 0.15 mm) in the NW Mediterranean Sea investigated with the Underwater Video Profiler. Deep Sea Research Part I: Oceanographic Research Papers, 47(3): 505-531.
DOI:10.1016/S0967-0637(99)00100-4 |
Verdugo P, Alldredge A L, Azam F, et al. 2004. The oceanic gel phase: a bridge in the DOM-POM continuum. Marine Chemistry, 92(1-4): 67-85.
DOI:10.1016/j.marchem.2004.06.017 |
Williams P J Le B. 1981. Microbial contribution to overall marine plankton metabolism: direct measurements of respiration. Oceanologica Acta, 4: 359-364.
|
Zhao Y C, Zhao Y, Zheng S, et al. 2020. Virioplankton distribution in the tropical western Pacific Ocean in the vicinity of a seamount. Microbiology Open, 9(6): 1207-1224.
DOI:10.1002/mbo3.1031 |