 2023, Vol. 41
Institute of Oceanology, Chinese Academy of Sciences
Article Information
- LU Yuxi, PAN Dawei, YANG Tingting, WANG Chenchen
- Distribution characteristics and controlling factors of typical heavy metals in Huanghe River estuary, China
- Journal of Oceanology and Limnology, 41(1): 150-165
- http://dx.doi.org/10.1007/s00343-021-1320-6
Article History
- Received Sep. 30, 2021
- accepted in principle Nov. 28, 2021
- accepted for publication Jan. 5, 2023


2 CAS Key Laboratory of Coastal Environmental Processes and Ecological Remediation, Shandong Key Laboratory of Coastal Environmental Processes, Research Center for Coastal Environment Engineering Technology of Shandong Province, Yantai Institute of Coastal Zone Research, Chinese Academy of Sciences, Yantai 264003, China;
3 University of Chinese Academy of Sciences, Beijing 100049, China;
4 College of Chemistry and Chemical Engineering, Yantai University, Yantai 264005, China
Rivers carry 90% of the terrestrial material transported to the ocean every year, including many anthropogenic pollutants, such as heavy metals (HMs) (Meybeck and V r smarty, 2005; Viers et al., 2009; Ahmad et al., 2020; Lu et al., 2020; Muhammad and Ahmad, 2020; Amin et al., 2021; Muhammad et al., 2021; Muhammad and Usman, 2021). In general, the distributions of heavy metals are controlled by the metal budgets and associated external forcings (Li et al., 2020). River discharge provides abundant metals and other pollutants that likely promote water pollution (Xie and Wang, 2020; Niu et al., 2021). In addition, tidal currents control sediment flocculation, which largely influences the adsorption mechanism of metals (Laing et al., 2008). Due to its environmental persistence, biogeochemical recycling and metal toxicity, it may pose a significant risk to the sinks of HMs of the aquatic ecosystems in estuaries and coastal areas (Liu et al., 2019a; Pan et al., 2020). However, due to the influence of human activities, the natural runoff and sediment loading process of the river, as well as the biogeochemical cycle of many metals involved, have been significantly disturbed (Biemans et al., 2011; Bi et al., 2014). These changes may have a significant impact on the flux of pollutants transported by rivers to the ocean and have a profound impact on the fragile ecological environment of estuaries and coastal systems (Liu et al., 2019b).
Traditional dissolved HMs research mostly used membrane filtration technology to simply divide water samples into dissolved and particulate samples (Wang et al., 2018), but this ignored an important part of the colloidal phase in the dissolved pool, which has been proven to be an important existence form for HMs in recent years (Waeles et al., 2008; Liu et al., 2018; Lu et al., 2021). Colloids are generally defined as having a size in the range of 1 nm to 1 mm, composed of small particles that are not easily affected by gravity (Guo and Santschi, 2007). These particles mainly include metal oxides, hydroxides, carbonates, humic acids, proteins, bacteria, and viruses (Filella, 2007). Due to its large specific surface area, it exposes a variety of reactive coordination sites, so the colloid can adsorb a large number of metals in the water environment (Vignati and Dominik, 2003; Lu et al., 2019). Therefore, colloids are considered to play a key part in controlling the form and circulation of many trace metals in water systems (Liu et al., 2013). In particular, colloids may also be the main cause of chemical fractionation in the process of river-sea mixing and the downward metal transportation in coastal and estuarine waters (Guo and Santschi, 2007; Lu et al., 2020). Natural colloids in water system can be separated by a variety of techniques, including capillary electrophoresis, gel techniques, field flow fractionation, ultrafiltration, and centrifugation (Rigol et al., 1994; Holm et al., 1995; Xu et al., 2018a, b, c; Lu et al., 2019). Ultrafiltration has been proven to be effective for studying colloidal metals in freshwater, seawater and estuarine water (Burba et al., 1998). This low-cost and easy-to-implement colloidal separation technique is also one of the few separation techniques that do not require auxiliary reagents (Markus et al., 2018; Lu et al., 2021).
In this study, Zn, Cd and Pb size distributions in the mixing area of the Huanghe (Yellow) River estuary (HRE) were reported. An important reason for the selection of this system is that it is susceptible to human disturbance and is a classic high sedimentation estuary (Lin et al., 2016). It also takes into account the understanding of the behavior of trace metals in this system in existing studies (Qiao et al., 2007; Wang et al., 2018). An originality of this study lies in the xamination of five dissolved fractions, while previous studies are usually considered to be two or three factions (Waeles et al., 2008). The metals collected and evaluated in the same survey included Cu and Fe, etc. However, compared to Zn, Cd, and Pb, which are considered to be highly related to aquatic biological risk, the characteristics of Cu being both a nutrient and HM have been evaluated in our recent research (Lu et al., 2021). Therefore, the primary purpose is to evaluate the effect of using centrifugal ultrafiltration (CFU) combined with acid extraction to separate and measure colloidal trace metals. The objective of this study is to assess the status of Zn, Cd, and Pb as HM and the resulting ecological risks in the HRE and the changes in the colloidal distributions.
2 MATERIAL AND METHOD 2.1 Study areaThe Huanghe River is located in a mid-latitude arid/semi-arid region, and it is also the largest river flowing into the sea from the Bohai Sea in China (Tang et al., 2010). The Huanghe River estuary is not only a key zone for the interaction of runoff, sediment and ocean dynamics but also a migratory site for a variety of fish and a spawning ground for aquatic animals (Wang et al., 2018). Besides, the Huanghe River Delta has abundant oil and gas resources, including Shengli Oilfield. The Huanghe River flows through the Loess Plateau and is known for its high turbidity (Wang et al., 2016). The average annual sediment volume into the sea was about 1.08×10⁹ t, second only to the Amazon River, but the average annual runoff (~5.8×10¹⁰ m3) into the sea was less than 1% of the Amazon River (Wang et al., 2011; Chen et al., 2020). Historically, the Huanghe River transported about 5.74×10¹⁰ m3 of freshwater (corresponding approximately 50%–60% of freshwater entering the Bohai Sea) and 90% of sediment entering the Bohai Sea annually (Qiu et al., 2017). Under the influence of shear peaks and estuary dynamics, more than 80% of the sediment settled in the area near the estuary, which accelerated the siltation of the Huanghe River Delta to the sea, with an average annual siltation area of 25 km2. The violent sedimentation of the Huanghe River estuary formed a sand block in the estuary area, which affected the material transport process (Zhang et al., 2021). At present, the main factor affecting the amount of sediment and water in the Huanghe River is not rainfall, but human activities, which makes it no longer a true "natural" river (Zhang et al., 2020). Briefly, the potential sources of HMs are both from the natural geochemical weathering of rocks and soil and human-induced sources such as industrial production, mineral mining and agricultural fertilization (Jia et al., 2020; Zhao et al., 2020). Among them, HMs, especially Zn, Cd, and Pb, in water and sediments caused by agricultural fertilization and industrial production are the important category of human-induced pollution in the estuarine area (Lu et al., 2019; Niu et al., 2021).
2.2 Sampling and pre-filtrationIn July 2020 (wet season of the Huanghe River), surface samples (1-m deep) from 10 sampling sites were collected from the nearshore to offshore areas (37°55′N–38°00′N and 119°10′E–119°20′E) in Fig. 1 (the red box). These sample sites were distributed from the estuary to the Bohai Bay and divided into different regions according to the geographical location and the direction of water diffusion. According to the Specification for Oceanographic Survey of China (GB17378- 2007) and our previous research (Lu et al., 2020), all vessels used for sampling of the surface seawater were sequentially soaked in 1.50-mol/L HNO3 and 1.20-mol/L HCl for 2 d, then rinsed by ultra-pure water (UPW; 18.2 MΩ-cm specific resistance), and the sampling bottles were packed with zip-lock polyethylene bags. The self-designed rod-type sampling technique was used for sampling, and internal-fluorinated high-density polyethylene (HDPE) bottles were used as the sample container. The specific details follow the research of Lu et al. (2020), and the details are not repeated here. The sample collected was sealed and refrigerated (at ~4 ℃) during the transport to the laboratory.

|
| Fig.1 Map of the study location and sampling sites in the HRE |
According to previous studies, pre-filtration after water sample collection must avoid any potential background contamination. Therefore, the fully enclosed filtration technology introduced by Lu et al. (2020) was used for sample pre-filtration, and the specific details are not be described here, but it should be noted that all samples must be filtered within four hours after collection. Water temperature, salinity, pH, and DO were determined using an YSI (Yellow Springs Instrument, USA) sensor. All samples were stored at 4 ℃ until analysis within 2 weeks.
2.3 CFUThe CFU technology has proven its high efficiency in separating hydrocolloid substances in many previous studies (Xu and Guo, 2017; Lu et al., 2021). In this study, the pre-separation of trace metals in water samples from 10 stations in the HRE was carried out by using techniques modified from Xu and Guo (2017). First, in the order of UPW, 0.05-mol/L NaOH, UPW, 0.02-mol/L HCl, and UPW, the Macrosep® CFU equipment with molecular weight cut-off values of 1, 3, 10, and 100 kDa were washed for 5–10 times to remove the possible background. Then, 15 mL of water sample was added and centrifuged at 4 000×g centrifugal force at 4 ℃ for 50–60 min to separate the water sample to dryness and protect it from light during the whole process. After centrifugation, the ultrafiltrate was fully acid-extracted with 0.50-mol/L HNO3 and diluted to 10 mL to complete the extraction of Zn, Cd, and Pb in the dissolved state, and the final detection was performed by an inductively coupled plasma mass spectrometer (ICP-MS, ELAN DRC II, USA). The calculation of each colloidal metal fraction follows the formula of the difference between the initial concentration and each ultrafiltrate, as introduced by Xu and Guo (2017). Based on the above operations and calculations, the entire dissolved Zn, Cd, and Pb concentrations can be divided into > 100 kDa–0.45 μm, 10–100 kDa, 3–10 kDa, and 1–3-kDa fractions and < 1-kDa truly dissolved phase. The calculation method for the recovery of each CFU device has been reported in our previous study (Lu et al., 2020), so it will not be repeated in this paper.
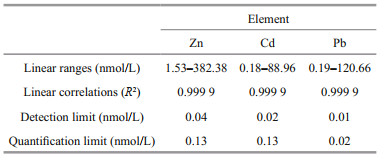
2.4 Sample analysis and error controlZn, Cd, and Pb were analyzed by using ICP-MS. Due to its high resolution and lower detection limit, ICP-MS has proven to be a powerful tool for an accurate multi-element analysis over a wide range of concentrations in seawater, especially colloidal metals (Liu et al., 2019a; Lu et al., 2019). The instrument was calibrated using multi-element standards that were acidified and diluted with 0.50-mol/L HNO3. Blank samples were processed 11 times in parallel, using the method of Lu et al. (2020), and then measured by ICP-MS to obtain the blanks. The drift of the standard curve caused by the operation of the instrument was eliminated by the correction of the curves every 30 samples. The remaining data were taken from three parallel experiments to eliminate interference. The detection limits (LOD) for the three metals were calculated based on 3σ (three times of the standard deviation of the blanks, n=11), and the quantification limits were 10 times of the σ (Table 1).
The CF was applied for the evaluation of water quality in the current study (Wang et al., 2018). The CF value reflects the pollution level of a single HM and overall trace metals in the media, respectively.
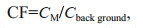
where Cback ground is the quality standard background value of corresponding metal in seawater, CM is total dissolved (TD) concentration of corresponding metal. Due to the lack of background data on all the HMs studied in HRE, the background concentrations were used the grade-one seawater quality standard issued by Administration of Quality Supervision, Inspection and Quarantine of China instead (i.e., 305.90-nmol/L Zn, 8.90-nmol/L Cd, 4.83-nmol/L Pb; GB 3097-1997) (State Environmental Protection Administration, 1997). The CFs of seawater standards and the samples were summarized in Table 2.
The average concentration of TD Zn, Cd, and Pb in the surface water of HRE and the corresponding CF value distribution are shown in Fig. 2. The TD Zn, Cd, and Pb concentrations ranged within 200.10–321.66, 2.58–4.05, and 0.48–1.04 nmol/L, respectively, with the averages of 249.51, 3.35, and 0.77 nmol/L, respectively. The lowest concentration of TD Zn was found at site 3, followed by that found in sites 6 and 7, and the highest concentration was found at site 1, followed by that found in sites 2 and 9. As for the TD Cd, the highest concentration was found at site 8, followed by that found in sites 1 and 6, and the lowest concentration was found at site 10, followed by that found in sites 5 and 7. The concentrations of different sampling sites of TD Pb followed (in decreasing order): 6 > 7 > 10 > 1 > 8 > 2≈3 > 5≈9 > 4. Obviously, the three target metals showed different behaviors in the spatial pattern. The highest concentration of TD Zn appeared in the nearshore site, and it showed the character that the west was higher than the east side, which may be attributed to the impact of the nearshore currents (Lu et al., 2021). Similar to TD Zn, TD Cd appeared the similar characteristic that the west concentration is higher than the east, but the difference was that the highest value points appear in the offshore area, which may be associated with the Cd supplementation in the corresponding area (Waeles et al., 2008; Lu et al., 2020). The higher value of TD Pb concentration was concentrated in the central region, indicating that the phenomenon of Pb addition with moderate salinity existed in the HRE, which was similar to the result of Lu et al. (2020) in the Xinan River. In addition, the coastal current may has little impact on the environmental behavior of TD Pb in the HRE.

|
| Fig.2 Concentration distribution and CF of Zn, Cd, and Pb in the TD phase of the samples |
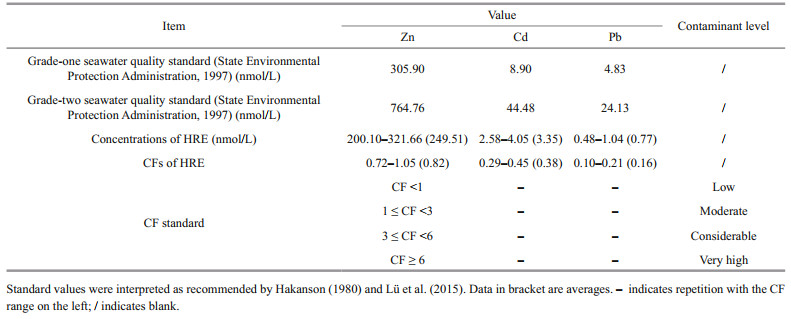
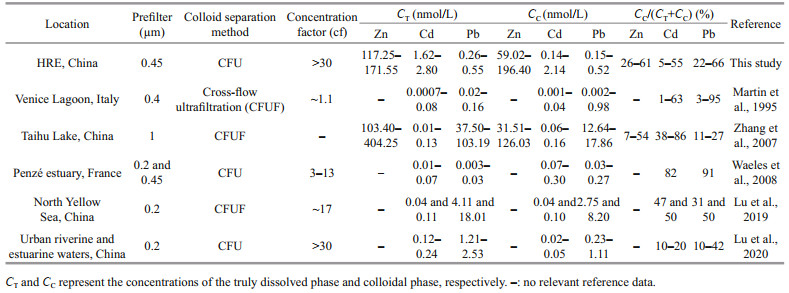
We compared the corresponding results with other estuaries (Table 3) and found that the TD Zn concentrations in the HRE were close to that of the similar area in Wang et al. (2018) (30.13– 645.46 nmol/L) and the Zhujiang (Pearl) River estuary (207.10 nmol/L) (Zhang et al., 2012), but higher than that of Port Jackson (50.02–147.75 nmol/L) (Hatje et al., 2003); the concentrations of TD Cd were higher than that of the Zhujiang River estuary (0.01– 2.67 nmol/L) (Zhang et al., 2012) and the Venice Lagoon (0.01–0.13 nmol/L) (Martin et al., 1995), but lower than that of the similar area in Tang et al. (2010) (0.89–28.64 nmol/L) and Wang et al. (2018) (0.89– 16.90 nmol/L); TD Pb, due to the application of the clean sampling method and the filter device, the Pb concentration was relatively lower than the study of Tang et al. (2010) in the similar area, only higher than Venice Lagoon (0.05–1.08 nmol/L) and Port Jackson (0.03–0.50 nmol/L).
|
The summary of the CFs of the seawater standards and the sampling sites is shown in Table 2. In the HRE, each concentration of TD Cd and Pb was lower than the grade-one standard of the GB 3097-1997, and the CFs ranged from 0.29–0.45 of Cd (average ~0.4) and 0.10–0.21 of Pb (average ~0.2), respectively, which indicated low contaminant level. For the TD Pb, only the CF value of site 1 exceeded the moderate contaminant level, while the CF values of the remaining sites were all < 1. The obtained CF values were lower than that of the previous result of Wang et al. (2018) in the similar area. This difference in contamination level between different studies may be caused by multiple reasons. First of all, the clean sampling techniques and filtering methods used in this study may effectively reduce the possible background pollution (Li et al., 2015). In addition, the strong hydrodynamics and seasonal differences in the study area may have a significantly impact on the results (Lu et al., 2021).
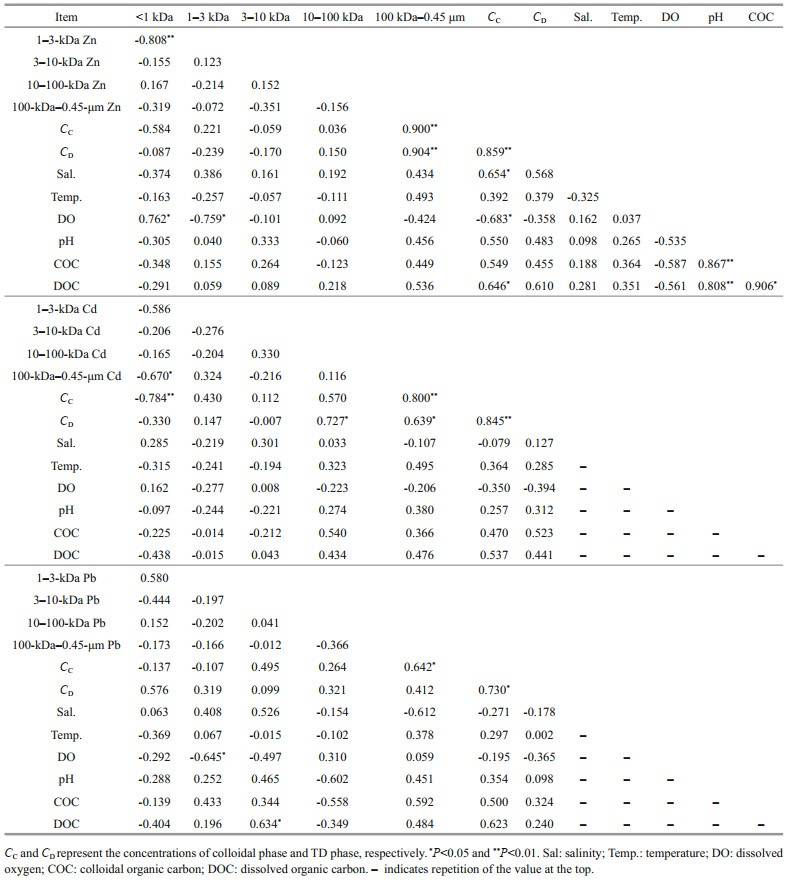
3.3 Characteristics of colloidal size distributionsA preliminary discussion of the results was arried out by comparing the contributions of both the truly dissolved phase and the colloidal fractions to that of the TD metal. The results of the concentrations for each molecular weight are shown in Figs. 3–5 and the percentages are shown in Fig. 6. For the sake of comparison, concentrations and percentages of target metals in collected samples and other aquatic systems are shown in Table 4. The Pearson correlation matrix for physicochemical parameters and Zn, Cd, and Pb concentrations is shown in Table 5.

|
| Fig.3 Concentration distribution of Zn in the dissolved fractions of the samples > 100 kDa and > 1 kDa represent the concentrations of 100-kDa–0.45-μm fraction and colloidal phase, respectively. |

|
| Fig.4 Concentration distribution of Cd in the dissolved fractions of the samples > 100 kDa and > 1 kDa represent the concentrations of 100-kDa–0.45-μm fraction and colloidal phase, respectively. |

|
| Fig.5 Concentration distribution of Pb in the dissolved fractions of the samples > 100 kDa and > 1 kDa represent the concentrations of 100 kDa–0.45 μm fraction and colloidal phase, respectively. |

|
| Fig.6 Percentage distribution of Zn, Cd, and Pb in the dissolved fractions of the samples > 100 kDa represent the concentration of 100-kDa–0.45-μm fraction. |
|
|
The results indicate that < 1-kDa fraction was the most predominant pool with the average concentration of 150.51 nmol/L in the HRE followed by 100-kDa– 0.45-μm fraction (63.61 nmol/L), 10–100-kDa fraction (12.10 nmol/L), and 1–3-kDa fraction (11.94 nmol/L). 3–10-kDa fraction concentration was the lowest with the mean values of 11.35 nmol/L in the HRE. In terms of percentages (Fig. 6), the corresponding values of colloidal Zn were 61% in the < 1-kDa fraction, 5% in the 1–3-kDa fraction, 5% in the 3–10-kDa fraction, 5% in the 10–100-kDa fraction, and 24% in the 100-kDa–0.45-μm fraction.
Figure 3 shows the spatial variations of TD Zn and its fractions. During the investigation, the lowest concentrations of < 1-kDa, 1–3-kDa, 3–10-kDa, and 10–100-kDa fractions were all observed in the Sites 6 and 7 except for the TD phase and 100-kDa–0.45-μm fraction in Site 3 near the Huanghe River mouth. The high values of TD phase and 100-kDa–0.45-μm fraction were recorded in the Huanghe River mouth (Site 1), while relatively higher concentrations of 1–3-kDa Zn occurred in the middle area, which was similar to the distributions of 3–10 kDa. In addition, the < 1-kDa and 10–100-kDa Zn in the nearshore site were significantly higher than those in the offshore area. In addition, the results suggest that < 1-kDa Zn was the main form of TD Zn, which was consistent with other study, such as Zhang et al. (2007). In terms of colloidal Zn, overall, their concentrations (59.02– 196.40 nmol/L) and percentages (26%–61%) were higher than that observed in Taihu Lake (Table 4).
3.3.2 CdThe 1–3-kDa, 3–10-kDa, and 10–100-kDa concentrations in the surface water ranged from 0 to 0.74, 0 to 0.41, and 0 to 0.95 nmol/L, respectively, with the lowest values being observed at Site 1 for 1–3 kDa, Site 9 for 3–10 kDa, and Site 3 for 10–100 kDa, and the highest values being found in Site 6, Site 2, and Site 8. For < 1-kDa and 100-kDa–0.45-μm high-molecular-weight (HMW) fraction, the corresponding values varied from 1.62 to 2.80 and 0.01 to 1.28 nmol/L; the lowest and highest values appeared at Site 3 and Site 5 for < 1 kDa, and Site 5 and Site 1 for 100 kDa–0.45 μm. For the percentages, the corresponding values of Cd in the five fractions (i.e., < 1 kDa, 1–3 kDa, 3–10 kDa, 10–100 kDa, and 100 kDa–0.45 μm) were 45%–95%, 0–21%, 0–13%, 0–24%, and 0.4%–34%, with the mean values of 62%, 6%, 4%, 7%, and 21%, respectively.
In comparison with the information listed in Table 4, specifically, the colloidal Cd concentrations were higher than those observed in the Venice Lagoon (Martin et al., 1995), the North Yellow Sea (Lu et al., 2019), the Taihu Lake (Zhang et al., 2007), the Urban riverine and estuarine waters (Lu et al., 2020), and the Penzé estuary (Waeles et al., 2008), while percentages were lower than those in the Taihu Lake (Zhang et al., 2007), the North Yellow Sea (Lu et al., 2019), and Penzé estuary (Waeles et al., 2008).
3.3.3 PbFor the studied sites of the HRE, the < 1-kDa fraction varied from 0.26 to 0.55 nmol/L with an average of 0.38 nmol/L, the 1–3-kDa fraction ranged from 0.01 to 0.10 nmol/L with an average of 0.05 nmol/L, and the 3–10-kDa fraction varied from 0 to 0.21 nmol/L with an average of 0.07 nmol/L. For those of the > 10 kDa, the corresponding ranges of 10–100 kDa and 100 kDa–0.45 μm were 0–0.26 and 0.03–0.40 nmol/L, respectively, with their respective averages of 0.06 and 0.22 nmol/L. The percentage contributions of each dissolved fraction to TD phase varied in the ranges of 34%–78% < 1 kDa, 1%–15% 1–3 kDa, 0–29% 3–10 kDa, 0–30% 10–100 kDa, and 4%–51% 100 kDa–0.45 μm with the average values of 50%, 6%, 9%, 7%, and 28%, respectively.
Compared with other studies (Table 4), dissolved Pb values in this study were lower than those found in the Taihu Lake (Zhang et al., 2007), the Urban riverine and estuarine waters (Lu et al., 2020), and the North Yellow Sea (Lu et al., 2019), but higher than those of the Penzé estuary (Waeles et al., 2008). The percentage results indicate that Penzé estuary (Waeles et al., 2008) was the highest system with the average of 91% followed by the Venice Lagoon (3%–95%, Martin et al., 1995), the HRE (22%–66%, this study), the North Yellow Sea (31% and 50%, Lu et al., 2019), the Urban riverine and estuarine waters (10%–42%, Lu et al., 2020) and Taihu Lake (11%–27%, Zhang et al., 2007).
3.4 Dynamic metal behaviors along the river-sea mixing zone 3.4.1 ZnAlthough the strong hydrodynamic force in the HRE makes data change drastically, it is instructive to analyze the metal behavior of each fraction in the entire spatial distribution. Figures 3–5 indicate that each fraction and entire colloidal phase of three metals had non-conservative behaviors, although deviations from linearity are likely to occur in the HRE (Lu et al., 2021).
For Zn, 1 kDa–0.45 μm (1–3, 3–10, 10–100 kDa, and 100 kDa–0.45 μm) and > 100 kDa fractions showed similar distribution, both showing the characteristics of nearshore higher than the offshore area, which is consistent with the result that > 100-kDa colloids dominate the entire colloidal state (Fig. 3). Generally, the macromolecular colloids could be extracellular polysaccharides or newly released HMW intracellular biomolecules (e.g., peptidoglycans and proteins), or refractory humic aggregates (Lee et al., 1996; Hung et al., 2001; Lead and Wilkinson, 2006). 1–3-kDa and 10–100-kDa Zn exhibited similar behavior, that is, first increased and then decreased (Fig. 3b & d). This Zn addition may ensue from different processes: direct sediment porewater infusion (Petersen et al., 1995) or desorption from suspended particles (Lu et al., 2020). Besides, complexing ligands addition from the sediment may result in a metal enrichment, which is more likely to occur in moderate salinity regions (Skrabal et al., 1997). On the contrary, 3–10 kDa showed a different behavior from other fractions, and its concentration fluctuations were relatively large. According to the research of Santos-Echeandia et al. (2008) in the San Simon Inlet mixing zone, the behavior of strong ligands in the estuary area and the competitive ligand equilibration may have a great influence on the addition of metals, so the release of small molecules of Zn in the HRE was found as strongly complexed processes. For the < 1-kDa Zn, it was mainly characterized by the near-shore concentration lower than the offshore area (Fig. 3a). Combined with the results of the higher concentrations of colloidal Zn in near-shore sites, it indicated that the size (or molecular weight) of Zn in the HRE gradually decreased along the direction from the river to the sea.
3.4.2 CdDissolved Cd usually takes the more stable and soluble chlorine complex as the main form in the estuary system (Dai and Martin, 1995; Waeles et al., 2008). The study by Waeles et al. (2005) in Penzé estuary confirmed that low molecular weight (LMW, < 300 kDa) colloids were easily transformed from the particle-desorbed state to the stable chlorine complex from the river to the sea, which explained the similar behavior of 3–100 kDa (3–10 kDa and 10–100 kDa) Cd (Fig. 4c–d). As shown in Figs. 4c & 6, 3–10-kDa Cd was always at a relatively stable level (with an average percentage of ~4%), whereas the 1–3 kDa and 10–100-kDa Cd was opposite (0%–21% and 7%– 24%, respectively). For example, 10–100-kDa Cd was constantly increasing with salinity gradient, and the percentage of variation varies from 0% to 24%, and larger than that of the other two LMW fractions (1–3 kDa and 3–10 kDa), indicating that this fraction may dominate the LMW Cd migration in the HRE. Contrary to the LMW colloid, although Low-intensity addition appears in the middle area, the HMW Cd was generally in a removal process (Fig. 4e). However, > 100-kDa Cd occupied most of the colloid fraction (~12%), and its behavior may play a key role in the biogeochemical cycle of TD Cd. From the perspective of 1-kDa–0.45-μm colloidal Cd, its behavior presented an unstable and fluctuating process (Fig. 4f). Studies have found that the geochemical behavior of LMW colloidal Cd was more active, and stable phases may be difficult to form in the study area because of the competitive behavior between the colloid and particulate (Gerringa et al., 1996; Lu et al., 2020).
3.4.3 PbThe concentration of colloidal Pb was at a lower level in compared aquatic systems (Table 4), but its high proportion in the dissolved pool proved its key role in the Pb geochemical behavior. But different from Zn and Cd, except for site 10, > 3 kDa and colloidal Pb showed low-strength removal phenomenons (Fig. 5c–f). These results are in accordance with the observations of Lu et al. (2020) who found a decrease of the colloidal Pb proportion along the salinity gradient of the Guangdang and Xinan estuarine waters. Pb is mainly related with Fe-oxides in many aquatic systems indicates, as suggested by Wen et al. (1999) and Lu et al. (2020), that the behavior of colloidal Pb may be ruled by coagulation/flocculation of Fe (e.g. oxides or sulphides) during the river-sea mixing process.
3.5 Influence of environmental factors on distribution of dissolved metalsEnvironmental factors (e.g., temperature, salinity, DOC, colloidal organic carbon (COC), pH, and DO) may have a great impact on the transformation and migration of aquatic metals in water systems (Lu et al., 2021). For example, the increase in salinity may promote the flocculation of colloids, while the dissolved oxygen and temperature may affect the growth of phytoplankton and thus affect the levels of DOC and COC in the water system (Benoit et al., 1994; Stolpe et al., 2013; Lu et al., 2020). Therefore, the Pearson correlation test was used to determine the correlation coefficients among environmental factors and dissolved Zn, Cd, and Pb.
The influence of drastic changes in salinity in the estuary area on the migration of trace metals has been reported in many previous studies (Byrne and Yao, 2000; Lu et al., 2020). In the HRE, as shown in Table 5, colloidal Zn was significantly positively correlated with salinity (R=0.654, P < 0.05), which indicates that the increase in salinity has a significant promoting effect on the formation of colloidal Zn. However, each fraction of Cd and Pb showed indications of non-conservative behaviors (Fig. 7b–c). Generally, as the salinity increases, carbohydrates tend to form a colloidal system with a network structure in a high-salt system (Liu et al., 2019a). This may cause the colloid to tend to the stable binding state of macromolecules after flocculation, which is consistent with the results of 100-kDa–0.45-μm Zn dominates the colloidal state (Langendorff et al., 2000; Guo et al., 2009). For the DO, there were significant positive linear relationships between DO and < 1-kDa Zn (R=0.762, P < 0.05) and significant negative linear relationships between DO and 1–3-kDa Zn (R=-0.759, P < 0.05), colloidal Zn (R=-0.683, P < 0.05) and 1–3-kDa Pb (R=-0.645, P < 0.05). The colloidals in the < 50-kDa fraction may correspond to newly realized peptides (such as phytochelatins) or humus/fulvic acid compounds (Waeles et al., 2008), which is consistent with the result that 3–10-kDa Pb is significantly positively correlated with DOC (R=0.634, P < 0.05). Dissolved organic matter is ubiquitous and plays a critical role in the aquatic organic carbon cycle, biogeochemical processes, as well as dissolved metal migration (Yamashita et al., 2013; Watanabe and Kuwae, 2015; Lu et al., 2021). DOC, as a significant component, is a crucial indicator for exploring the relationship between organic matter and metal behavior (Liu et al., 2019a). In the HRE, only 1-kDa–0.45-μm colloidal Zn in situ were significant correlated with DOC based on all data (R=0.646, P < 0.05) (Fig. 7d). This indicated that DOC played a dominant role in seasonal variations of colloidal Zn, which explained 26%–61% of their variability. However, no significant correlation between each dissolved fraction of three metals and pH, temperature, and COC was found in this study.

|
| Fig.7 Scatter plots of the salinity, DOC, COC, temperature, DO, and pH vs. dissolved Zn, Cd, and Pb |
This research aimed to study the biogeochemical processes of < 1 kDa truly dissolved, colloidal and TD Zn, Cd, and Pb in the mixing area of the HRE, China. The water qualities of TD Zn, Cd and Pb were examined, and the size spectrum, mixing behavior, and the relationship between environmental parameters and target metals were evaluated. The concentrations of colloidal Zn, Cd and Pb in the surface water of the HRE were at a relatively lower level. All the CF values were all < 1 except TD Zn at station 1 (CF=1.05). Lower contaminant levels of TD Zn, Cd, and Pb were found. Most of the dissolved Zn, Cd, and Pb were distributed in the < 1-kDa fraction, followed by the 100-kDa–0.45-μm fraction. According to the changes in the spatial distribution during the mixing process, the HMW colloids in the mixing area had a higher amount of COC and DOC affected by the territorial input and sediment resuspension and so on, which provided varied colloidal substrates to the HMs in the water column, thereby accelerating the migration and transformation of metals between different fractions. Furthermore, both DO and salinity affected the LMW colloid mobility through hydrodynamic conditions. This study also focused on the significant effects of strong ligand, dissolved organic matter and coagulation/flocculation on the biogeochemistry of HMs in the estuary water of the HRE.
5 DATA AVAILABILITY STATEMENTAll data generated and/or analyzed during this study are included in this published article.
Ahmad K, Muhammad S, Ali W, et al. 2020. Occurrence, source identification and potential risk evaluation of heavy metals in sediments of the Hunza River and its tributaries, GilgitBaltistan. Environmental Technology & Innovation, 18: 100700.
DOI:10.1016/j.eti.2020.100700 |
Amin S, Muhammad S, Fatima H. 2021. Evaluation and risks assessment of potentially toxic elements in water and sediment of the Dor River and its tributaries, Northern Pakistan. Environmental Technology & Innovation, 21: 101333.
DOI:10.1016/j.eti.2020.101333 |
Benoit G, Oktay-Marshall S D, Cantu A, et al. 1994. Partitioning of Cu, Pb, Ag, Zn, Fe, Al, and Mn between filter-retained particles, colloids, and solution in six Texas estuaries. Marine Chemistry, 45(4): 307-336.
DOI:10.1016/0304-4203(94)90076-0 |
Bi N S, Yang Z S, Wang H J, et al. 2014. Impact of artificial water and sediment discharge regulation in the Huanghe(Yellow River) on the transport of particulate heavy metals to the sea. CATENA, 121: 232-240.
DOI:10.1016/j.catena.2014.05.006 |
Biemans H, Haddeland I, Kabat P, et al. 2011. Impact of reservoirs on river discharge and irrigation water supply during the 20th century. Water Resources Research, 47(3): W03509.
DOI:10.1029/2009WR008929 |
Burba P, Aster B, Nifantoeva T, et al. 1998. Membrane filtration studies of aquatic humic substances and their metal species: a concise overview: part 1. Analytical fractionation by means of sequential-stage ultrafiltration. Talanta, 45(4): 977-988.
DOI:10.1016/S0039-9140(97)00204-X |
Byrne R H, Yao W S. 2000. Formation of palladium(II) hydroxychloride complexes and precipitates in sodium chloride solutions and seawater. Geochimica et Cosmochimica Acta, 64(24): 4153-4156.
DOI:10.1016/S0016-7037(00)00501-9 |
Chen T, Liu Q S, Zheng Y, et al. 2020. Correlation patterns between magnetic parameters and heavy metals of core sediments in the Yellow River Estuary and their environmental implications. Marine Pollution Bulletin, 160: 111590.
DOI:10.1016/j.marpolbul.2020.111590 |
Dai M H, Martin J M. 1995. First data on trace metal level and behaviour in two major Arctic river-estuarine systems(Ob and Yenisey) and in the adjacent Kara Sea, Russia. Earth and Planetary Science Letters, 131(3-4): 127-141.
DOI:10.1016/0012-821X(95)00021-4 |
Filella M. 2007. Colloidal properties of submicron particles in natural waters. In: Wilkinson K J, Lead J R eds. Environmental Colloids and Particles: Behaviour, Separation and Characterisation. Wiley, Hoboken. p. 17-93, https://doi.org/10.1002/9780470024539.ch2.
|
Gerringa L J A, Poortvliet T C W, Hummel H. 1996. Comparison of chemical speciation of copper in the Oosterschelde and Westerschelde Estuaries, The Netherlands. Estuarine, Coastal and Shelf Science, 42(5): 629-643.
DOI:10.1006/ecss.1996.0041 |
Guo L D, Santschi P H. 2007. Ultrafiltration and its applications to sampling and characterisation of aquatic colloids. In: Wilkinson K, Lead J eds. Environmental Colloids and Particles: Behaviour, Separation and Characterisation. Wiley, Hoboken. p. 159-221, https://doi.org/10.1002/9780470024539.ch4.
|
Guo L, Sun C M, Li G Y, et al. 2009. Thermodynamics and kinetics of Zn(II) adsorption on crosslinked starch phosphates. Journal of Hazardous Materials, 161(1): 510-515.
DOI:10.3724/SP.J.1095.2014.40065 |
Hakanson L. 1980. An ecological risk index for aquatic pollution control a sedimentological approach. Water Research, 14(8): 975-1001.
DOI:10.1016/0043-1354(80)90143-8 |
Hatje V, Apte S C, Hales L T, et al. 2003. Dissolved trace metal distributions in Port Jackson estuary (Sydney Harbour), Australia. Marine Pollution Bulletin, 46(6): 719-730.
DOI:10.1016/S0025-326X(03)00061-4 |
Holm P E, Andersen S, Christensen T H. 1995. Speciation of dissolved cadmium: interpretation of dialysis, ion exchange and computer (GEOCHEM) methods. Water Research, 29(3): 803-809.
DOI:10.1016/0043-1354(94)00205-L |
Hung C C, Tang D G, Warnken K W, et al. 2001. Distributions of carbohydrates, including uronic acids, in estuarine waters of Galveston Bay. Marine Chemistry, 73(3-4): 305-318.
DOI:10.1016/S0304-4203(00)00114-6 |
Jia X L, Fu T T, Hu B F, et al. 2020. Identification of the potential risk areas for soil heavy metal pollution based on the source-sink theory. Journal of Hazardous Materials, 393: 122424.
DOI:10.1016/j.jhazmat.2020.122424 |
Laing G D, De Vos R, Vandecasteele B, et al. 2008. Effect of salinity on heavy metal mobility and availability in intertidal sediments of the Scheldt estuary. Estuarine, Coastal and Shelf Science, 77(4): 589-602.
DOI:10.1016/j.ecss.2007.10.017 |
Langendorff V, Cuvelier G, Michon C, et al. 2000. Effects of carrageenan type on the behaviour of carrageenan/milk mixtures. Food Hydrocolloids, 14(4): 273-280.
DOI:10.1016/S0268-005X(99)00064-8 |
Lead J R, Wilkinson K J. 2006. Aquatic colloids and nanoparticles: current knowledge and future trends. Environmental Chemistry, 3(3): 159-171.
DOI:10.1071/EN06025 |
Lee J G, Ahner B A, Morel F M M. 1996. Export of cadmium and phytochelatin by the marine diatom Thalassiosira weissflogii. Environmental Science & Technology, 30(6): 1814-1821.
DOI:10.1021/es950331p |
Li L, Liu J H, Wang X J, et al. 2015. Dissolved trace metal distributions and cu speciation in the southern Bohai Sea, China. Marine Chemistry, 172: 34-45.
DOI:10.1016/j.marchem.2015.03.002 |
Li Y Y, Gao B, Xu D Y, et al. 2020. Hydrodynamic impact on trace metals in sediments in the cascade reservoirs, North China. Science of the Total Environment, 716: 136914.
DOI:10.1016/j.scitotenv.2020.136914 |
Lin H Y, Sun T, Xue S F, et al. 2016. Heavy metal spatial variation, bioaccumulation, and risk assessment of Zostera japonica habitat in the Yellow River Estuary, China. Science of the Total Environment, 541: 435-443.
DOI:10.1016/j.scitotenv.2015.09.050 |
Liu K, Gao X L, Li L, et al. 2018. Determination of ultratrace Pt, Pd and Rh in seawater using an off-line preconcentration method and inductively coupled plasma mass spectrometry. Chemosphere, 212: 429-437.
DOI:10.1016/j.chemosphere.2018.08.098 |
Liu K, Gao X L, Xing Q G, et al. 2019a. Adsorption kinetics of platinum group elements onto macromolecular organic matter in seawater. Acta Oceanologica Sinica, 38(8): 8-16.
DOI:10.1007/s13131-019-1433-3 |
Liu M, Fan D J, Bi N S, et al. 2019b. Impact of water-sediment regulation on the transport of heavy metals from the Yellow River to the sea in 2015. Science of the Total Environment, 658: 268-279.
DOI:10.1016/j.scitotenv.2018.12.170 |
Liu R X, Lead J R, Zhang H. 2013. Combining cross flow ultrafiltration and diffusion gradients in thin-films approaches to determine trace metal speciation in freshwaters. Geochimica et Cosmochimica Acta, 109: 14-26.
DOI:10.1016/j.gca.2013.01.030 |
Lü D W, Zheng B, Fang Y, et al. 2015. Distribution and pollution assessment of trace metals in seawater and sediment in Laizhou Bay. Chinese Journal of Oceanology and Limnology, 33(4): 1053-1061.
DOI:10.1007/s00343-015-4226-3 |
Lu Y X, Gao X L, Chen C T A. 2019. Separation and determination of colloidal trace metals in seawater by cross-flow ultrafiltration, liquid-liquid extraction and ICP-MS. Marine Chemistry, 215: 103685.
DOI:10.1016/j.marchem.2019.103685 |
Lu Y X, Gao X L, Song J M, et al. 2020. Colloidal toxic trace metals in urban riverine and estuarine waters of Yantai City, southern coast of North Yellow Sea. Science of the Total Environment, 717: 135265.
DOI:10.1016/j.scitotenv.2019.135265 |
Lu Y X, Pan D W, Yang T T, et al. 2021. Spatial and environmental characteristics of colloidal trace Cu in the surface water of the Yellow River Estuary, China. Marine Pollution Bulletin, 168: 112401.
DOI:10.1016/j.marpolbul.2021.112401 |
Markus A A, Krystek P, Tromp P C, et al. 2018. Determination of metal-based nanoparticles in the river Dommel in the Netherlands via ultrafiltration, HR-ICP-MS and SEM. Science of the Total Environment, 631-632: 485-495.
DOI:10.1016/j.scitotenv.2018.03.007 |
Martin J M, Dai M H, Cauwet G. 1995. Significance of colloids in the biogeochemical cycling of organic carbon and trace metals in the Venice lagoon (Italy). Limnology and Oceanography, 40(1): 119-131.
DOI:10.4319/lo.1995.40.1.0119 |
Meybeck M, Vörösmarty C. 2005. Fluvial filtering of landto-ocean fluxes: from natural Holocene variations to Anthropocene. Comptes Rendus Geoscience, 337(1-2): 107-123.
DOI:10.1016/j.crte.2004.09.016 |
Muhammad S, Ahmad K. 2020. Heavy metal contamination in water and fish of the Hunza River and its tributaries in Gilgit-Baltistan: evaluation of potential risks and provenance. Environmental Technology & Innovation, 20: 101159.
DOI:10.1016/j.eti.2020.101159 |
Muhammad S, Ullah S, Ali W, et al. 2021. Spatial distribution of heavy metal and risk indices of water and sediments in the Kunhar River and its tributaries. Geocarto International.
DOI:10.1080/10106049.2021.1926557 |
Muhammad S, Usman Q A. 2021. Heavy metal contamination in water of Indus River and its tributaries, Northern Pakistan: evaluation for potential risk and source apportionment. Toxin Reviews.
DOI:10.1080/15569543.2021.1882499 |
National Standards of the People's Republic of China(GB17378-2007). 2007. The specification for marine monitoring (Part Ⅲ). China Standards Press, Beijing.
|
Niu L X, Cai H Y, Jia L W, et al. 2021. Metal pollution in the Pearl River Estuary and implications for estuary management: the influence of hydrological connectivity associated with estuarine mixing. Ecotoxicology and Environmental Safety, 225: 112747.
DOI:10.1016/j.ecoenv.2021.112747 |
Pan D W, Ding X Y, Han H T, et al. 2020. Species, spatialtemporal distribution, and contamination assessment of trace metals in typical mariculture area of North China. Frontiers in Marine Science, 7: 552893.
DOI:10.3389/fmars.2020.552893 |
Petersen W, Wallman K, Pinglin L, et al. 1995. Exchange of trace elements at the sediment-water interface during early diagenesis processes. Marine and Freshwater Research, 46(1): 19-26.
DOI:10.1071/mf9950019 |
Qiao S Q, Yang Z S, Pan Y J, et al. 2007. Metals in suspended sediments from the Changjiang (Yangtze River) and Huanghe (Yellow River) to the sea, and their comparison. Estuarine, Coastal and Shelf Science, 74(3): 539-548.
DOI:10.1016/j.ecss.2007.05.042 |
Qiu Z F, Xiao C, Perrie W, et al. 2017. Using Landsat 8 data to estimate suspended particulate matter in the Yellow River estuary. Journal of Geophysical Research: Oceans, 122(1): 276-290.
DOI:10.1002/2016JC012412 |
Rigol A, López-Sánchez J F, Rauret G. 1994. Capillary zone electrophoresis of humic acids. Journal of Chromatography A, 664(2): 301-305.
DOI:10.1016/0021-9673(94)87021-7 |
Santos-Echeandia J, Laglera L M, Prego R, et al. 2008. Dissolved copper speciation behaviour during estuarine mixing in the San Simon Inlet (wet season, Galicia). Influence of particulate matter. Estuarine, Coastal and Shelf Science, 76(2): 447-453.
DOI:10.1016/j.ecss.2007.07.007 |
Skrabal S A, Donat J R, Burdige D J. 1997. Fluxes of copper-complexing ligands from estuarine sediments. Limnology and Oceanography, 42(5): 992-996.
DOI:10.2307/2838904 |
State Environmental Protection Administration. 1997. Marine water quality standard (GB 3097-1997). China Environmental Press, Beijing.
(in Chinese)
|
Stolpe B, Guo L D, Shiller A M, et al. 2013. Abundance, size distributions and trace-element binding of organic and iron-rich nanocolloids in Alaskan rivers, as revealed by field-flow fractionation and ICP-MS. Geochimica et Cosmochimica Acta, 105: 221-239.
DOI:10.1016/j.gca.2012.11.018 |
Tang A K, Liu R H, Ling M, et al. 2010. Distribution characteristics and controlling factors of soluble heavy metals in the Yellow River Estuary and Adjacent Sea. Procedia Environmental Sciences, 2: 1193-1198.
DOI:10.1016/j.proenv.2010.10.129 |
Viers J, Dupré B, Gaillardet J. 2009. Chemical composition of suspended sediments in World Rivers: new insights from a new database. Science of the Total Environment, 407(2): 853-868.
DOI:10.1016/j.scitotenv.2008.09.053 |
Vignati D, Dominik J. 2003. The role of coarse colloids as a carrier phase for trace metals in riverine systems. Aquatic Sciences, 65(2): 129-142.
DOI:10.1007/s00027-003-0640-2 |
Waeles M, Riso R D, Le Corre P. 2005. Seasonal variations of cadmium speciation in the Penzé estuary, NW France. Estuarine, Coastal and Shelf Science, 65(1-2): 143-152.
DOI:10.1016/j.ecss.2005.06.002 |
Waeles M, Tanguy V, Lespes G, et al. 2008. Behaviour of colloidal trace metals (Cu, Pb and Cd) in estuarine waters: an approach using frontal ultrafiltration (UF) and stripping chronopotentiometric methods (SCP). Estuarine, Coastal and Shelf Science, 80(4): 538-544.
DOI:10.1016/j.ecss.2008.09.010 |
Wang C Y, Wang W C, He S J, et al. 2011. Sources and distribution of aliphatic and polycyclic aromatic hydrocarbons in Yellow River Delta nature Reserve, China. Applied Geochemistry, 26(8): 1330-1336.
DOI:10.1016/j.apgeochem.2011.05.006 |
Wang X Y, Zhao L L, Xu H Z, et al. 2018. Spatial and seasonal characteristics of dissolved heavy metals in the surface seawater of the Yellow River Estuary, China. Marine Pollution Bulletin, 137: 465-473.
DOI:10.1016/j.marpolbul.2018.10.052 |
Wang Y, Liu R H, Zhang Y Q, et al. 2016. Transport of heavy metals in the Huanghe River estuary, China. Environmental Earth Sciences, 75(4): 288.
DOI:10.1007/s12665-015-4908-3 |
Watanabe K, Kuwae T. 2015. How organic carbon derived from multiple sources contributes to carbon sequestration processes in a shallow coastal system?. Global Change Biology, 21(7): 2612-2623.
DOI:10.1111/gcb.12924 |
Wen L S, Santschi P, Gill G, et al. 1999. Estuarine trace metal distributions in Galveston Bay: importance of colloidal forms in the speciation of the dissolved phase. Marine Chemistry, 63(3-4): 185-212.
DOI:10.1016/S0304-4203(98)00062-0 |
Xie M, Wang W. 2020. Contrasting temporal dynamics of dissolved and colloidal trace metals in the Pearl River Estuary. Environmental Pollution, 265: 114955.
DOI:10.1016/j.envpol.2020.114955 |
Xu H C, Guo L D. 2017. Molecular size-dependent abundance and composition of dissolved organic matter in river, lake and sea waters. Water Research, 117: 115-126.
DOI:10.1016/j.watres.2017.04.006 |
Xu H C, Houghton E M, Houghton C J, et al. 2018a. Variations in size and composition of colloidal organic matter in a negative freshwater estuary. Science of the Total Environment, 615: 931-941.
DOI:10.1016/j.scitotenv.2017.10.019 |
Xu H C, Lin H, Jiang H L, et al. 2018b. Dynamic molecular size transformation of aquatic colloidal organic matter as a function of pH and cations. Water Research, 144: 543-552.
DOI:10.1016/j.watres.2018.07.075 |
Xu H C, Xu M W, Li Y N, et al. 2018c. Characterization, origin and aggregation behavior of colloids in eutrophic shallow lake. Water Research, 142: 176-186.
DOI:10.1016/j.watres.2018.05.059 |
Yamashita Y, Boyer J N, Jaffé R. 2013. Evaluating the distribution of terrestrial dissolved organic matter in a complex coastal ecosystem using fluorescence spectroscopy. Continental Shelf Research, 66: 136-144.
DOI:10.1016/j.csr.2013.06.010 |
Zhang D W, Zhang X, Tian L, et al. 2012. Seasonal and spatial dynamics of trace elements in water and sediment from Pearl River Estuary, South China. Environmental Earth Sciences, 68(4): 1053-1063.
DOI:10.1007/s12665-012-1807-8 |
Zhang H Z, Lu H Y, Zhou Y L, et al. 2021. Heavy mineral assemblages and U-Pb detrital zircon geochronology of sediments from the Weihe and Sanmen Basins: new insights into the Pliocene-Pleistocene evolution of the Yellow River. Palaeogeography, Palaeoclimatology, Palaeoecology, 562: 110072.
DOI:10.1016/j.palaeo.2020.110072 |
Zhang J L, Shang Y Z, Liu J X, et al. 2020. Improved ecological development model for lower Yellow River floodplain, China. Water Science and Engineering, 13(4): 275-285.
DOI:10.1016/j.wse.2020.12.006 |
Zhang Z P, Sun X J, Chi Q Q, et al. 2007. Contents of colloidal trace metals in Lake Taihu in spring. Environmental Chemistry, 26(2): 232-235.
(in Chinese with English abstract) |
Zhao L Y, Gong D D, Zhao W H, et al. 2020. Spatial-temporal distribution characteristics and health risk assessment of heavy metals in surface water of the Three Gorges Reservoir, China. Science of the Total Environment, 704: 134883.
DOI:10.1016/j.scitotenv.2019.134883 |