 2023, Vol. 41
Institute of Oceanology, Chinese Academy of Sciences
Article Information
- LÜ Hanghang, ZHU Jianrong, CHEN Qing, LI Ming, PAN Shunqi, CHEN Shenliang
- Impact of estuarine reclamation projects on saltwater intrusion and freshwater resource
- Journal of Oceanology and Limnology, 41(1): 38-56
- http://dx.doi.org/10.1007/s00343-021-1246-z
Article History
- Received Aug. 6, 2021
- accepted in principle Nov. 12, 2021
- accepted for publication Dec. 29, 2021


2 State Key Laboratory of Estuarine and Coastal Research, East China Normal University, Shanghai 200062, China;
3 Civil Engineering and Industrial Design, School of Engineering, Liverpool University, Liverpool L69 3GH, UK;
4 Hydro-environmental Research Centre, School of Engineering, Cardiff University, Cardiff CF24 3AA, UK
Estuaries are located throughout the world and are often economically developed, populated regions (Thia-Eng, 1993; Shi et al., 2001). Estuarine areas tend to be under pressure from population growth and land scarcity. Therefore, many reclamation projects have been implemented worldwide in estuaries undergoing rapid economic development and an increasing population. Examples include the San Francisco estuary (Nichols et al., 1986), Ems estuary (Van Maren et al., 2016), Nakdong estuary (Doornbos et al., 1986), Sydney estuary (Birch et al., 2009), Rhine and Maas estuary (Kuijpers, 1995), and Tolka estuary (Buggy and Tobin, 2006). China has been implementing reclamation projects in coastal sea areas since the 1950s (Wang et al., 2014). With the rapid expansion of coastal economy, land demand has sharply increased in China in recent decades. The total reclamation area in China reached 13 380 km2 from 1950 to 2008 (Fu et al., 2010), and an additional 2 469 km2 of reclamation projects are planned for implementation between 2012 and 2020 (Wang et al., 2014).
The Changjiang (Yangtze) River is one of the largest rivers in the world. Shanghai, located near the Changjiang River estuary and the so-called "Golden Coast", with 24 million residents, is China's largest city (from National Population Census of 2020) (Shi et al., 2001; Ma et al., 2018). With economic and industrial expansion and population growth, many reclamation projects have been implemented in the Changjiang River estuary in recent years. The major reclamation projects are shown in Fig. 1 and include the Xincun Shoal reclamation project (RP-XCS), the Qingcao Shoal reclamation project (RP-QCS), the Eastern Hengsha Shoal reclamation project (RP-EHS), and the Nanhui Shoal reclamation project (RP-NHS). The RP-XCS was completed in 2012 and blocked the southern channel of the Xincun Shoal in the North Branch, resulting in an artificial change in river topography. The RP-QCS began on June 5, 2007, and was completed in October 2010. The main accomplishment of this project was the construction of the Qingcaosha Reservoir (QCSR), which is located at the bifurcation of the North Channel and South Channel. The RP-EHS is located between the North Channel and the North Passage and started in December 2003. This reclamation project was constructed in stages and extends the length of the North Channel. The Nanhui Shoal is located on the south side of the South Passage. Construction of the RP-NHS started in March 2013 and is still ongoing.

|
| Fig.1 River regime of the Changjiang River estuary before (a) and after (b) the reclamation projects and the pathways of saltwater intrusion (arrows) The Xincun Shoal reclamation project (RP-XCS), the Qingcao Shoal reclamation project (RP-QCS), the Eastern Hengsha Shoal reclamation project (RP-EHS), and the Nanhui Shoal reclamation project (RP-NHS) are labeled in red font. Red dots are the locations of water intake for the three reservoirs, and the cross-channel sections are marked by black lines. Black dots indicate the locations of three ship measurement sites A, B, C and three buoy measurement sites Buoy 1, Buoy 2 and Buoy 3 in March 2018 in the South Passage; W (blue dot) is the location of the Chongming Weather Station. |
Previous studies indicate that estuarine reclamation projects can change the local topography and could affect hydrodynamic processes and saltwater intrusion. Han et al. (2001) found that a large-scale reservoir and river reclamation would decrease saltwater intrusion in the Qiantang River estuary. Manda and Matsuoka (2006) found that the reclamation project in the innermost part of Ariake Sound could cause the tidal currents decreased by more than 10% over a large area. Song et al. (2013) found that the reclamation project on the west coast of Korea could result in an increase in tidal amplitude. Xu (2014) found that a large-scale reclamation project would have some effects on saltwater intrusion in the Oujiang River estuary. Andrews et al. (2017) found that reclamation and other anthropogenic projects in the San Francisco estuary had effects on saltwater intrusion due to changes in estuary geometry.
The impacts of each of the reclamation projects mentioned above, such as the RP-XCS, RP-NHS and RP-EHS, on saltwater intrusion in the Changjiang River estuary were examined. For example, the RP-XCS weakened the saltwater spillover (SSO), which favors the utilization of freshwater in the South Branch (Chen and Zhu, 2014a). The RP-NHS could weaken the salinity front in the South Passage (Li and Zhu, 2015). The RP-EHS enhanced saltwater intrusion in the South Channel, North Passage and South Passage and weakened saltwater intrusion in the North Channel (Lyu and Zhu, 2019). However, the combined influences of the RP-XCS, RP-QCS, RP-EHS and RP-NHS have not been examined. The aim of this study is to address this issue.
2 MATERIAL AND METHOD 2.1 Study areaThe Changjiang River estuary, located from Shanghai to the offshore of southern Jiangsu Province in China between 30.8°N–32°N and 121°E–122.5°E, is a funnel-shaped estuary (Fig. 1). The Changjiang River estuary is 90 km wide and is a typical estuary with multiple bifurcations (Fig. 1). First, the estuary is bifurcated into the South Branch and North Branch. Second, the lower South Branch is divided by Changxing Island into the South Channel and the North Channel. Finally, the South Channel is bifurcated into the South Passage and the North Passage by Jiuduansha Island. The grooves and tidal flats alternate and have developed in the different channels. As a whole, the depth of the Changjiang River estuary gradually deepens seaward. Most tidal flats are in the North Branch and the mouth of the Changjiang River estuary. The average depth of the North Branch is very shallow, especially in the upper reaches of the North Branch, which is only 2–4-m deep. The average depth of the North Branch is 5–30 m (Chen et al., 2019). Therefore, the South Branch is the main channel discharging runoff. The Changjiang River estuary is a mesotidal estuary (Shen et al., 2003). The tides in the Changjiang River estuary exhibit semidiurnal, diurnal, and biweekly spring-neap cycles (Zhu et al., 2015).
In the Changjiang River estuary, longitudinal and lateral saltwater intrusions coexist, and both saltwater intrusions can affect the temporal variation and spatial distribution of salinity (Fig. 1a) (Wu et al., 2006; Qiu et al., 2012; Li et al., 2014; Zhu et al., 2015; Lyu and Zhu, 2018). There are four outlets (the North Branch, North Channel, North Passage and South Passage) into the sea in the Changjiang River estuary. In the North Channel, North Passage and South Passage, the saltwater from the sea mainly intrudes along the longitudinal direction, consistent with most estuaries. The particular lateral saltwater intrusion in the Changjiang River estuary is saltwater spillover (SSO) from the North Branch into the South Branch. From the 1950s to 2000s, natural forces and human activities severely narrowed the North Branch. Consequently, the upper reaches of the North Branch have become almost perpendicular to the South Branch, while the lower reaches have become funnel shaped. The evolution of topography led to a reduction in runoff entering the North Branch, especially during the dry season, and also caused the tidal range in the North Branch to be greater than that in the South Branch. Strong tidal forcing in the North Branch induces considerable subtidal circulation, resulting in a net landward flow when river discharge is low during spring tide (Wu et al., 2006). This residual transport forms the SSO, which is the most characteristic type of saltwater intrusion in the estuary (Wu et al., 2006; Xue et al., 2009; Li et al., 2014; Lyu and Zhu, 2018). Saltwater intrusion will cause estuarine stratification and affect estuarine circulation (Simpson et al., 1990; Geyer, 1993). The degree of mixing in the Changjiang River estuary differs among the different channels. In the North Branch, the water is well mixed. The diversion ratio of river discharge in the North Branch is very small (approximately 1%) owing to the special river regime (the North Branch is almost perpendicular to the main channel and is very shallow). Additionally, the shape of the North Branch is similar to that of the mouth of a horn, so the tidal range is greater. Therefore, vertical mixing is strong in the North Branch. In the South Branch, especially near the mouth, the salinity is partially mixed in spring tide and weakly mixed in neap tide (a salt wedge appears). Additionally, the lateral intrusion is stronger on the north side than on the south side of a channel due to the Coriolis Force (Li et al., 2014; Lyu and Zhu, 2018). Together with the SSO, the landward saltwater intrusion along the North Channel threatens the water intake of the reservoirs, i.e., the QCSR, Dongfengxisha Reservoir (DFXSR) and Chenhang Reservoir (CHR). The QCSR is the largest tidal estuary freshwater reservoir worldwide. More than 70% of the freshwater for Shanghai is supplied by the QCSR, but the QCSR is frequently influenced by saltwater intrusion during the dry season (Zhu et al., 2010; Wang and Zhu, 2015; Chen et al., 2019). The reservoirs cannot receive water from the Changjiang River estuary when the salinity exceeds 0.45, which is the salinity standard for drinking water.
2.2 Model configurationA 3D numerical model (ECOM-si) was adopted in this study. This model has been applied and developed continuously by many researchers (Blumberg, 1994; Chen et al., 2001; Zheng et al., 2003, 2004; Zhu, 2003; Wu and Zhu, 2010). The Mellor-Yamada level 2.5 turbulence closure module (Mellor and Yamada 1982) with stability parameters from Kantha and Clayson (1994) was included. In this study, the domain of the model covers the Changjiang River estuary and its adjacent sea (from 117.5 E to 125 E and 27.5 N to 33.7 N) (Fig. 2). The model grid was composed of 337 225 cells horizontally and 10 uniform σ levels vertically. The resolutions of the model varied from 100 m to 10 km around the Changjiang River estuary. The model can simulate tidal currents, estuarine circulation, and the spatial and temporal distributions of salinity with little sacrifice in terms of run time. The Datong station recorded daily river discharge, which can be used in the model as the river boundary condition. In this study, the mean discharge during the dry season (11 500 m3/s) was adopted in all experiments. The open sea boundary was driven by 16 astronomical constituents: M2, S2, N2, K2, K1, O1, P1, Q1, MU2, NU2, T2, L2, 2N2, J1, M1, and OO1. The initial salinity distribution around the Changjiang River estuary was derived from the Ocean Atlas in the Yellow Sea and East China Sea (Hydrology) (Editorial Board for Marine Atlas, 1993). The semimonthly mean wind data of ten years from the NECP (National Centers for Environmental Prediction) with a resolution of 0.25°×0.25° were used. ECOM-si adopted the HSIMT-TVD advection scheme to solve the transport equations developed by Wu and Zhu (2010). This scheme features third-order accuracy and can prevent numerical oscillations from exacerbating the calculation error. The model adopted the implicit time-stepping method, which could break the limits of the Courant-Friedrichs-Lewy (CFL) stability criterion (Lax and Wendroff, 1962) for the external mode at the cost of solving an elliptic system. The density in the model is calculated by using the parameterized formula of Fofonoff and Millard (1983) based on the salinity, temperature and pressure at the current time. The temperature in the ECOM-si was set at 10 ℃. The hydrodynamic and salinity formulas are solved at the same time step. The integrated time step was set to 40 s for all experiments. The concrete calculation process of ECOM-si is shown in Fig. 2. More detail about the numerical model setup can be found in Wu et al. (2011).

|
| Fig.2 The flow chart of ECOM-si computational process |
To describe the water and salt transport, the residual unit width water flux (RUWF) and the residual unit width salt flux (RUSF) are defined as follows:
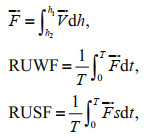
where 

Additionally, the residual transection water flux (NTWF) is determined to calculate the water diversion ratio (WDR) between channels (transection locations labeled in Fig. 1) as follows:

where ζ is the elevation, H(x, y) is the depth, L is the width of the transect, l is the location from 0 to L, z is the height from -H(x, y) to ζ, t is the time from 0 to T, and 
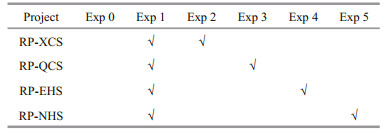
The model calculation period starts on December 1, 2014, and ends at the end of February 2015, and the calculation results in February are analyzed and compared. The river discharges in December, January and February are set by the average since 1950, as measured by the Datong hydrological station, and these discharges are 13 600, 11 100, and 12 000 m3/s, respectively. Six numerical experiments are conducted for contrastive analysis (as shown in Table 1): Experiment 0 (Exp 0) is the control experiment, which is designed to simulate the saltwater intrusion pattern before the four reclamation projects (Fig. 3a). Experiment 1 (Exp 1) considers the four projects (Fig. 3b). Experiment 2 (Exp 2) only considers the RP-XCS (Fig. 3c), Experiment 3 (Exp 3) only considers the RP-QCS (Fig. 3d), Experiment 4 (Exp 4) only considers the RP-EHS (Fig. 3e), and Experiment 5 (Exp 5) only considers the RP-NHS (Fig. 3f).
|

|
| Fig.3 Numerical model domain and grids Enlarged views are the different model grids used in the six experiments. a. no reclamation projects; b. the four reclamation projects combined; c. only the RP-XCS; d. only the RP-QCS; e. only the RP-EHS; f. the RP-NHS only. |
The model has been extensively validated in the Changjiang River estuary (Li et al., 2010, 2012, 2014; Qiu and Zhu, 2013, 2015; Lyu and Zhu, 2018). In this paper, the measured data in the South Passage from 9 to 19 in March 2018 were used to validate the model (three buoy sites and three ship sites shown in Fig. 1b).
The measured river discharge data recorded by the Datong hydrological station (location as shown in Fig. 3) and wind data recorded by the Chongming weather station (W, blue dot in Fig. 1b) were adopted to validate the model. The correlation coefficient (CC), root mean square error (RMSE), and skill score (SS, Willmott, 1981) were used to quantify the validation as follows:

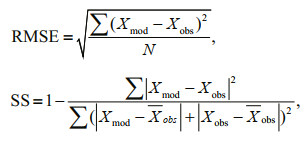
where Xmod is the simulated data, Xobs is the observed data, N is the total number of data, and X is the mean value. The value range of SS is 0–1. When the SS is closer to 1, the agreement between the simulation results and observations is better. Due to space limitations, only the comparison results of the simulation and observations at Site B and Buoy 2 are selected and shown in Figs. 4–5. The assessment indicator scores of simulated water velocity and salinity are listed in Tables 2–3, respectively. Comparing the simulated and observed data reveals that the model can successfully simulate the variation processes of current and salinity.

|
| Fig.4 Temporal variation in water velocity, direction, and salinity in the neap tide following moderate tide at the surface layer (left) and bottom layer (right) at ship-measured site B Red dots: measured values; black lines: simulated values. |

|
| Fig.5 Temporal variations in water velocity, direction, and salinity at the surface layer at buoy-measured site Buoy 2 Red dots: measured values; black lines: simulated values. |

|

|
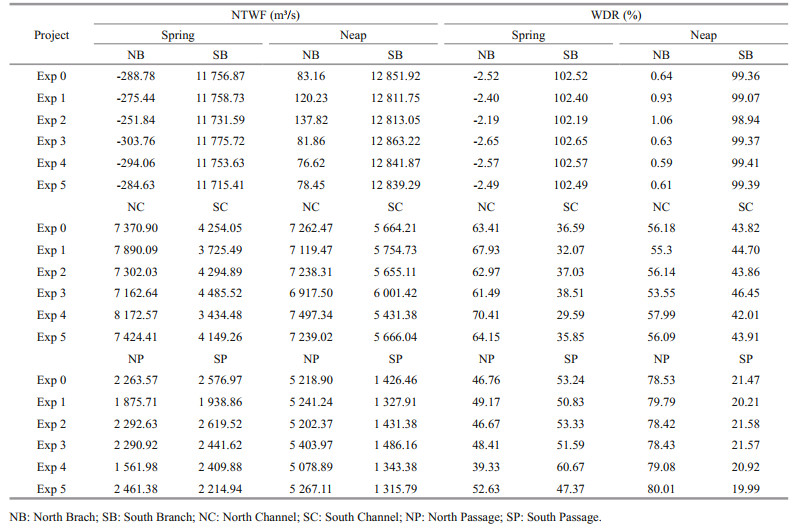
Before the four reclamation projects (Exp 0), during spring tide (Fig. 6a), the surface RUWF in the North Channel, North Passage, and South Passage flowed seaward. Because of the special topography of the North Branch, the RUWF in the North Branch flows landward (Chen et al., 2019). The NTWF and WDR in the North Branch are -288.78 m3/s and -2.52% (shown in Table 4), respectively, where the negative sign indicates that the water is transported from the North Branch into the South Branch. This indicates that river runoff flows into the sea mainly through the South Branch, and most of the river runoff (63.41%) flows into the sea through the North Channel rather than the South Channel (Table 4). Similarly, the South Passage (53.24%) is the main channel for river runoff into the sea (Table 4). On eastern Chongming Island, the RUWF flows northward because of the action of tidal pumping transport and tidal Stokes transport (Qiu and Zhu, 2015). Additionally, in the South Branch, the RUWF is seaward, but the RUWF is smaller in the bottom layer because of the bottom friction (Fig. 6b). The bottom RUWF near the river mouth is landward due to the strong salinity front (Yuan and Zhu, 2015). The RUWF in the north of the RP-EHS flows seaward, and that in the east of the RP-EHS flows landward. The distribution of RUSF (as shown in Fig. 6c–d) is similar to that of RUWF. The magnitude of the RUSF is much larger outside of the river mouth because of the high salinity in that area. The RUSF on the northern side of the North Passage flows landward, which brings highly saline water into the area around the mouth of the North Channel. The North Branch contains highly saline water due to the lower WDR (Table 4), and the SSO is simulated, which is the result of the RUWF and RUSF from the upper reaches of the North Branch flowing into the South Branch. The low-salinity water around eastern Chongming Island extends northeastward (Fig. 6e–f). As a result, the saltwater intrusion is strongest in the South Passage and weakest in the North Channel in the Changjiang River estuary, and the bottom saltwater intrusion is stronger than the surface.

|
| Fig.6 Distributions of the RUWF (a, b), RUSF (c, d), and average salinity (e, f) in the surface (left) and bottom (right) layers during spring tide before the four reclamation projects The red isohaline is 0.45, which is the salinity standard of drinking water. |
|
During neap tide (Fig. 7), wind is dominant because tides become weaker, and the RUWF and RUSF around the outside of the river mouth flow southward due to the effect of the northerly winter monsoon (Wu et al., 2014; Chen et al., 2019; Lyu and Zhu, 2019). In addition, the SSO disappeared, which is different from spring tide. The NTWF in the North Branch became a positive value (83.16 m3/s), and the WDR was 0.64% (Table 4). The North Channel (56.18%) is the main channel for river discharge rather than the South Channel (Table 4). Because of the blockage of the stronger salinity front in the South Passage, the North Passage (78.53%) is the main channel for river discharge (Table 4). The bottom RUWF and RUSF near the river mouth flow landward due to a strong salinity front. Additionally, distinct saline wedges form around the river mouth due to weaker tidal mixing.

|
| Fig.7 The same as Fig. 6 except for neap tide |
As shown by the above results, the four reclamation projects should have a strong influence on saltwater intrusion in the Changjiang River estuary. To determine the reason and mechanism for the variation, the other four experiments (Exp 2–5) were performed. In this way, the effect of the individual reclamation project can be distinguished from the total effects of the four reclamation projects on saltwater intrusion.
3.2 After the reclamation projectsThe difference in the average salinity distribution after completion of the four reclamation projects (Exp 1-Exp 0) is shown in Fig. 8. During spring tide, the surface and bottom salinity in the upper reaches of the North Branch decreases by approximately 0.5. In contrast, the salinity in the middle and lower reaches of the North Branch increases by approximately 1.0. In the area east of Chongming Island, the salinity increases by more than 2.0. In the South Branch, the surface and bottom salinity decease slightly. Therefore, the intensity of the SSO weakens after the four reclamation projects. In the North Channel, the salinity near the QCSR decreases slightly. However, the salinity in the area east of the RP-EHS decreases significantly. In particular, in the zone northeast of the RP-EHS, the maximum magnitude is above 2.0. In the South Channel, the salinity increases slightly. In the North Passage, the overall salinity increases by approximately 1.0. In the South Passage, the salinity variation presents a decreased distribution on the north side and increases on the south side. The maximum salinity variation area is located southeast of the RP-NHS, where it increases by more than 3.0.

|
| Fig.8 Differences in the salinity distributions in the surface (left) and bottom (right) layers during spring tide (a, b) and neap tide (c, d) after and before the four reclamation projects (Exp 1-Exp 0) |
Similarly, during neap tide (Fig. 8c–d), the salinity decreases in the upper reaches and increases in the middle and lower reaches of the North Branch. The variation is approximately 1.0. The salinity east of Chongming Island also increases by approximately 1.0. The area of surface salinity decrease in the North Channel widens. However, the difference in the bottom salinity distribution varies differently from that during spring tide. The bottom salinity near the outlet of the North Channel increases by approximately 0.5. The surface and bottom salinities east of the RP-EHS can increase by more than 3.0, and they can change slightly in the North Passage. In the South Passage, the salinity variation is completely opposite to that during spring tide. South of the RP-NHS, salinity changes substantially by approximately 2.0.
3.3 Effects of every reclamation projectDuring spring tide, the effect of the RP-XCS narrows the transection in the middle reaches of the North Branch, induces the NTWF to increase by 36.94 m3/s and the WDR to increase by 0.33% (Table 5) and causes more freshwater to flow into the upper reaches of the North Branch from upstream, hindering landward saltwater intrusion in the lower reaches from the project and resulting in a salinity decrease in the upper reaches and a slight increase in the middle and lower reaches (Fig. 9a & b). The salinity decreases in the South Branch and increases east of Chongming Island and in the North Channel. Because the RP-XCS is small and located in the North Branch, the change in WDR is 0.44% in the bifurcation of the North Channel and South Channel and only 0.09% in the bifurcation of the North Passage and South Passage. The project's influence on the RUWF and RUSF has no obvious changes in the North Branch and South Branch (figures omitted due to space limitations).

|

|
| Fig.9 Differences in salinity distributions in the surface (left) and bottom (right) layers during spring tide after and before RP-XCS (a, b), RP-QCS (c, d), RP-EHS (e, f), and RP-NHS (g, h) |
The effect of the RP-QCS narrows the upper reaches of the North Channel, causing the NTWF and WDR to decrease by 208.26 m3/s and 1.92% in the North Channel (Table 5), respectively, resulting in salinity increases in the North Channel and east of Chongming Island. This effect does not occur in the area north of the North Passage, as the salinity decreases in that area. The impact of the RP-QCS on the WDR change is 0.13% in the bifurcation of the North and South Branch and 1.65% in the bifurcation of the North Passage and South Passage. The salinity decreases slightly in the South Channel, North Passage, and South Passage (Fig. 9c–d). The difference between the surface and bottom RUWF is landward near the QCSR after the RP-QCS, meaning that the seaward RUWF decreases.
Among the effects of the RP-EHS, the NTWF and WDR increased by 801.67 m3/s and 7.0% in the North Channel (Table 5), respectively, meaning that more freshwater was bifurcated into the North Channel, resulting in salinity decrease of 1–2 in the mouth of the North Channel. The other reason for the salinity decrease is that the RP-EHS lengthens the North Channel seaward. The differences in the RUWF and RUSF in the area east of Chongming Island are the opposite of the directions before the RP-EHS, meaning that the southward transport of water and salt by the northerly wind is weakened by the RP-EHS, inducing the highly saline water to gather in the area east of Chongming Island, resulting in salinity increases of approximately 0.5 in that area. In the South Channel, the NTWF and WDR decreased by 819.57 m3/s and 7.0%, respectively, after the RP-EHS, which led the NTWF in the North and South Passages to decrease by 701.59 and 167.09 m3/s, respectively. For this reason, the salinity in the South Channel increased by approximately 1.0 after the projects. In the North Passage, the WDR decreased by 7.43%, resulting in a surface and bottom salinity increase of 1.0. The reason for the salinity increase in the North Passage is that the project blocks the lower salinity water flowing southward in the North Channel into the North Passage, which is forced by the northerly wind and Coriolis force.
Among the effects of the RP-NHS, the NTWF and WDR in the South Passage decreased by 362.03 m3/s and 5.87% (Table 5), respectively, because the transect area at the entrance of the South Passage was narrowed. The impact of the RP-NHS on the WDR change is only 0.03% in the bifurcation of the North Branch and South Branch and 0.74% in the bifurcation of the North Channel and South Channel. The narrower transect area reduces the landward salt flux, resulting in a salinity decrease in the South Passage, even though the WDR in the South Passage decreases. In the southeastern area of the project, the salinity increases by more than 3.0 because the RP-NHS blocks the upstream river water flowing there and gathers highly saline water from the open sea.
Comparing the distribution of the salinity difference between Exp 1 and Exp 0 (Fig. 8a–b), with and without the individual reclamation projects (Exp 2, Fig. 9a–b; Exp 3, Fig. 9c–d; Exp 4, Fig. 9e–f; and Exp 5, Fig. 9g–h), the salinity decrease in the upper reaches of the North Branch and increases in the middle and lower reaches of the North Branch are mainly caused by the RP-XCS. The salinity decrease in the North Channel is caused by the RP-EHS, and the effect is much larger than the effect of the RP-QCS, which increases the salinity. The salinity decrease in the South Passage is caused by the RP-NHS, and the effect is much larger than the effect of the RP-EHS, which increases the salinity in that area. A distinct salinity increase southeast of the RP-NHS is completely induced by the RP-NHS. In the area east of Chongming Island, the salinity increase is considerable under the cumulative effect of the four reclamation projects, where the RP-EHS has the largest contribution, the RP-QCS has the second largest contribution, the RP-XCS has the third largest contribution, and the RP-NHS has a very small negative contribution.
During neap tide, the RP-XCS caused the NTWF to increase by 54.66 m3/s and the WDR to increase by 0.42% (Table 5), resulting in a salinity change in the North Branch that is similar to that during spring tide, with a decrease in the upper reaches and an increase in the middle and lower reaches (Fig. 10a–b). Salinity increases east of Chongming Island and in the North Channel. The RP-XCS changes the WDR by only 0.04% in the bifurcation of the North Channel and South Channel and 0.11% in the bifurcation of the North Passage and South Passage because the project is located far away.

|
| Fig.10 The same as Fig. 9 except for neap tide |
The RP-QCS caused the NTWF and WDR to decrease by 344.21 m3/s and 2.63% in the North Channel (Table 5), respectively, resulting in salinity increases in the North Channel, in the area east of Chongming Island, and in the lower reaches of the North Branch. The impact of the RP-QCS on the WDR change was 0.01% in the bifurcation of the North and South Branch and 1.10% in the bifurcation of the North and South Passage. The salinity increased slightly in the South Channel, North Passage, and South Passage (Fig. 10c–d).
The RP-EHS resulted in increases in the NTWF and WDR by 234.87 m3/s and 1.81% in the North Channel (Table 5), respectively, meaning that more freshwater is bifurcated into the North Channel, resulting in a salinity decrease of more than 1.0 in the mouth of the North Channel. In the South Channel, the NTWF and WDR decreased by 234.87 m3/s and 1.81%, respectively, after the RP-EHS, which caused the NTWF in the North Passage and the South Passage, to decrease by 104.01 and 83.08 m3/s, respectively. The salinities in the South Channel, North Passage, and South Passage increased by 0.5–1.0. The salinity in the area east of the RP-EHS increased for the same reason as during spring tide described above.
The RP-NHS caused the NTWF and WDR in the South Passage to decrease by 5.87 m3/s and 1.48% (Table 5), respectively. However, the salinity in the South Passage decreased by 0.5 to 1.0 even though the WDR in the South Passage decreased because the RP-NHS narrowed the entrance of the South Passage, which reduced the landward salt flux from the open sea. The impact of the RP-NHS on the WDR change was only 0.03% in the bifurcation of the North Branch and South Branch and 0.09% in the bifurcation of the North Channel and South Channel. In the southern area of the RP-NHS, the salinity increased by more than 2.0, and the cause was the same as that during spring tide.
Comparing the difference in salinity distributions between Exp 1 and Exp 0 (Fig. 8c–d), with and without the individual reclamation project (Exp 2, Fig. 10a–b; Exp 3, Fig. 10c–d; Exp 4, Fig. 10e–f; and Exp 5, Fig. 10g–h), the salinity decreases in the upper reaches of the North Branch and increases in the middle and lower reaches of the North Branch are mainly caused by the RP-XCS. The salinity decrease in the North Channel is caused by the RP-EHS, and the effect is much larger than the effect of the RP-QCS, which increases the salinity. The salinity decrease in the South Passage is caused by the RP-NHS, and the effect is much larger than the effect of the RP-EHS, which caused the salinity to increase in that area. A distinct salinity increase south of the RP-NHS was induced by the RP-NHS. In the area east of Chongming Island, the salinity increase was caused by the cumulative effect of the RP-QCS and RP-NHS.
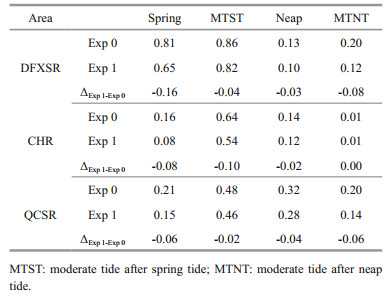
3.4 Effects on reservoirsDue to the low river discharge in winter, saltwater intrusion frequently threatens freshwater intake from the Changjiang River estuary. Previous studies indicated that the salinity at the QCSR is controlled by the SSO and saltwater intrusion along the North Channel. However, the salinity at the CHR and DFXSR is completely influenced by the SSO (Chen and Zhu, 2014b; Li et al., 2014). The temporal salinity variations at the water intakes of the QCSR, CHR, and DFXSR before and after the four reclamation projects are shown in Fig. 11, and the corresponding tidally averaged salinities are shown in Table 6. As demonstrated in previous studies, the reservoir still cannot receive water if the duration of salinity lower than 0.45 is shorter than 4.0 h (Zhu et al., 2013). Therefore, the reservoir still cannot intake water during the flood and ebb periods, even though the salinity will be below 0.45 over less than 4.0 h. As mentioned above, the SSOs are somewhat weakened after the four reclamation projects. The saline water that threatened the reservoirs is mainly from the SSO. The longest continuous nonsuitable water intake period for the QCSR, CHR, and DFXSR slightly decreased overall (Fig. 11b–d). The longest continuous nonsuitable water intake period for the DFXSR decreased from 7.2 to 6.3 d, that for the CHR decreased from 4.5 to 3.9 d, and that for the QCSR was still 3.1 d even though the average salinity decreased. Correspondingly, during spring tide, moderate tide after spring tide (MTST), neap tide, and moderate tide after neap tide (MTNT), the tidally averaged salinity reductions at the water intake of the DFXSR are 0.16, 0.04, 0.03, and 0.08, the tidally averaged salinity reductions at the water intake of the CHR are 0.08, 0.10, 0.02, and 0.00, the tidally averaged salinity reductions at the water intake of the QCSR are 0.06, 0.02, 0.04, and 0.06. These findings indicate that the four reclamation projects favor the security of freshwater resources in the Changjiang River estuary.

|
| Fig.11 Simulated temporal variation in elevation at the water intake of the QCSR (a) and the salinity at the water intakes of the DFXSR (b), CHR (c), and QCSR (d) before (black lines) and after (red lines) the four reclamation projects from February 8–26, 2015 The green line is 0.45. The blue and yellow belts indicate the longest continuous non-suitable water intake periods for the reservoirs before and after the four reclamation projects, respectively. |
|
The effects of the four reclamation projects and each individual project on the saltwater intrusion and water resources in the Changjiang River estuary were simulated by a 3D numerical model. This study shows that for a multichannel estuary, a local reclamation project changes the local topography, changes the WDR between channels, and influences the water and salt transport in the estuary.
The cumulative effects of the four reclamation projects on saltwater intrusion in the North Branch and South Branch, the North Channel and South Channel, and in the North Passage and South Passage, in spring tide and neap tide, are different. During spring tide, under the combined effects of the four reclamation projects, the salinity decreases by approximately 0.5 in the upper reaches of the North Branch and increases by 0.5–1.0 in the mid and lower reaches of the North Branch, which is mainly caused by the RP-XCS. In the North Channel, the salinity decreases by approximately 0.5 and 1–2 northeast of the RP-EHS, which is caused by the RP-EHS. The effect is much larger than the effect of the RP-QCS, which has the opposite effect. In the North Passage, the salinity increases by 0.5–1.0, which is caused by the RP-EHS. In the South Passage, the salinity increases by approximately 0.5 in the upper reaches, and the changes on the south side of the mid reaches are caused by the RP-EHS. The salinity decreases of 0.2–0.5 on the north side of the mid and lower reaches are caused by the RP-NHS, and there are increases of 1.0–3.5 east of the RP-NHS, which are mainly caused by the RP-EHS. In the area east of Chongming Island, the salinity increase is significant, and the RP-EHS has the largest contribution, the RP-QCS has the second largest contribution, and RP-XCS has the third largest contribution.
During neap tide, the effects of the four reclamation projects combined and the individual projects are similar to the effects in spring tide, but there are some different aspects. In the North Channel, the magnitude and extent of salinity decrease northeast of the RP-EHS, decrease in the surface layer and even increase of 0.5 is caused by the RP-QCS, and an increase of approximately 3.0 occurs in the area east of the RP-EHS. In the South Passage, the salinity changes are nearly the opposite to that in spring tide, and the distinct salinity increase moves from east to south of the RP-NHS.
The SSO was somewhat weakened after the completion of the four reclamation projects, which resulted in slight salinity decreases at the water intakes of the DFXSR, CHR, and QCSR. The cumulative effects of the four reclamation projects are favorable for the security of freshwater resources in the Changjiang River estuary.
The conclusions from this study are only appropriate for saltwater intrusion under mean climate conditions in the dry season in the Changjiang River estuary. As mentioned in the description of the model configuration, all of the numerical experiments were run under the mean runoff and wind conditions. Thus, the results cannot reflect the impacts of the projects on saltwater intrusion in the Changjiang River estuary under extreme weather conditions.
5 DATA AVAILABILITY STATEMENTThe observation and model data and computer codes used in this paper are available from the corresponding author (e-mail: jrzhu@sklec.ecnu.edu.cn).
6 ACKNOWLEDGMENTWe are grateful for the support from the China Scholarship Council. We also acknowledge the anonymous reviewers for their valuable comments and suggestions.
Andrews S W, Gross E S, Hutton P H. 2017. Modeling salt intrusion in the San Francisco Estuary prior to anthropogenic influence. Continental Shelf Research, 146: 58-81.
DOI:10.1016/j.csr.2017.07.010 |
Birch G F, Murray O, Johnson I, et al. 2009. Reclamation in Sydney estuary, 1788-2002. AustralianGeographer, 40(3): 347-368.
DOI:10.1080/00049180903127788 |
Blumberg A F. 1994. A Primer for ECOM-si, Technical report. HydroQual, Mahwah. 6p.
|
Buggy C J, Tobin J M. 2006. Spatial distribution of nine metals in surface sediment of an urban estuary prior to a large scale reclamation project. Marine Pollution Bulletin, 52(8): 969-974.
DOI:10.1016/j.marpolbul.2006.04.006 |
Chen C S, Zhu J R, Ralph E, et al. 2001. Prognostic modeling studies of the Keweenaw current in Lake Superior. Part Ⅰ: formation and evolution. Journal of Physical Oceanography, 31(2): 379-395.
DOI:10.1175/1520-0485(2001)031<0379:PMSOTK>2.0.CO;2 |
Chen J, Zhu J R. 2014a. Impact of the reclamation project of Xincunsha on the saltwater intrusion in the North Branch of the Changjiang Estuary. Journal of East China Normal University (Natural Science), (4): 163-172.
(in Chinese with English abstract) |
Chen J, Zhu J R. 2014b. Sources for saltwater intrusion at the water intake of Qingcaosha Reservoir in the Changjiang Estuary. Acta Oceanologica Sinica, 36(11): 131-141.
(in Chinese with English abstract) |
Chen Q, Zhu J R, Lyu H H, et al. 2019. Determining critical river discharge as a means to provide water supply security to the Changjiang river estuary, China. Journal of Coastal Research, 35(5): 1087-1094.
DOI:10.2112/JCOASTRES-D-18-00165.1 |
Doornbos G, Groenendijk A M, Jo Y W. 1986. Nakdong estuary barrage and reclamation project: preliminary results of the botanical, macrozoobenthic and ornithological studies. Biological Conservation, 38(2): 115-142.
DOI:10.1016/0006-3207(86)90069-8 |
Editorial Board for Marine Atlas. 1993. Marine Atlas of Bohai Sea, Yellow Sea, East China Sea: Hydrology. China Ocean Press, Beijing. p. 13-168.
(in Chinese)
|
Fofonoff N P, Millard Jr R C. 1983. Algorithms for computation of fundamental properties of seawater. UNESCO Technical Papers in Marine Science 44. https://www.phionics.com/wp-content/uploads/2020/12/122840.pdf.
|
Fu Y B, Cao K, Wang F, et al. 2010. On the quantitative evaluation method of intensity and potential of reclamation. Ocean Development and Management, 27(1): 27-30.
(in Chinese with English abstract) |
Geyer W R. 1993. The importance of suppression of turbulence by stratification on the estuarine turbidity maximum. Estuaries, 16(1): 113-125.
DOI:10.2307/1352769 |
Han Z C, Pan C H, Yu J, et al. 2001. Effect of large-scale reservoir and river regulation/reclamation on saltwater intrusion in Qiantang Estuary. Science in China Series B: Chemistry, 44(S1): 221-229.
DOI:10.1007/BF02884830 |
Kantha L H, Clayson C A. 1994. An improved mixed layer model for geophysical applications. Journal of Geophysical Research: Oceans, 99(C12): 25235-25266.
DOI:10.1029/94JC02257 |
Kuijpers J W M. 1995. Ecological restoration of the Rhine/Maas estuary. Water Science and Technology, 31(8): 187-195.
DOI:10.2166/wst.1995.0295 |
Lax P D, Wendroff B. 1962. On the stability of difference schemes. Communications on Pure and Applied Mathematics, 15(4): 363-371.
DOI:10.1002/cpa.3160150401 |
Li L J, Zhu J R. 2015. Impacts of the reclamation project of Nanhui tidal flat on the currents and saltwater intrusion in the Changjiang Estuary. Journal of East China Normal University (Natural Science), (4): 77-86.
(in Chinese with English abstract) |
Li L, Zhu J R, Wu H, et al. 2010. A numerical study on water diversion ratio of the Changjiang (Yangtze) estuary in dry season. Chinese Journal of Oceanology and Limnology, 28(3): 700-712.
DOI:10.1007/s00343-010-9114-2 |
Li L, Zhu J R, Wu H, et al. 2014. Lateral saltwater intrusion in the North Channel of the Changjiang Estuary. Estuaries and Coasts, 37(1): 36-55.
DOI:10.1007/s12237-013-9669-1 |
Li L, Zhu J R, Wu H. 2012. Impacts of wind stress on saltwater intrusion in the Yangtze Estuary. Science China Earth Sciences, 55(7): 1178-1192.
DOI:10.1007/s11430-011-4311-1 |
Lyu H H, Zhu J R. 2018. Impact of the bottom drag coefficient on saltwater intrusion in the extremely shallow estuary. Journal of Hydrology, 557: 838-850.
DOI:10.1016/j.jhydrol.2018.01.010 |
Lyu H H, Zhu J R. 2019. Impacts of Tidal flat reclamation on saltwater intrusion and freshwater resources in the Changjiang Estuary. Journal of CoastalResearch, 35(2): 314-321.
DOI:10.2112/JCOASTRES-D-18-00077.1 |
Ma Y G, Rong K, Mangalagiu D, et al. 2018. Co-evolution between urban sustainability and business ecosystem innovation: evidence from the sharing mobility sector in Shanghai. Journal of Cleaner Production, 188: 942-953.
DOI:10.1016/j.jclepro.2018.03.323 |
Manda A, Matsuoka K. 2006. Changes in tidal currents in the Ariake Sound due to reclamation. Estuaries and Coasts, 29(4): 645-652.
DOI:10.1007/BF02784289 |
Mellor G L, Yamada T. 1982. Development of a turbulence closure model for geophysical fluid problems. Reviews of Geophysics, 20(4): 851-875.
DOI:10.1029/RG020i004p00851 |
Nichols F H, Cloern J E, Luoma S N, et al. 1986. The modification of an estuary. Science, 231(4738): 567-573.
DOI:10.1126/science.231.4738.567 |
Qiu C, Zhu J R, Gu Y L. 2012. Impact of seasonal tide variation on saltwater intrusion in the Changjiang River estuary. Chinese Journal of Oceanology and Limnology, 30(2): 342-351.
DOI:10.1007/s00343-012-1115-x |
Qiu C, Zhu J R. 2013. Influence of seasonal runoff regulation by the Three Gorges Reservoir on saltwater intrusion in the Changjiang River Estuary. Continental Shelf Research, 71: 16-26.
DOI:10.1016/j.csr.2013.09.024 |
Qiu C, Zhu J R. 2015. Assessing the influence of sea level rise on salt transport processes and estuarine circulation in the Changjiang River estuary. Journal of Coastal Research, 31(3): 661-670.
DOI:10.2112/JCOASTRES-D-13-00138.1 |
Shen H T, Mao Z C, Zhu J R. 2003. Saltwater Intrusion in the Changjiang Estuary. China Ocean Press, Beijing. 175p.
(in Chinese)
|
Shi C, Hutchinson S M, Yu L, et al. 2001. Towards a sustainable coast: an integrated coastal zone management framework for Shanghai, People's Republic of China. Ocean & Coastal Management, 44(5-6): 411-427.
DOI:10.1016/S0964-5691(01)00058-8 |
Simpson J H, Brown J, Matthews J, et al. 1990. Tidal straining, density currents, and stirring in the control of estuarine stratification. Estuaries, 13(2): 125-132.
DOI:10.2307/1351581 |
Song D H, Wang X H, Zhu X M, et al. 2013. Modeling studies of the far-field effects of tidal flat reclamation on tidal dynamics in the East China Seas. Estuarine, Coastal and Shelf Science, 133: 147-160.
DOI:10.1016/j.ecss.2013.08.023 |
Thia-Eng C. 1993. Essential elements of integrated coastal zone management. Ocean & Coastal Management, 21(1-3): 81-108.
DOI:10.1016/0964-5691(93)90021-P |
Van Maren D S, Oost A P, Wang Z B, et al. 2016. The effect of land reclamations and sediment extraction on the suspended sediment concentration in the Ems Estuary. Marine Geology, 376: 147-157.
DOI:10.1016/j.margeo.2016.03.007 |
Wang S X, Zhu J R. 2015. Saltwater intrusion sources at the water intake of Qingcaosha reservoir in different tidal pattern and wind case. Journal of East China Normal University (Natural Science), (4): 65-76.
(in Chinese with English abstract) |
Wang W, Liu H, Li Y Q, et al. 2014. Development and management of land reclamation in China. Ocean & Coastal Management, 102: 415-425.
DOI:10.1016/j.ocecoaman.2014.03.009 |
Willmott C J. 1981. On the validation of models. Physical Geography, 2(2): 184-194.
DOI:10.1080/02723646.1981.10642213 |
Wu H, Shen J, Zhu J R, et al. 2014. Characteristics of the Changjiang plume and its extension along the Jiangsu Coast. Continental Shelf Research, 76: 108-123.
DOI:10.1016/j.csr.2014.01.007 |
Wu H, Zhu J R, Chen B R, et al. 2006. Quantitative relationship of runoff and tide to saltwater spilling over from the North Branch in the Changjiang Estuary: a numerical study. Estuarine, Coastal and Shelf Science, 69(1-2): 125-132.
DOI:10.1016/j.ecss.2006.04.009 |
Wu H, Zhu J R, Shen J, et al. 2011. Tidal modulation on the Changjiang River plume in summer. Journal of Geophysical Research: Oceans, 116(C8): C08017.
DOI:10.1029/2011JC007209 |
Wu H, Zhu J R. 2010. Advection scheme with 3rd high-order spatial interpolation at the middle temporal level and its application to saltwater intrusion in the Changjiang Estuary. Ocean Modelling, 33(1-2): 33-51.
DOI:10.1016/j.ocemod.2009.12.001 |
Xu T. 2014. Study on hydrodynamics and salinity environment after a large-scale reclamation project in the Oujiang River Estuary. In: Xu T ed. Modeling and Computation in Engineering Ⅲ. CRC Press, Boca Raton. 17p, https://doi.org/10.1201/b17064-4.
|
Xue P F, Chen C S, Ding P X, et al. 2009. Saltwater intrusion into the Changjiang River: a model-guided mechanism study. Journal of Geophysical Research: Oceans, 114(C2): C02006.
DOI:10.1029/2008JC004831 |
Yuan R, Zhu J R. 2015. The effects of dredging on tidal range and saltwater intrusion in the pearl river estuary. Journal of Coastal Research, 31(6): 1357-1362.
DOI:10.2112/JCOASTRES-D-14-00224.1 |
Zheng L Y, Chen C S, Liu H D. 2003. A modeling study of the Satilla River Estuary, Georgia. I: flooding-drying process and water exchange over the salt marsh-estuary-shelf complex. Estuaries, 26(3): 651-669.
DOI:10.1007/BF02711977 |
Zheng L Y, Chen C S, Zhang F Y. 2004. Development of water quality model in the Satilla River Estuary, Georgia. Ecological Modelling, 178(3-4): 457-482.
DOI:10.1016/j.ecolmodel.2004.01.016 |
Zhu J R, Gu Y L, Wu H. 2013. Determination of the period not suitable for taking demestic water supply to the Qingcaosha reservoir near Changjiang River Estuary. Oceanologia et Limnologia Sinica, 44(5): 1138-1145.
(in Chinese with English abstract) |
Zhu J R, Wu H, Li L, et al. 2010. Saltwater intrusion in the Changjiang Estuary in the extremely drought hydrological year 2006. Journal of East China Normal University (NaturalScience), (4): 1-6, 4: 1-6, 25.
(in Chinese with English abstract) |
Zhu J R, Wu H, Li L. 2015. Hydrodynamics of the Changjiang estuary and adjacent seas. In: Zhang J ed. Ecological Continuum from the Changjiang (Yangtze River) Watersheds to the East China Sea Continental Margin. Springer, Cham. p. 19-45.
|
Zhu J R. 2003. Ocean Numerical Calculation Method and Numerical Model. China Ocean Press, Beijing. p.110-160.
(in Chinese)
|