 2022, Vol. 40
Institute of Oceanology, Chinese Academy of Sciences
Article Information
- YU Xinlei, YE Xin, HU Chaoyang, XU Nianjun, SUN Xue
- Sodium acetate can promote the growth and astaxanthin accumulation in the unicellular green alga Haematococcus pluvialis as revealed by a proteomics approach
- Journal of Oceanology and Limnology, 40(5): 2052-2067
- http://dx.doi.org/10.1007/s00343-021-1271-y
Article History
- Received Aug. 18, 2021
- accepted in principle Nov. 3, 2021
- accepted for publication Nov. 22, 2021


The unicellular alga Haematococcus pluvialis (Chlorophyta) is an ideal source of the strong antioxidant astaxanthin, which can reach up to 4.6% of the cell dry weight (Wan et al., 2015). Moreover, astaxanthin from H. pluvialis consists solely of 3S, 3'S-astaxanthin, and its biological activity and safety are significantly superior to those of astaxanthin obtained via chemical synthesis. As a carotenoid compound, astaxanthin has diverse and crucial functions and is widely used in medicine, health care, animal feed, and other industries (Hussein et al., 2006). Culturing H. pluvialis for natural astaxanthin production is a matter of great interest. The astaxanthin yield is determined by the algal cell density and astaxanthin content per cell. Therefore, strategies for increasing biomass and astaxanthin accumulation in this alga are an important research issue. Various approaches, including optimization of the medium, and environmental conditions, have been performed in H. pluvialis (Tripathi et al., 2002; Imamoglu et al., 2009; Nahidian et al., 2018).
Carbon sources are a key factor that influences the biomass and astaxanthin yield of H. pluvialis (Le-Feuvre et al., 2020). Carbon dioxide (CO2) and bicarbonate (HCO3-) are commonly used inorganic carbon sources in microalgal cultivation. Elevated CO2 levels can stimulate the growth and accumulation of lipids and astaxanthin in H. pluvialis (Cheng et al., 2016; Li et al., 2017). In addition to autotrophic growth, H. pluvialis can be grown heterotrophically using organic carbon sources such as acetate, ethanol, and ribose (Wen et al., 2015; Xi et al., 2016; Pang and Chen, 2017). Many investigations have reinforced the view that sodium acetate (NaAc) not only accelerates growth at the green vegetative stage but also promotes astaxanthin accumulation at the red-cyst stage in H. pluvialis (Gong and Chen, 1997; Sarada et al., 2002). However, the mechanism underlying the promoting effect of NaAc on growth and astaxanthin accumulation in H. pluvialis remains unclear.
In recent years, omics approaches have been applied to investigate the alga H. pluvialis; the results can provide complex information on the growth and astaxanthin accumulation of H. pluvialis and help elucidate the mechanism of astaxanthin accumulation. For example, primary metabolites and dynamic metabolic changes during astaxanthin accumulation were illustrated using the metabolomic approach (Su et al., 2014; Hu et al., 2020), and the promoting effects of sucrose and NaAc on astaxanthin accumulation and of high CO2 concentration on algal growth were revealed by transcriptome analysis (He et al., 2018; Ye et al., 2020; Du et al., 2021). The aforementioned two omics technologies revealed the astaxanthin accumulation and algal growth mechanisms at the levels of small-molecule metabolites and global gene transcription, respectively. Proteomics explores protein characteristics at many levels, including the protein expression level, post-translational modification, and protein-protein interactions, which can provide useful information from these perspectives. Wang et al. (2004) identified 70 differentially expressed proteins (DEPs) in H. pluvialis using two-dimensional gel electrophoresis (2D-PAGE), image analysis, and peptide mass fingerprinting, and revealed the initial molecular defense mechanisms in response to the oxidative stress induced by acetate and Fe2+ under high light stress during the early transition of green vegetative cells to red cysts. Tran et al. (2009) identified the function of the DEPs associated with astaxanthin accumulation in oxidative stress induced by sodium orthovanadate in H. lacustris using 2D-PAGE and matrix-assisted laser desorption/ionization time of flight mass spectrometry (MALDI-TOF-MS). In contrast to 2D-PAGE, the recently developed tandem mass tag (TMT) and parallel reaction monitoring (PRM) approaches for proteomics analysis present the advantages of accurate quantification, high sensitivity, and good repeatability (Chen et al., 2018; Wang et al., 2018). However, there are few reported studies on the growth- and astaxanthin accumulation-promoting mechanism of acetate at the green vegetative stage of the microalga H. pluvialis by proteomics methods.
In our previous work, 1.86-g/L NaAc was shown to be the optimal concentration for H. pluvialis culture by response surface methodology, and the algal growth rate was increased to 2.33-fold compared to that in the control without NaAc. Here, TMT was first used to identify and quantify the global protein profiles of H. pluvialis after NaAc application, and PRM was then conducted to validate specific target proteins or peptides. Thereafter, enzyme activity and other physicochemical parameters were examined to verify the proteomics results. This work aims to explore the key metabolic pathways of acetate in the global protein profiles of H. pluvialis and to reveal the mechanism by which NaAc promotes algal growth, which will provide useful information for microalgal cultivation.
2 MATERIAL AND METHOD 2.1 Algal cultivation and experimental designHaematococcus pluvialis strain NBU489 was obtained from the Key Laboratory of Marine Biotechnology of Zhejiang Province in Ningbo University. The basic medium used for algal cultivation was NBM3# medium, and the initial cell density was approximately 0.4×10⁵ cells/mL. The algae were cultured under a 40-μmol/(m2·s) light density with a light/dark cycle of 12 h: 12 h at 25±0.5 ℃.
Based on the cell density and algal status, one control (CK) and two NaAc-treated groups were designed, each with three replicates. In the CK group, the algae were cultivated without NaAc addition and harvested on day 3. In the two NaAc-treated groups, the algae were cultivated with the addition of 1.86-g/L NaAc and harvested on day 2 (NaAc2 group) or day 5 (NaAc5 group). The cell densities of the CK and NaAc2 groups were approximately 0.8 × 10⁵ cells/mL, and some algal cells began to accumulate astaxanthin in the NaAc5 group.
2.2 Cell morphology observationThree milliliters of culture of H. pluvialis were collected and centrifuged at 1 500×g for 5 min from the three groups, and the algal precipitate was resuspended in 300-μL fresh medium. The concentrated algal solution was dropped on a glass slide, and the cell morphology and mobility were observed, recorded and photographed at 400 times magnification using a CX21FS1 microscope (OLYMPUS, Japan).
2.3 Physiochemical parameter determinationThe algal cells were centrifuged and dried for 48 h by vacuum freeze drying. After that, the algal samples were powdered and accurately weighed, the biomass was recorded. Two milliliters of algal samples were collected, and a Clark-type oxygen electrode (Hansatech, UK) was used to measure the net photosynthetic rate according to Zhuo et al. (2019). Likewise, a 10-mL culture of H. pluvialis was harvested for nitrate content measurement according to the ultraviolet spectrophotometry method (Zhao, 2014).
Twenty milligrams of freeze-dried algal powder was dissolved in methanol and then assayed for chlorophyll and carotenoid contents according to Cheng et al. (2016). Astaxanthin content was measured according to the method described by Ye et al. (2021).
Approximately 0.1-g samples were weighed and ground into fine powder in liquid nitrogen. Then, the algal powders were dissolved in 4-mL phosphate buffered saline (pH 7.4) and centrifuged at 4 000×g for 10 min at 4 ℃. Finally, the supernatant was used to measure the total carbohydrate content using a kit from Suzhou Keming Biotechnology Co., Ltd., to assay the protein concentration via the bicinchoninic acid (BCA) method (Walker, 1994), and to determine the total lipid content by the vanillin method using colorimetry (Cheng et al., 2011).
2.4 Carbohydrate and nitrogen enzyme activity determinationThe algal samples were harvested to assay the activities of carbohydrate and nitrogen metabolism enzymes. The activities of citrate synthase (CS), isocitrate dehydrogenase (IDH), α-ketoglutarate dehydrogenase (α-KGDH), and glutamate synthase (GS) were measured using kits from Suzhou Keming Biotechnology Co., Ltd. Nitrate reductase (NR) activity was assayed according to the instructions of a kit from Nanjing Jiancheng Bioengineering Institute.
2.5 Protein extraction and trypsin digestionThe algal samples were ground into a fine powder in liquid nitrogen, and the powders were then dissociated with 400 μL of lysis buffer (8-mol/L urea, 10-mmol/L dithiothreitol, 3-μmol/L trichostatin A, a 1% protease inhibitor cocktail, 1% Triton-100, 50-mmol/L nicotinamide, and 2-mmol/L ethylene diamine tetraacetic acid (EDTA)). After ultrasonic treatment at 20% power 30 times (each for 3 s at 10-s interval) at 4 ℃ and centrifugation at 20 000×g for 10 min, the supernatant was processed with 20% trichloroacetic acid for 2 h. After centrifugation, the precipitate was washed three times with precooled acetone and redissolved in 8-mol/L urea. The protein concentration was also determined via the BCA method.
The protein solution was incubated with 5-mmol/L dithiothreitol for 30 min at 56 ℃. Then, 11-mmol/L iodoacetamide was added to the solution, followed by alkylation for 15 min at 25 ℃ in the dark. The samples were diluted to a urea concentration of less than 2 mol/L using 100-mmol/L triethylammonium bicarbonate (TEAB). Finally, trypsin was added at a 1:50 trypsin-to-protein mass ratio for the first digestion overnight and then at a 1:100 trypsin-to-protein mass ratio for a second 4-h digestion.
2.6 TMT labeling and HPLC fractionationPeptides were desalted in a Strata X C18 solid phase extraction (SPE) column (Phenomenex). After vacuum freeze-drying, the desalted peptides were dissolved in 0.5-mol/L TEAB, and the TMT reagent was then thawed in acetonitrile. The peptide mixtures were incubated for 2 h (at 25 ℃), desalted and dried by vacuum freeze drying.
The tryptic peptides were fractionated by high-pH reverse-phase high performance liquid chromatography (HPLC) using an Agilent 300Extend C18 column (4.6 mm×250 mm, 5 μm). Briefly, the peptides were first separated into 60 fractions in a gradient of 8% to 32% acetonitrile (pH 9.0) over 1 h. Then, these fractions were combined into 18 fractions and dried by vacuum freeze-drying.
2.7 LC-MS/MS analysisTryptic peptides were separated with an EASYnLC 1000 ultra performance liquid chromatography (UPLC) system. Mobile phase A consisted of a 0.1% formic acid and 2% acetonitrile aqueous solution, and mobile phase B consisted of a 0.1% formic acid and 90% acetonitrile aqueous solution. The gradient was as follows: an increase in mobile phase B from 6% to 23% over 26 min, 23% to 35% in 8 min, and 35% to 80% over 3 min, followed by holding at 80% for the last 3 min; the constant flow rate was 400 nL/min.
The peptides were subjected to treatment with a nanospray ionization (NSI) source, followed by tandem mass spectrometry (MS/MS) in a Q ExactiveTM Plus system coupled online to a UPLC system. The applied electrospray voltage was 2.0 kV, and the peptide precursors and their secondary fragments were detected in the Orbitrap. The scan range of first-order MS was set at 350 to 1 800 m/z for full scans, and the resolution was 70 000.
The scan range of second-order MS was fixed at 100 m/z for full scans, and the resolution was 17 500. The data were collected by a data-dependent acquisition (DDA) program. The automatic gain control (AGC) and signal threshold were set at 50 000 and 10 000 ions/s, respectively. The maximum injection time was 200 ms, with 30-s dynamic exclusion.
2.8 Protein identification and screening of DEPsThe resulting second-order MS data were processed using the MaxQuant search engine (v.1.5.2.8). Tandem mass spectra were searched against the Chlamydomonas-reinhardtii-Volvox-carteri-f.-nagariensis-combine-20190816 database (71 688 sequences). A reverse database and common pollution libraries were added to the database to calculate the false discovery rate (FDR) caused by random matching and decontamination, respectively. Trypsin/P was specified as the cleavage enzyme, allowing up to 2 missing cleavages. The minimum peptide length and maximum peptide modification were set at 7 and 5 amino acid residues, respectively. The mass tolerance for precursor ions was set to 20×10-6 in the first search and 5×10⁻⁶ in the main search, and the mass tolerance for fragment ions was 0.02 Da. TMT-10plex was set as the quantitative method. The FDR was adjusted to < 1% for the identification of protein and peptide-spectrum matches (PSM).
The DEPs were defined according to the criteria of P < 0.05 and a fold change ≥1.5 or ≤0.67. The subcellular localization of the DEPs was predicted with WoLF PSORT (v.0.2).
2.9 Protein annotation and enrichment analysisProteins were annotated according to the Gene Ontology (GO) and Eukaryotic Orthologous Groups of proteins (KOG) functional classifications and Kyoto Encyclopedia of Genes and Genomes (KEGG) pathways. The GO proteome annotation was derived from the UniProt-GOA database (http://www.ebi.ac.uk/GOA/), and InterProScan (v.5.14-53.0) software was used to annotate proteins that were not annotated in the UniProt-GOA database. The DEPs were classified and counted in the KOG database (http://eggnog.embl.de). KAAS (v.2.0) was used to annotate the protein KEGG database, and KEGG Mapper (v.2.5) was then used to map the annotation results in the KEGG pathway database.
Functional enrichment: A two-tailed Fisher's exact test was employed to test the enrichment of DEPs against all proteins. GO and KEGG pathways with a corrected P < 0.05 were considered significant.
Enrichment-based clustering: Cluster membership was visualized in a heat map using the "heatmap.2" function from the "gplots" R package (v.2.0.3).
2.10 PRM validationAfter protein extraction and trypsin digestion, PRM analysis was performed according to Li et al. (2019). A Q-Exactive Plus mass spectrometer (Thermo Fisher Scientific, Waltham, MA) was used, and 22 DEPs identified from the TMT data were tested for reliability via the PRM approach.
2.11 Data analysisThe data are presented as the mean±standard deviation (SD) (n=3). Statistical analyses were carried out by one-way ANOVA using SPSS 22.0, in which the level of significance was defined at P < 0.05.
3 RESULT 3.1 Comparisons of algal morphology and statusUnder an optical microscope, the algal cells of H. pluvialis were observed to be motile and vigorous in the CK and NaAc2 groups; however, approximately 20% of algal cells in the NaAc5 group had turned red inside, which indicated that they began to accumulate astaxanthin, and thick-walled spores appeared. These results showed that NaAc addition could induce the accumulation of astaxanthin in H. pluvialis after long-term cultivation (Fig. 1).

|
| Fig.1 Light microscopy images of H. pluvialis cells in the CK (a), NaAc2 (b), and NaAc5 (c) groups |
The growth rate of H. pluvialis was increased significantly after NaAc addition. The dry weight of the algae reached 0.22 g/L in the NaAc5 group, 3.67-, and 2.75-fold of the CK and NaAc2 groups (Table 1). However, the dry weight showed no significant difference between the CK and NaAc2 groups.
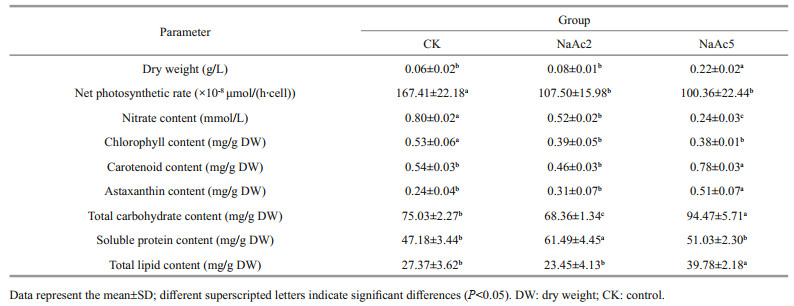
The net photosynthetic rate of H. pluvialis was depressed after NaAc addition (Table 1). The net photosynthetic rates in the two NaAc-addition groups were 64.21% and 59.95% of that in the CK group (P < 0.05), and the net photosynthetic rates of the NaAc2 and NaAc5 groups were not significantly different.
The utilization of nitrate was promoted after NaAc addition. The nitrate contents in the NaAc2 and NaAc5 groups were decreased to 0.65- and 0.30-fold of the control level, respectively (Table 1). Nitrate consumption was increased with culture time, e.g., the observed consumption rates were 14.52% and 48.18% on day 2 and 33.00% and 75.91% on day 5 in the control and NaAc-treated groups, respectively (Fig. 2a).

|
| Fig.2 Changes of nitrate utilization (a) and carbohydrate and nitrogen enzyme activity (b) at the green vegetative stage in H. pluvialis Data represent the mean SD; different letters represent significant differences (P < 0.05). CS: citrate synthase; IDH: isocitrate dehydrogenase; α-KGDH: α-ketoglutarate dehydrogenase; GS: glutamate synthase; NR: nitrate reductase. |
The addition of NaAc also significantly affected the pigment content of H. pluvialis (Table 1). Due to the utilization of acetate for facultative heterotrophism, the chlorophyll content in the two NaAc-addition groups exhibited a 0.26- and 0.28-fold decrease relative to the CK group, but no significant change was observed between the NaAc2 and NaAc5 groups. In contrast to chlorophyll, the carotenoid content in the NaAc5 group was higher than that in the CK group by 0.44-fold, but no variation in carotenoid content was observed between the CK and NaAc2 groups. The astaxanthin content exhibited a 1.13-fold increase in the NaAc5 group compared with the CK group, and no difference in astaxanthin content was observed between the CK and NaAc2 groups. The astaxanthin accumulation results were consistent with the observation that red algal cells appeared only in the NaAc5 group (Fig. 1).
In Table 1, the total carbohydrate content varied among the three groups in order NaAc5 group > CK group > NaAc2 group. The soluble protein content of the NaAc2 group was increased by 0.30-fold relative to that of the CK group, but there was no significant difference between the CK and NaAc5 groups. The total lipid contents were 27.37 and 23.45 mg/g dry weight (DW) in the CK and NaAc2 groups, respectively; however, compared with the CK group, the lipid content in the NaAc5 group was increased notably by 0.45-fold.
3.3 Changes in carbohydrate and nitrogen enzyme activityCompared to the results for the CK group, the activities of CS, IDH, and α-KGDH were increased to 1.41-, 3.79-, and 2.28-fold in the NaAc2 group, respectively, and similar increases were observed in the NaAc5 group (Fig. 2b). Nevertheless, no significant difference in enzyme activity was observed between the two NaAc-treated groups. These results demonstrated that the tricarboxylic acid (TCA) cycle was up-regulated by NaAc according to enzyme activity levels.
Similarly, the activities of GS and NR, which are related to amino acid and nitrate metabolism, were assayed. Relative to the CK group, GS activity exhibited a slight increase (0.32-fold) in the NaAc2 group and no change in the NaAc5 group, but no significant difference in protein level was found between the two NaAc-treated groups. NR activity was increased to 2.39-fold in the NaAc2 group and decreased to 0.67-fold in the NaAc5 group compared to the CK group. Although the activities and protein levels of these two enzymes differed on day 2, they were consistent on day 5 of the culture.
3.4 Principal component analysis (PCA) and protein identificationIn this study, PCA showed that the three replicates from the same group were clustered together, especially for the CK group (Fig. 3a). Samples in the NaAc2 and NaAc5 groups were separated from those in the CK group, and samples in the NaAc2 group were also clearly separated from those in the NaAc5 group.

|
| Fig.3 Two-dimensional PCA scatter diagram (a) and distribution of the DEPs in pairwise comparison groups (b) |
A total of 259 875 spectra were generated, of which 75 315 matched the database, accounting for 28.98%. Then, 32 407 of the spectra were identified as representing unique peptides, 6 338 proteins were identified, and 5 331 were quantifiable proteins.
Compared to the control group, 104 up-regulated and 154 down-regulated proteins were identified in the NaAc2 group, and 152 up-regulated and 165 down-regulated proteins were identified in the NaAc5 group. Additionally, 69 up-regulated and 99 down-regulated proteins were obtained in the NaAc2 vs. NaAc5 comparison (Fig. 3b).
3.5 Subcellular localization of the DEPsIn the subcellular location results, a majority of the DEPs were concentrated in the chloroplast (Supplementary Fig.S1). In detail, chloroplast-localized proteins accounted for 55.43%, 50.79%, and 58.93% of the DEPs in the CK vs. NaAc2, CK vs. NaAc5, and NaAc2 vs. NaAc5 comparisons, respectively. The other DEPs were abundant in the nucleus, cytoplasm or mitochondria.
3.6 GO classification of the DEPsThe GO classification of the DEPs was performed according to the biological process, cellular component, and molecular function categories (Supplementary Fig.S2). Compared to the CK group, in the biological process category, the top four terms associated with the DEPs in the NaAc2 group were "Organic substance metabolic process" (35), "Cellular metabolic process" (33), "Primary metabolic process" (30) and "Nitrogen compound metabolic process" (22); similar results were obtained in the NaAc5 group except that the number of DEPs differed. In contrast to the results for the other two comparisons, the "Response to chemical stimulus" GO term entered into the top four terms in the NaAc2 vs. NaAc5 comparison. In the cellular component category, the top three terms were "Intracellular", "Intracellular organelle", and "Membrane-bounded organelle", which showed different numbers in the three pairwise comparisons. In the category of molecular function, the dominant terms were "Transferase activity" (15) in the CK vs. NaAc2 comparison, "Oxidoreductase activity" (20) in the CK vs. NaAc5 comparison, and "Protein binding" (11) in the NaAc2 vs. NaAc5 comparison.
3.7 KOG classification of the DEPsAccording to the KOG analysis, the DEPs were mainly classified into 18 entries in the CK vs. NaAc2 comparison and 19 entries in the other two comparisons (Supplementary Fig.S3). Compared to the CK group, in the NaAc2 group, the DEPs were concentrated in the "Amino acid transport and metabolism" (19), "Posttranslational modification, protein turnover, chaperones" (13), and "Lipid transport and metabolism" (12) categories; in the NaAc5 group, the top 3 DEPs were related to "Posttranslational modification, protein turnover, chaperones" (21), "Energy production and conversion" (18), and "Amino acid transport and metabolism" (18). In the NaAc2 vs. NaAc5 comparison, the dominant DEPs were assigned to "Posttranslational modification, protein turnover, chaperones" (9), "Organic ion transport and metabolism" (8), and "Energy production and conversion" (8).
3.8 KEGG pathway enrichment analysis of the DEPsKEGG is an information network that connects the interactions of known molecules, such as metabolic pathways, complexes, and biochemical reactions. In the NaAc2 group (Fig. 4a), a large number of DEPs were enriched in the "Pyruvate metabolism" (10), "Glyoxylate and dicarboxylate metabolism" (8), and "Citrate cycle (TCA cycle)" (7) pathways relative to the CK group. In addition, 6 and 4 DEPs were associated with "Carbon fixation in photosynthetic organisms" and "Fatty acid degradation", respectively.

|
| Fig.4 Enrichment KEGG analysis of the DEPs a. CK vs. NaAc2; b. CK vs. NaAc5; c. NaAc2 vs. NaAc5. The color of each bubble indicates the P value of the enrichment significance, and the size of the bubble represents the number of DEPs in the pathway. |
Relative to the CK group, the DEPs in the NaAc5 group were concentrated in the "Pyruvate metabolism" (10), "Glyoxylate and dicarboxylate metabolism" (9), "TCA cycle" (8), and "Carbon fixation in photosynthetic organisms" (6) pathways (Fig. 4b). Moreover, 9 DEPs were enriched in "Nitrogen metabolism", but no proteins were associated with "Fatty acid degradation", which differed from the results for the NaAc2 group.
Relative to the two other comparisons, the KEGG pathways and DEP numbers in the NaAc2 vs. NaAc5 comparison were reduced (Fig. 4c). Nevertheless, similar to the results of the CK vs. NaAc5 comparison, the top four pathways were "Nitrogen metabolism" (7), "Carbon fixation in photosynthetic organisms" (5), "Pyruvate metabolism" (5), and "TCA cycle" (4).
Figure 4 showed that the fold enrichment of most DEPs was concentrated at approximately 4. In the CK vs. NaAc2 comparison, the "Synthesis and degradation of ketone bodies" category showed the highest fold enrichment, although it only contained one protein. In the CK vs. NaAc5 and NaAc2 vs. NaAc5 comparisons, the "Non-homologous end-joining" and "Nitrogen metabolism" pathways were the most enriched.
3.9 KEGG pathway clustering analysis of the DEPsThe DEPs of each group in the KEGG pathway were clustered using the hierarchical clustering method according to the P value of Fisher's exact test obtained through enrichment analysis (Fig. 5).

|
| Fig.5 KEGG pathway clustering analysis of the DEPs The pairwise comparison groups are presented in the horizontal direction, and the enrichment pathways are listed in the vertical direction. The blocks with red color indicate a high degree of enrichment, and those with blue color indicate a low degree of enrichment. |
Relative to the CK group, in the NaAc2 group, the up-regulated proteins were concentrated in pathways related to carbohydrate, amino acid, and lipid metabolism, such as "Glyoxylate and dicarboxylate metabolism", "Arginine and proline metabolism", "Fatty acid degradation", and "TCA cycle"; however, the down-regulated proteins were assigned to the "SNARE interactions in vesicular transport" and "Photosynthesis" pathways; in the NaAc5 group, the up-regulated proteins were significantly enriched in "2-Oxocarboxylic acid metabolism", "Arachidonic acid metabolism", and "Arginine biosynthesis", and the down-regulated proteins were enriched in "Porphyrin and chlorophyll metabolism" and "Nitrogen metabolism". In the NaAc2 vs. NaAc5 comparison, there were generally few up-regulated proteins related to carbohydrate metabolism or amino acid metabolism, and the up-regulated proteins were concentrated in the "Non-homologous end-joining" and "DNA replication" pathways, while the down-regulated proteins were markedly enriched in "Nitrogen metabolism".
3.10 Analysis of the DEPs involved in carbohydrate metabolismThe up-regulated proteins in the NaAc2 group were mostly enriched in pathways correlated with carbohydrate metabolism, compared to the CK group. Four proteins in the TCA cycle were up-regulated (Fig. 6), including citrate synthase (CL2138.Contig3), aconitate hydratase (CL11.Contig3), fumarate hydratase (CL1975.Contig5), and malate dehydrogenase (Unigene1 1871), with increases of 3.00-, 1.62-, 2.05-, and 1.70-fold, respectively. Two proteins in the glyoxylate cycle, isocitrate lyase (ICL) (Unigene7646), and malate synthase (MS) (Unigene2838), showed increases of 8.03- and 3.93-fold, respectively.

|
| Fig.6 Analysis of the DEPs involved in glycolysis, TCA cycle, and glyoxylate cycle The empty, red, and blue boxes represent no significant change, up-regulation, and down-regulation, respectively. "Phosphate" in the metabolites is abbreviated as "P". The enzyme numbers and their corresponding names are presented as follows: 1.2.1.12, glyceraldehyde-3-phosphate dehydrogenase; 2.7.1.40, pyruvate kinase; 2.3.3.1, citrate synthase; 4.2.1.3, aconitate hydratase; 1.1.1.42, isocitrate dehydrogenase; 6.2.1.4, 6.2.1.5, succinyl-CoA synthetase alpha subunit; 4.2.1.2, fumarate hydratase; 1.1.1.37, malate dehydrogenase; 4.1.3.1, isocitrate lyase; 2.3.3.9, malate synthase. The solid and dashed arrows indicate one-step and multi-step reaction, respectively. – means no significant change. |
Compared to the CK group, similar to the results of the NaAc2 group, 6 proteins in the TCA cycle and glyoxylate cycle were up-regulated in the NaAc5 group, but with different fold changes; in addition to some of the same proteins found in the NaAc2 group, the NaAc5 group included some unique up-regulated proteins, such as isocitrate dehydrogenase (Unigene346) and succinyl-CoA synthetase alpha subunit (Unigene616), involved in the TCA cycle, which presented 1.61- and 1.59-fold increases, respectively. Pyruvate kinase (CL3469.Contig3) and glyceraldehyde-3-phosphate dehydrogenase (CL1670.Contig1), which are involved in glycolysis, were also up-regulated in only the NaAc5 group relative to the CK group.
In contrast to the results in the other two comparisons, there were few DEPs correlated with carbohydrate metabolism in the NaAc2 vs. NaAc5 comparison, and only 1 of these proteins was involved in glycolysis, 1 in the TCA cycle and 2 in the glyoxylic acid cycle. Among these proteins, glyceraldehyde-3-phosphate dehydrogenase and citrate synthase (CL7281.Contig2) levels were increased by 2.76- and 1.76-fold, respectively; however, ICL and MS levels were decreased by 0.21- and 0.63-fold, respectively, in relation to the control levels.
3.11 Analysis of the DEPs involved in nitrogen metabolismIn the NaAc2 group, 11 proteins involved in amino acid metabolism were up-regulated relative to those in the CK group (Table 2). For example, the protein levels of aspartate aminotransferase (CL4777. Contig1), ornithine aminotransferase (CL6489. Contig1), β-ureidopropionase (Unigene5596), tyrosine decarboxylase 1 (Unigene6997), and prolyl 4-hydroxylase 3 (CL6638.Contig2) were increased by 1.62- to 2.04-fold.

|
In the NaAc5 group, the levels of aspartate aminotransferase, β-ureidopropionase, and argininosuccinate synthase (CL229.Contig3) were up-regulated, showing 1.62-, 1.93-, and 1.74-fold increases, relative to the CK group. The other 7 nitrate metabolism-related proteins were all down-regulated 0.28- to 0.55-fold (Fig. 7), including nitrate transporters (NRTs) (Unigene6215, Unigene6213), NRs (CL7529.Contig2, g55698.t1), and ferredoxin-nitrite reductases (CL1685.Contig1/2/3).

|
| Fig.7 Analysis of the DEPs involved in nitrate metabolism The empty and blue boxes represent no significant change and down-regulation, respectively. The enzyme numbers and their corresponding names are listed as follows: 1.7.7.1, ferredoxin-nitrite reductase; 1.7.7.2, nitrate reductase. NRT: nitrate/nitrite transporter. – means no significant change. |
In total, 8 nitrogen metabolism-related proteins, including one showing up-regulation and 7 showing down-regulation, were screened in the NaAc2 vs. NaAc5 comparison, similar to the results in the NaAc5 group (Fig. 7; Table 2). Moreover, the fold changes of the 8 DEPs were extremely similar in the two aforementioned groups, e.g., argininosuccinate synthase exhibited 1.89- and 1.74-fold up-regulation in the NaAc2 vs. NaAc5 and CK vs. NaAc5 comparisons, respectively.
3.12 Analysis of the DEPs involved in lipid metabolismRelative to the CK group, in the NaAc2 group, two acetyl-CoA synthetases (ACSs) (Unigene8294, CL7300.Contig2) associated with acetate utilization and fatty acid synthesis showed increases of 2.19- and 3.49-fold, respectively (Table 2). Four up-regulated proteins participating in the β-oxidation of fatty acids were screened. Among these proteins, acyl-CoA oxidase (g57168.t1), enoyl-CoA hydratase (Unigene6358), acetyl-CoA acyltransferase (Unigene3345), and enol-CoA delta isomerase 2 (CL1689.Contig5) were all significantly up-regulated, with increases of 1.52- to 2.71-fold.
Compared to the CK group, in the NaAc5 group, two ACSs were up-regulated, similar to the results for the NaAc2 group. Moreover, biotin carboxylase (Unigene3466), a key enzyme involved in the synthesis of fatty acids, was significantly up-regulated (2.61-fold). Although acyl-CoA oxidase and enoyl-CoA hydratase were up-regulated, no expression difference was found for acetyl-CoA acetyltransferase and enoyl-CoA delta isomerase 2, which are involved in fatty acid degradation.
In the NaAc2 vs. NaAc5 comparison, only two lipid metabolism-related proteins were screened. One of these proteins was biotin carboxylase, showing 2.73-fold up-regulation, and the other was enoyl-CoA delta isomerase 2, showing 0.61-fold down-regulation.
3.13 Analysis of the DEPs involved in photosynthesisIn the CK vs. NaAc2 comparison, all but one of the enriched DEPs correlated with photosynthesis and photosynthetic antenna proteins were down-regulated (Table 2). These depressed proteins included 5 photosystem Ⅱ proteins and 4 chlorophyll a/b binding proteins, which were all down-regulated. In contrast to the aforementioned 9 down-regulated proteins, magnesium-protoporphyrin Ⅸ monomethyl ester [oxidative] cyclase 1 (MPEC) (CL5912.Contig5) was stimulated by NaAc-addition.
Among the 8 DEPs screened in the CK vs. NaAc5 comparison, which differed from those in the CK vs. NaAc2 comparison, most (6) were down-regulated, including prochloroplast reductase (CL8181. Contig2). However, MPEC was up-regulated, similar to what was observed in the CK vs. NaAc2 comparison.
In the NaAc2 vs. NaAc5 comparison, 5 photosynthesis-related DEPs were enriched. Among these DEPs, the photosystem Ⅱ 10-kDa polypeptide (Unigene1361) and two chlorophyll a/b binding proteins CP26 (CL4539.Contig1/2) were increased by 2.49-, 1.76-, and 1.69-fold, respectively. However, although MPEC was up-regulated in the other two comparisons, it was slightly down-regulated in the NaAc5 group relative to the NaAc2 group.
3.14 Analysis of the DEPs involved in other metabolic pathwaysAdditional to these DEPs participating in the aforementioned pathways, 20 other DEPs were screened in the two NaAc-treated groups (Supplementary Table S1). Among them, some were stimulated after NaAc addition, such as tropinone reductase and glutamine-dependent "uncharacterized protein synthase", while others were depressed after NaAc supplementation, such as syntaxin-61 and vegetative cell wall protein gp1.
3.15 PRM validation resultsConsidering protein abundance and characteristics, twenty-one proteins were chosen to verify the TMT results via the PRM approach. The results showed that most of the fold changes determined by PRM were greater than those determined by TMT, which might be due to the compression effect of TMT quantitation (Mertins et al., 2016). To compare the consistency of the two methods, we defined fold changes between 3 and 1/3 as concordant between the two analyses. Based on this criterion, only 7 sets of PRM data out of 63 sets in the three pairwise comparison groups were considered to differ from the TMT data (Supplementary Table S2). In other words, the changes in approximately 88.89% of DEPs identified from the TMT results were confirmed by PRM, indicating that the TMT data are credible.
4 DISCUSSIONNaAc is a common source of organic carbons used in microalgal cultivation and promotes the growth of microalgae (Zheng et al., 2017; Liu et al., 2018). Relative to growth, there has been a greater research focus on lipid or astaxanthin accumulation following acetate treatment in the alga H. pluvialis (He et al., 2018; Zhang et al., 2019). Nevertheless, the influence of the acetate-mediated mixotrophic culture mode on carbohydrate accumulation in microalgae remains unclear (Wang et al., 2016).
4.1 Effect of NaAc on carbohydrate metabolismGlycolysis, which converts glucose into pyruvate, is the initial step in the breakdown of glucose. In this work, only 2 enzymes involved in glycolysis were found to be stimulated in the CK vs. NaAc5 comparison, and none were identified in the CK vs. NaAc2 comparison. The results indicated that glycolysis was only influenced by NaAc on day 5, and the amount of acetyl coenzyme A (acetyl-CoA) produced from pyruvate via glycolysis was low.
Although there was little effect on glycolysis, the presence of NaAc significantly promoted the TCA cycle. At the protein level, the DEPs participating in the TCA cycle were all increased. Additionally, the activity levels of three rate-limiting enzymes, CS, IDH, and α-KGDH, were also significantly enhanced after NaAc addition. These results demonstrated that NaAc could significantly stimulate the TCA cycle in H. pluvialis.
The glyoxylate cycle and TCA cycle share some common intermediate products and enzymes. Glyoxylate bypass is a modification of the TCA cycle that has long been known to be essential for growth under acetate assimilation (Cronan and Laporte, 2005; Lee et al., 2011). ICL and MS are the two crucial enzymes in the glyoxylate cycle. In this study, ICL and MS were notably activated by supplementation with NaAc, indicating the activation of the glyoxylate cycle. However, ICL and MS were down-regulated in the NaAc5 group compared with the NaAc2 group, which implied that the consumption rate of NaAc slowed in the mid-late stage of algal culture.
Here, we focused on acetyl-CoA. Acetyl-CoA is a key product of intermediate metabolism that is closely associated with carbohydrate metabolism. The TCA cycle is responsible for the total oxidation of acetyl-CoA; therefore, the accumulation of acetyl-CoA will accelerate the rate of the TCA cycle (Sakihama et al., 2019). On the other hand, acetyl-CoA can be metabolized through the glyoxylate cycle (Nakazawa, 2017). Acetate supplementation in the medium provides abundant substrates for the production of acetyl-CoA.
4.2 Effect of NaAc on nitrogen metabolismIn this study, the protein levels of aspartate aminotransferase, ornithine aminotransferase, and other nitrogen-related enzymes were up-regulated after NaAc treatment. Aspartate aminotransferase is responsible for the reversible transformation of aspartate and α-ketoglutarate to oxalacetate and glutamate. Thus, this enzyme is crucial in amino acid degradation and biosynthesis. The overexpression of aspartate aminotransferase genes can dramatically increase the contents of amino acids and proteins in rice (Zhou et al., 2009). Ornithine aminotransferase catalyzes the conversion of L-ornithine to glutamate γ-semialdehyde. It has been reported that ornithine aminotransferase is associated with proline biosynthesis under abiotic stresses such as drought and oxidative stress (Roosens et al., 2002; You et al., 2012). It could be speculated that NaAc promoted the metabolism of some amino acids in H. pluvialis to provide amino acids and proteins for the rapid proliferation of algal cells.
Wang et al. (2004) reported that some key proteins involved in nitrogen assimilation were down-regulated by oxidative stress induced by acetate, Fe2+ and excessive light intensity. In this study, GO and KEGG enrichment analysis showed that 5 nitrate metabolism-related proteins were down-regulated only in the CK vs. NaAc5 comparison. Thus, it could be deduced that acetate depressed nitrogen utilization in the late vegetative stage. Considering these results and the obtained nitrate consumption (Fig. 2a), we deduced that the decrease in nitrate content might have been one reason that nitrate transport and assimilation activity were attenuated. Additionally, the rapid depletion of nitrate as the sole nitrogen source resulted in a reduction in cellular viability and the occurrence of nonmotile spores coupled with astaxanthin synthesis. This finding was consistent with the phenomenon that some H. pluvialis cells turned red in the late stage of green vegetative growth after NaAc addition (Ye et al., 2021).
4.3 Effect of NaAc on lipid metabolismAcetate is closely associated with lipid metabolism in microalgae. A 2.0–10.0-g/L NaAc concentration in the media was shown to increase neutral lipid levels by 2.74–5.10 times over the control level in Chlorella pyrenoidosa (Liu et al., 2018). The addition of acetate under high light conditions in H. pluvialis can promote the expression of key genes related to fatty acid elongation (He et al., 2018). In the CK vs. NaAc2 and CK vs. NaAc5 comparisons, approximately 10 DEPs correlated with lipid metabolism were found according to the KOG classification results of this study (Supplementary Fig.S3), and a strong enrichment of unsaturated fatty acid biosynthesis together with protein up-regulation was observed in the KEGG analysis.
In the lipid synthesis pathway, two ACSs were dramatically up-regulated by NaAc treatment; the physiological role of ACS enzymes is to transform acetate to acetyl-coenzyme A (Starai and Escalante-Semerena, 2004). Abundant acetyl-CoA promotes lipid synthesis in cells (Vorapreeda et al., 2012). Therefore, it can be concluded that NaAc stimulated lipid accumulation. In addition to the two ACSs, 3 other lipid synthesis-related enzymes were up-regulated, especially biotin carboxylase, in the NaAc5 group relative to the CK group. Biotin carboxylase is a key subunit of acetyl-CoA carboxylase (ACC), one rate-limiting enzyme in fatty acid synthesis (Slabas and Fawcett, 1992). Thus, lipid accumulation observed on day 5 following NaAc supplementation in H. pluvialis might be partially attributed to the up-regulation of biotin carboxylase. Compared to the CK group, four enzymes involved in β-oxidation in fatty acid degradation (acyl-CoA oxidase, enoyl-CoA hydratase, acetyl-CoA acyltransferase, and enoyl-CoA delta isomerase 2) were up-regulated in the NaAc2 group, and the first two were also up-regulated in the NaAc5 group (Table 2). Therefore, fatty acid degradation in H. pluvialis seemed to be more predominant in the early stage (day 2) than on day 5.
This difference in lipid accumulation was supported by the total lipid content; that is, the total lipid content in the NaAc5 group was 0.45-fold higher than the levels in the control and NaAc2 groups, and the last two groups showed no significant difference from each other (Table 1). Even more importantly, lipid accumulation in the late stage after NaAc addition was due to nitrogen depletion, as deduced from the nitrate assimilation curve (Fig. 2a). Many studies have demonstrated that nitrogen starvation significantly aggravates lipid accumulation in microalgae, as found in Chlorella vulgaris, Neochloris oleoabundans, and Scenedesmus obliquus (Breuer et al., 2012; Benvenuti et al., 2015). The present work demonstrated that acetate supplementation accelerated nitrogen consumption. It has been reported that nitrogen deprivation coupled with acetate addition can enhance lipid productivity, with a maximum productivity of 23% or 24% being observed in two Chlorella species (Bharte and Desai, 2019).
4.4 Effect of NaAc on photosynthesisIn general, photosynthesis is attenuated after the application of an organic carbon source. Zhang et al. (2019) found that the photosynthesis of H. pluvialis was inhibited by exogenous NaAc through the analysis of chlorophyll fluorescence parameters and photosynthetic rates. In the aforementioned section, some key proteins involved in photosynthesis are also down-regulated by the oxidative stress induced by acetate, Fe2+, and excessive light intensity (Wang et al., 2004). In this study, after NaAc addition, the chlorophyll content of H. pluvialis was decreased, and the net photosynthetic rate slowed, which was consistent with the results of proteomics studies on photosynthesis. Moreover, approximately 50.79%–58.93% of the DEPs were concentrated in chloroplasts (Supplementary Fig.S1), indicating that photosynthesis-related metabolism was greatly affected by NaAc. Among the 16 screened differentially photosynthesis-related proteins, 12 were down-regulated, reflecting the weakening of photosynthesis. Photosystem Ⅱ is one of the most important complexes in photosynthesis. Chlorophyll a/b binding proteins mainly regulate the distribution, absorption, and transmission of light energy during photosynthesis (Ganeteg et al., 2004). Here, all photosystem Ⅱ proteins and chlorophyll a/b binding proteins were down-regulated in the CK vs. NaAc2 and CK vs. NaAc5 comparisons. In addition to the aforementioned proteins, protochlorophyllide reductase, which is responsible for catalyzing the conversion of prochloroplasts into chloroplasts in the presence of light and nicotinamide adenine dinucleotide phosphate (NADPH), was significantly reduced only in the CK vs. NaAc5 comparison. Therefore, it could be concluded that acetate accelerated heterotrophic growth and inhibited photosynthesis in H. pluvialis.
In contrast to the most down-regulated chloroplast-or photosynthesis-related proteins, MPEC was notably up-regulated in the presence of NaAc. As one of the pivotal enzymes in chlorophyll biosynthesis, MPEC mainly catalyzes the conversion of magnesium protoporphyrin Ⅸ monomethyl ester into divinyl protochlorophyllide under conditions where NADPH and O2 are available (Bollivar and Beale, 1996). Here, it was unclear whether MEPC was stimulated by NaAc. However, the MPEC protein level in the NaAc5 group was depressed compared to that in the NaAc2 group, indicating that chlorophyll synthesis was relatively weakened in the late vegetative stage. This phenomenon might be attributed to the increase in algal density resulting in insufficient light intensity.
5 CONCLUSIONBy exploring the role and mechanism of NaAc in H. pluvialis using methods that combined physiochemical parameter measurement, TMT labeling and PRM validation, it is shown that the growth, nitrate consumption rate, astaxanthin content, carbohydrate content, lipid content, and activities of three carbohydrate metabolism enzymes were all promoted after the addition of NaAc. Most of the DEPs involved in the TCA cycle and amino acid and lipid metabolism pathways were up-regulated by NaAc application. However, the net photosynthetic rate, chlorophyll content, and almost all photosynthesis-related proteins were depressed after NaAc supplementation. Nitrate metabolism was also down-regulated with increasing NaAc treatment time in H. pluvialis. In conclusion, NaAc could promote the growth of H. pluvialis by stimulating carbohydrate and nitrogen metabolism, energy utilization, and lipid synthesis in this alga.
6 DATA AVAILABILITY STATEMENTThe datasets generated and/or analyzed during the current study are available from the corresponding author on reasonable request.
Electronic supplementary material
Supplementary material (Supplementary Tables S1–S2 and Figs.S1–S3) is available in the online version of this article at https://doi.org/10.1007/s00343-021-1271-y.
Benvenuti G, Bosma R, Cuaresma M, Janssen M, Barbosa M J, Wijffels R H. 2015. Selecting microalgae with high lipid productivity and photosynthetic activity under nitrogen starvation. Journal of Applied Phycology, 27(4): 1425-1431.
DOI:10.1007/s10811-014-0470-8 |
Bharte S, Desai K. 2019. The enhanced lipid productivity of Chlorella minutissima and Chlorella pyrenoidosa by carbon coupling nitrogen manipulation for biodiesel production. Environmental Science and Pollution Research, 26(4): 3492-3500.
DOI:10.1007/s11356-018-3757-5 |
Bollivar D W, Beale S I. 1996. The chlorophyll biosynthetic enzyme Mg-protoporphyrin Ⅸ monomethyl ester (oxidative) cyclase (characterization and partial purification from Chlamydomonas reinhardtii and Synechocystis sp. PCC 6803). Plant Physiology, 112(1): 105-114.
DOI:10.1104/pp.112.1.105 |
Breuer G, Lamers P P, Martens D E, Draaisma R B, Wijffels R H. 2012. The impact of nitrogen starvation on the dynamics of triacylglycerol accumulation in nine microalgae strains. Bioresource Technology, 124: 217-226.
DOI:10.1016/j.biortech.2012.08.003 |
Chen Z, Luo L, Chen R F, Hu H H, Pan Y F, Jiang H B, Wan X, Jin H, Gong Y M. 2018. Acetylome profiling reveals extensive lysine acetylation of the fatty acid metabolism pathway in the diatom Phaeodactylum tricornutum. Molecular & Cellular Proteomics, 17(3): 399-412.
DOI:10.1074/mcp.RA117.000339 |
Cheng J, Li K, Yang Z B, Zhou J H, Cen K F. 2016. Enhancing the growth rate and astaxanthin yield of Haematococcus pluvialis by nuclear irradiation and high concentration of carbon dioxide stress. Bioresource Technology, 204: 49-54.
DOI:10.1016/j.biortech.2015.12.076 |
Cheng Y S, Zheng Y, VanderGheynst J S. 2011. Rapid quantitative analysis of lipids using a colorimetric method in a microplate format. Lipids, 46(1): 95-103.
DOI:10.1007/s11745-010-3494-0 |
Cronan J E Jr, Laporte D. 2005. Tricarboxylic acid cycle and glyoxylate bypass. EcoSal Plus, 1(2): 1-23.
DOI:10.1128/ecosalplus.3.5.2 |
Du F C, Hu C Y, Sun X, Xu N J. 2021. Transcriptome analysis reveals pathways responsible for the promoting effect of sucrose on astaxanthin accumulation in Haematococcus pluvialis under high light condition. Aquaculture, 530: 735757.
DOI:10.1016/j.aquaculture.2020.735757 |
Ganeteg U, Külheim C, Andersson J, Jansson S. 2004. Is each light-harvesting complex protein important for plant fitness?. Plant Physiology, 134(1): 502-509.
DOI:10.1104/pp.103.033324 |
Gong X D, Chen F. 1997. Optimization of culture medium for growth of Haematococcus pluvialis. Journal of Applied Phycology, 9(5): 437-444.
DOI:10.1023/A:1007944922264 |
He B X, Hou L L, Dong M M, Shi J W, Huang X Y, Ding Y T, Cong X M, Zhang F, Zhang X C, Zang X N. 2018. Transcriptome analysis in Haematococcus pluvialis: astaxanthin induction by high light with acetate and Fe2+. International Journal of Molecular Sciences, 19(1): 175.
DOI:10.3390/ijms19010175 |
Hu C Y, Cui D D, Sun X, Shi J X, Xu N J. 2020. Primary metabolism is associated with the astaxanthin biosynthesis in the green algae Haematococcus pluvialis under light stress. Algal Research, 46: 101768.
DOI:10.1016/j.algal.2019.101768 |
Hussein G, Sankawa U, Goto H, Matsumoto K, Watanabe H. 2006. Astaxanthin, a carotenoid with potential in human health and nutrition. Journal of Natural Products, 69(3): 443-449.
DOI:10.1021/np050354+ |
Imamoglu E, Dalay M C, Sukan F V. 2009. Influences of different stress media and high light intensities on accumulation of astaxanthin in the green alga Haematococcus pluvialis. New Biotechnology, 26(3-4): 199-204.
DOI:10.1016/j.nbt.2009.08.007 |
Lee Y J, Jang J W, Kim K J, Maeng P J. 2011. TCA cycle-independent acetate metabolism via the glyoxylate cycle in Saccharomyces cerevisiae. Yeast, 28(2): 153-166.
DOI:10.1002/yea.1828 |
Le-Feuvre R, Moraga-Suazo P, Gonzalez J, Martin S S, Henríquez V, Donoso A, Agurto-Muñoz C. 2020. Biotechnology applied to Haematococcus pluvialis Fotow: challenges and prospects for the enhancement of astaxanthin accumulation. Journal of Applied Phycology, 32(6): 3831-3852.
DOI:10.1007/s10811-020-02231-z |
Li K, Cheng J, Ye Q, He Y, Zhou J H, Cen K F. 2017. In vivo kinetics of lipids and astaxanthin evolution in Haematococcus pluvialis mutant under 15% CO2 using Raman microspectroscopy. Bioresource Technology, 244: 1439-1444.
DOI:10.1016/j.biortech.2017.04.116 |
Li X B, Jin L, Pan X H, Yang L, Guo W D. 2019. Proteins expression and metabolite profile insight into phenolic biosynthesis during highbush blueberry fruit maturation. Food Chemistry, 290: 216-228.
DOI:10.1016/j.foodchem.2019.03.115 |
Liu L J, Zhao Y, Jiang X X, Wang X Y, Liang W Y. 2018. Lipid accumulation of Chlorella pyrenoidosa under mixotrophic cultivation using acetate and ammonium. Bioresource Technology, 262: 342-346.
DOI:10.1016/j.biortech.2018.04.092 |
Mertins P, Mani D R, Ruggles K V, Gillette M A, Clauser K R, Wang P, Wang X L, Qiao J W, Cao S, Petralia F, Kawaler E, Mundt F, Krug K, Tu Z D, Lei J T, Gatza M L, Wilkerson M, Perou C M, Yellapantula V, Huang K L, Lin C W, Mclellan M D, Yan P, Davies S R, Townsend R R, Skates S J, Wang J, Zhang B, Kinsinger C R, Mesri M, Rodriguez H, Ding L, Paulovich A G, Fenyö D, Ellis M J, Carr S A. 2016. Proteogenomics connects somatic mutations to signalling in breast cancer. Nature, 534(7605): 55-62.
DOI:10.1038/nature18003 |
Nahidian B, Ghanati F, Shahbazi M, Soltani N. 2018. Effect of nutrients on the growth and physiological features of newly isolated Haematococcus pluvialis TMU1. Bioresource Technology, 255: 229-237.
DOI:10.1016/j.biortech.2018.01.130 |
Nakazawa M. 2017. C2 metabolism in Euglena. In: Schwartzbach S, Shigeoka S eds. Euglena: Biochemistry, Cell and Molecular Biology. Springer, Cham. p. 39-45, https://doi.org/10.1007/978-3-319-54910-1_3.
|
Pang N, Chen S L. 2017. Effects of C5 organic carbon and light on growth and cell activity of Haematococcus pluvialis under mixotrophic conditions. Algal Research, 21: 227-235.
DOI:10.1016/j.algal.2016.12.003 |
Roosens N H, Bitar F A, Loenders K, Angenon G, Jacobs M. 2002. Overexpression of ornithine-δ-aminotransferase increases proline biosynthesis and confers osmotolerance in transgenic plants. Molecular Breeding, 9(2): 73-80.
DOI:10.1023/A:1026791932238 |
Sakihama Y, Hidese R, Hasunuma T, Kondo A. 2019. Increased flux in acetyl-CoA synthetic pathway and TCA cycle of Kluyveromyces marxianus under respiratory conditions. Scientific Reports, 9(1): 5319.
DOI:10.1038/s41598-019-41863-1 |
Sarada R, Bhattacharya S, Bhattacharya S, Ravishankar G A. 2002. A response surface approach for the production of natural pigment astaxanthin from green alga, Haematococcus pluvialis: effect of sodium acetate, culture age, and sodium chloride. Food Biotechnology, 16(2): 107-120.
DOI:10.1081/FBT-120014322 |
Slabas A R, Fawcett T. 1992. The biochemistry and molecular biology of plant lipid biosynthesis. Plant Molecular Biology, 19(1): 169-191.
DOI:10.1007/BF00015613 |
Starai V J, Escalante-Semerena J C. 2004. Acetyl-coenzyme A synthetase (AMP forming). Cellular and Molecular Life Sciences, 61(16): 2020-2030.
DOI:10.1007/s00018-004-3448-x |
Su Y X, Wang J X, Shi M L, Niu X F, Yu X H, Gao L J, Zhang X Q, Chen L, Zhang W W. 2014. Metabolomic and network analysis of astaxanthin-producing Haematococcus pluvialis under various stress conditions. Bioresource Technology, 170: 522-529.
DOI:10.1016/j.biortech.2014.08.018 |
Tran N P, Park J K, Hong S J, Lee C G. 2009. Proteomics of proteins associated with astaxanthin accumulation in the green algae Haematococcus lacustris under the influence of sodium orthovanadate. Biotechnology Letters, 31(12): 1917-1922.
DOI:10.1007/s10529-009-0095-1 |
Tripathi U, Sarada R, Ravishankar G A. 2002. Effect of culture conditions on growth of green alga-Haematococcus pluvialis and astaxanthin production. Acta Physiologiae Plantarum, 24(3): 323-329.
DOI:10.1007/s11738-002-0058-9 |
Vorapreeda T, Thammarongtham C, Cheevadhanarak S, Laoteng K. 2012. Alternative routes of acetyl-CoA synthesis identified by comparative genomic analysis: involvement in the lipid production of oleaginous yeast and fungi. Microbiology, 158(1): 217-228.
DOI:10.1099/mic.0.051946-0 |
Walker J M. 1994. The bicinchoninic acid (BCA) assay for protein quantitation. In: Walker J M ed. Basic Protein and Peptide Protocols. Humana Press, Clifton. p. 5-8, https://doi.org/10.1385/0-89603-268-X:5.
|
Wan M X, Zhang Z, Wang J, Huang J K, Fan J H, Yu A Q, Wang W L, Li Y G. 2015. Sequential heterotrophy-dilution-photoinduction cultivation of Haematococcus pluvialis for efficient production of astaxanthin. Bioresource Technology, 198: 557-563.
DOI:10.1016/j.biortech.2015.09.031 |
Wang L, Wang H L, Chen X R, Xu Y, Zhou T J, Wang X X, Lu Q, Ruan R. 2018. Using Chlorella vulgaris to treat toxic excess sludge extract, and identification of its response mechanism by proteomics approach. Bioresource Technology, 253: 188-196.
DOI:10.1016/j.biortech.2018.01.039 |
Wang S B, Chen F, Sommerfeld M, Hu Q. 2004. Proteomic analysis of molecular response to oxidative stress by the green alga Haematococcus pluvialis (Chlorophyceae). Planta, 220(1): 17-29.
DOI:10.1007/s00425-004-1323-5 |
Wang Y, Chiu S Y, Ho S H, Liu Z, Hasunuma T, Chang T T, Chang K F, Chang J S, Ren N Q, Kondo A. 2016. Improving carbohydrate production of Chlorella sorokiniana NIES-2168 through semi-continuous process coupled with mixotrophic cultivation. Biotechnology Journal, 11(8): 1072-1081.
DOI:10.1002/biot.201500270 |
Wen Z W, Liu Z Y, Hou Y Y, Liu C F, Gao F, Zheng Y B, Chen F J. 2015. Ethanol induced astaxanthin accumulation and transcriptional expression of carotenogenic genes in Haematococcus pluvialis. Enzyme and Microbial Technology, 78: 10-17.
DOI:10.1016/j.enzmictec.2015.06.010 |
Xi T Q, Kim D G, Roh S W, Choi J S, Choi Y E. 2016. Enhancement of astaxanthin production using Haematococcus pluvialis with novel LED wavelength shift strategy. Applied Microbiology and Biotechnology, 100(14): 6231-6238.
DOI:10.1007/s00253-016-7301-6 |
Ye X, Chen J N, Hu C Y, Xu N J, Sun X. 2020. Promotion of the rapid growth in Haematococcus pluvialis under 0.16% CO 2 condition revealed by transcriptome and metabolomic analysis. Journal of Plant Growth Regulation, 39(3): 1177-1190.
DOI:10.1007/s00344-019-10055-6 |
Ye X, Yu X L, Hu C Y, Xu N J, Sun X. 2021. Effects of CO2 and sodium acetate on the growth and astaxanthin accumulation of the green alga Haematococcus pluvialis. Journal of Nuclear Agricultural Sciences, 35(3): 613-622.
(in Chinese with English abstract) DOI:10.11869/j.issn.100-8551.2021.03.0613 |
You J, Hu H H, Xiong L Z. 2012. An ornithine δ-aminotransferase gene OsOAT confers drought and oxidative stress tolerance in rice. Plant Science, 197: 59-69.
DOI:10.1016/j.plantsci.2012.09.002 |
Zhang C H, Zhang L T, Liu J G. 2019. Exogenous sodium acetate enhances astaxanthin accumulation and photoprotection in Haematococcus pluvialis at the non-motile stage. Journal of Applied Phycology, 31(2): 1001-1008.
DOI:10.1007/s10811-018-1622-z |
Zhao J. 2014. Determination of nitrate in vegetables by ultraviolet spectrophotometry method. Journal of Anhui Agricultural Sciences, 42(27): 9553-9554.
DOI:10.13989/j.cnki.0517-6611.2014.27.108 |
Zheng S Y, He M L, Sui Y S, Gebreluel T, Zhou S M, Kemuma N D, Wang C H. 2017. Kelp waste extracts combined with acetate enhances the biofuel characteristics of Chlorella sorokiniana. Bioresource Technology, 225: 142-150.
DOI:10.1016/j.biortech.2016.11.060 |
Zhou Y, Cai H M, Xiao J H, Li X H, Zhang Q F, Lian X M. 2009. Over-expression of aspartate aminotransferase genes in rice resulted in altered nitrogen metabolism and increased amino acid content in seeds. Theoretical and Applied Genetics, 118(7): 1381-1390.
DOI:10.1007/s00122-009-0988-3 |
Zhuo P L, Li Y H, Zhong J L, Zheng M S, Zhu W R, Xu N J. 2019. Comprehensive effects of exogenous salicylic acid and light on chlorophyll fluorescence parameters and photosynthetic oxygen evolution in Ulva prolifera. Photosynthetica, 57(1): 342-349.
DOI:10.32615/ps.2019.035 |