 2022, Vol. 40
Institute of Oceanology, Chinese Academy of Sciences
Article Information
- GAO Yunni, YANG Hui, GAO Xiaofei, LI Mei, ZHANG Man, DONG Jing, ZHANG Jingxiao, LI Longfei, LI Xuejun, BURFORD Michele A
- Ecological damage of submerged macrophyte Myriophyllum spicatum by cell extracts from microcystin (MC)- and non-MC-producing cyanobacteria, Microcystis
- Journal of Oceanology and Limnology, 40(5): 1732-1749
- http://dx.doi.org/10.1007/s00343-022-1449-y
Article History
- Received Dec. 30, 2021
- accepted in principle Mar. 22, 2022
- accepted for publication May 19, 2022


2 Australian Rivers Institute, Griffith University, Nathan, Queensland 4111, Australia
With the intensification of eutrophication and global climate change, freshwater cyanobacteria blooms appear to be increasing in eutrophic waterbodies worldwide, causing serious ecological, societal, and economic losses (Burford et al., 2020; Plaas and Paerl, 2021). Microcystis is one of the dominant non-nitrogen-fixing genera found throughout the world in tropical, subtropical, and temperate zones (Xiao et al., 2018). Microcystis blooms have been recorded in at least 108 countries throughout the world, 79 of which also reported them to produce monocyclic heptapeptides toxins, i.e., microcystins (MCs) (Harke et al., 2016). Many MC- and non-MC-producing Microcystis strains have been found coexisting in Microcystis blooms (Bormans et al., 2020; Sidelev et al., 2020; Liu et al., 2021). Although the hazards of pure MCs and MC-containing Microcystis to organisms and public health have been studied intensively (Rastogi et al., 2014; Svirčev et al., 2017; Wang et al., 2021), the ecological effects of Microcystis populations on aquatic organisms have not been thoroughly elucidated. More serious cellular damages to medaka fish and significant lethal effects on crustaceans (Daphnia magna) were found to be caused by the extracts of Microcystis natural blooms than pure MCs or MC-containing extracts (Smutná et al., 2014; Le Manach et al., 2016). Whether a part of the negative effects is from non-MC-producing Microcystis strains is unclear, which hinders us from fully understanding the ecotoxicity of cyanobacterial blooms.
Submerged macrophytes play important roles in maintaining clear water status, including taking up nutrients (Finkler Ferreira et al., 2018), reducing sediment resuspension (Rolland et al., 2015), providing habitats for zooplankton (Wood et al., 2017), and allelopathic inhibition on surrounding phytoplankton (Hilt et al., 2006). The reestablishment of submerged macrophytes is crucial for the restoration of structure and function of an impaired shallow aquatic ecosystem (Bai et al., 2020). However, the damage from cyanobacterial blooms on submerged macrophytes is one of the constraints in the restoration practices in shallow eutrophic waterbodies (Jiang et al., 2019a). Decomposed cells of one MC-producing Microcystis aeruginosa strain could cause more severe damage to the submerged macrophyte Vallisneria natans compared to fresh cyanobacteria (Zhang et al., 2021). The exudates and extracts of the same MC-producing M. aeruginosa strain during the decline phase could affect negatively the growth, anti-oxidative systems, and ultrastructure of V. natans (Li et al., 2020b). MCs consistently inhibited the photosynthesis of aquatic plants under a range of exposure concentrations (Zhang et al., 2022). Treatments with 0.5 μg/L of MC-leucine (L) arginine (R) inhibited the photosynthetic oxygen production of Ceratophyllum demersum, Elodea canadensis, and M. spicatum (Pflugmacher, 2002). Oxidative damage of V. natans was also apparent when exposed to 1.0-μg/L pure MC-LR (Jiang et al., 2011). MCs and MC-producing Microcystis exerted negative effects on submerged plants, but the effect of non-MC-producing Microcystis strains on submerged plants is still being debated.
Bacteria are essential components with multiple roles in aquatic ecosystems. They have close links with submerged macrophytes. On one hand, they can settle on the surface of submerged macrophytes to form epiphytic biofilms, respond quickly to environmental variations and interact with submerged macrophytes (Wijewardene et al., 2022). On the other hand, bacterioplankton or planktonic bacteria have been widely investigated (Teeling et al., 2012; Liu et al., 2015; Yang et al., 2020). The structure and function of bacterioplankton communities differed between macrophyte-dominated and phytoplankton-dominated regimes in Taihu Lake in China (Wu et al., 2007; Wang et al., 2020). Epiphytic bacterial communities are influenced by abiotic environmental factors (Hempel et al., 2008) and cyanobacterial blooms including pure MCs (Jiang et al., 2019a, b; Li et al., 2020a, b). The structure, diversity, and activity of planktonic bacteria are shifted during formation and breakdown of cyanobacterial blooms, and involved in MC degradation (Lezcano et al., 2017; Steiner et al., 2017). However, fewer studies have compared the responses of epiphytic and planktonic bacterial communities to the stress of cyanobacterial blooms, despite it should be an important part involved in the ecological damage of submerged macrophytes from cyanobacterial blooms. It has been reported that epiphytic bacteria exhibited higher diversity and distinct community composition than the planktonic bacteria for at least two submerged macrophytes in natural waterbodies (He et al., 2014; Liu et al., 2019). However, whether they responded differently to the stress from cyanobacterial blooms remains unknown yet.
Myriophyllum spicatum is ranked to be the most allelopathic of the tested plant species (Hilt and Gross, 2008; Gao et al., 2017). The selective inhibition of M. spicatum on cyanobacteria rather than eukaryotic algae was previously demonstrated in laboratory experiments and field conditions (Zhu et al., 2010; Švanys et al., 2014). M. spicatum has efficient nutrient assimilation and capacity to inhibit microalgal growth in fresh and low-salinity brackish water bodies (Liu et al., 2018). However, less attention has been paid to the effects of cyanobacterial blooms on M. spicatum in comparison with other submerged macrophytes, e.g., V. natans, thereby hindering its scientific application in restoration of shallow eutrophic waterbodies.
Hence, this study aimed to assess the ecological damage to the submerged macrophyte M. spicatum by cell extracts from MC- and non-MC-producing Microcystis strains during the decline phase. The specific tasks were: (1) to compare the effects of both strains on the growth, physiology, and metabolism of M. spicatum, (2) to determine the responses of epiphytic and planktonic bacterial community to the cell extracts from both Microcystis strains, (3) to measure changes in the abiotic environment during the experiment, and (4) to analyze the chemical profiles of the cell extracts from both strains.
2 MATERIAL AND METHOD 2.1 Cultivation of plants and two Microcystis strainsFresh M. spicatum plants were obtained from the Honghu Lake (29.827°N, 113.476°E) in Hubei Province, China, and cultivated in aquariums in 10-cm deep sediments under a greenhouse until new roots grew. Healthy apical shoots were cleaned and pre-cultured in 1/10 diluted BG11 medium under climate-controlled conditions at a temperature of 22±3 ℃ and a light intensity of 25 μmol/(m2·s) with 12-h light/12-h dark cycles for subsequent laboratory experiments. The 1/10 diluted BG11 medium was suitable for the cultivation of M. spicatum as indicated in our preliminary experiments. The plants were cleaned with deionized water and rinsed with sterile water before the experiments.
One MC-producing (FACHB 915) and one non-MC-producing Microcystis strain (FACHB 1005) were obtained from the Freshwater Algae Culture Collection of the Institute of Hydrobiology (FACHB), the Chinese Academy of Sciences. They were cultured in BG11 medium in 1-L Erlenmeyer flasks under the same conditions as outlined above. Cells in decline phase after 14 days of culture were prepared for the experiments.
Microcystis cell extracts were prepared. The cell densities of the Microcystis cultures were counted with a hemocytometer under a microscope (BA210, MOTIC, Xiamen, China) at 400× magnification. The uniform cultures were centrifuged at 6 000 r/min for 15 min. The obtained cell pellets were mixed with 1/10 diluted BG11 medium, frozen at -80 ℃ for 8 h and thawed at 20 ℃ five times until all the cell walls were observed to be ruptured under a microscope. The crude extracts were subsequently centrifuged at 6 000 r/min for 15 min. The supernatant was filtered through a filter membrane (0.45-μm pore size) and used as extracts for subsequent exposure experiment and chemical composition analysis.
2.2 Experimental designThe cleaned plant apical shoots of M. spicatum of about 12-cm length were cultivated with 1/10 diluted BG11 medium in beakers at 2.5±0.17-g fresh weight per liter. The bottom was secured with sterile glass beads. The prepared cell extracts of MC- and non-MC-producing Microcystis strains were then added to the beakers in the MC+ and MC– treatments respectively. The final concentrations of the extracts used in the treatments were equivalent to those from a cell density of 5.0×10⁶ cells/mL, which is in the concentration range of dense bloom population in eutrophic waters (Wu et al., 2014; Liu et al., 2016). Beakers without the extracts were prepared as control (CT). Each treatment was performed in quintuplicate. All the beakers were covered with breathable sealing membranes and cultured under the conditions described above for 14 days. The biofilm formed rapidly on the surface of plant leaves and remained stable within 10 days (Zhang et al., 2010). After 14 days of the cultivation, the plants were harvested to collect epiphytic bacteria samples immediately, and growth and physiological parameters were measured. The culture medium was also collected for the analysis of bacterioplankton, physicochemical indices, and MC concentration.
2.3 Plant growthThe biomass and length of the plant shoots were measured at the beginning (day 0) and the end (day 14) of the experiment to evaluate the growth of M. spicatum.
2.4 Photosynthetic pigment contentThe fresh plant shoots (0.1 g) were ground in a mortar and a pestle with 5 mL of 80% acetone, and the homogenate was kept in the dark condition at 4 ℃ for 24 h. The homogenate was centrifuged at 11 180×g for 10 min. The absorbance of supernatant was determined spectrophotometrically at 647 and 663 nm for chlorophyll a (chl a) and b (chl b), and at 470 nm for carotenoids (Amorim et al., 2017).
2.5 Determination of plant physiological indicatorsThe fresh plant shoots (0.2 g) were homogenized in a mortar and a pestle with liquid nitrogen for the determination of plant soluble proteins, soluble sugars, total phenols, malondialdehyde (MDA), superoxide dismutase (SOD), peroxidase (POD), catalase (CAT), glutathione S-transferase (GST), and glutathione (GSH), through assay kits from Nanjing Jiancheng Company, China.
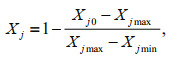
The comprehensive resistance of the plant antioxidant systems was calculated using the membership function method in fuzzy mathematics (Zhang et al., 2021). The indicators SOD, CAT, GST, and GSH are positively related to stress resistance, which was calculated using Eq.1. The indicators MDA and POD are negatively related to stress resistance using Eq.2. Comprehensive resistance index was calculated using Eq.3.
 (1)
(1) (2)
(2) (3)
(3)where Xi or Xj is the membership value of the index i or j, Xi0 or Xj0 is the average measure value of the index i or j, Ximin or Xjmin and Ximax or Xjmax are the minimum and maximum measurement value of the index i or j, X is the comprehensive resistance index, and n is the number of the single index positively related to stress resistance, and m is the number of the single index negatively related to stress resistance.
2.6 Microbial characterizationAll harvested fresh plant shoots were placed in sterile centrifuge tubes with 10 mL of 0.1-mol/L phosphate buffered saline (PBS), and subjected to ultrasonic washing for 1 min, and the process was repeated three times (Li et al., 2020b). The washing water was collected together and filtered through a 0.22-μm pore size fiber filter. The filter membranes with epiphytic bacteria were frozen quickly by immersing into liquid nitrogen and then stored at -80 ℃ for further DNA extraction and analysis of epiphytic bacteria.
The plant culture solution (500 mL) for each treatment was filtered through a 0.22-μm fiber filter. The filter membranes with planktonic bacteria were collected and stored at -80 ℃ for further DNA extraction and analysis of bacterioplankton.
DNA extraction and high-throughput sequencing were carried out by Majorbio BioPharm Technology Co. Ltd. (Shanghai, China). DNA was extracted from the pre-treatment samples by using the Fast DNATM SPIN Kit. The V3–V4 hypervariable region of 16S rRNA was amplified using a barcoded universal primer set, including 338F (5'-ACTCCTACGGGAGGCAGCAG-3') and 806R (5'-GGACTACHVGGGTWTCTAAT-3'). High-throughput sequencing was conducted using the Illumina MiSeq platform. Bioinformatics analysis was used to describe the diversity of microbial communities and to verify microbial species at the phylum and genus levels (Fadrosh et al., 2014).
2.7 Physiochemical indices and MC concentrationThe culture solution was filtered with a 0.45-μm filter membrane, and the filtrate was collected for subsequent determination. Dissolved total nitrogen (TDN) and dissolved total phosphorus (TDP) contents were determined by digestion method according to the Chinese National Standards for Water Quality. Dissolved organic carbon (DOC), and dissolved inorganic carbon (DIC) contents were determined by total organic carbon analyzer (Multi N/C 3100, Analytik Jena, Germany). The concentration of MCs in the solutions was determined with a MC-LR ELISA kit (Institute of Hydrobiology, Chinese Academy of Sciences).
2.8 Chemical profile analysis of cell extractsThermo ultra performance liquid chromatography (UPLC-Q) exactive quadrupolerod-electrostatic field Orbitrap high-resolution mass spectrometry (MS) system (Thermo, USA) was used to analyze the subsamples of the cell extracts from both Microcystis strains. The chromatography separation was performed on Hypersil Gold Vanquish column (100 mm×2.1 mm, 1.9 μm) with 5 mmol/L of ammonium acetate solution (A)-acetonitrile (B) as the mobile phase. The gradient elution was 0–15 min, 5%–50% B; 15–35 min, 5%–98% B; 35–42 min, 98% B; 42–43 min, 98%–5% B; 43–47 min, 5% B. The flow rate was set at 0.3 mL/min, and the column temperature was 40 ℃. Electrospray ionization (ESI) source was applied and operated in Full-scan/Targeted-dd MS2/negative ion mode.
2.9 Data analysisData were presented as the means±standard deviations of quintuplicate samples. After determining the normality using Shapiro-Wilks test and homogeneity using Bartlett's test, one-way analysis of variances (ANOVA) was performed amongst the experimental groups. Multiple comparisons were performed using (fishers least significant difference) LSD test at P < 0.05 (Bates et al., 2012). R studio (Version 3.6.2) was used for statistical analysis of bacteria data (R Development Core Team, 2011). Microsoft Excel 2019 was used for analysis of the other data.
3 RESULT 3.1 Plant growth and pigment responsesNew white roots of plants in all groups were observed on day 14. However, a few leaves of M. spicatum turned yellow and rotted in both treatment groups. The proportion of the rotted leaves was higher in the MC+ treatments (Fig. 1a). The plant biomass was increased by 9.02% and 8.10% in the MC– and MC+ treatments, respectively, during the experiment, and was significantly lower than that in the CT group (11.05%; P < 0.05; Fig. 1b). The average length of the plant shoot increased by 4 cm, after the 14-day exposure to Microcystis extracts, and was not significantly different between the treatment groups and the control (P > 0.05; Fig. 1c). The chl-a and chl-b contents in the plant apical shoots in the MC– and MC+ treatments were reduced significantly in comparison with those in the CT group (P < 0.05; Fig. 1d). No significant difference in carotenoid contents was found between the CT group and the treatments (P > 0.05).

|
| Fig.1 Effects of the cell extracts from MC-producing (MC+) and non-MC-producing (MC–) Microcystis strains on the growth morphology (a), biomass gain rate (b), shoot length (c), and photosynthetic pigments (d) of Myriophyllum spicatum Different lowercase letters indicate significant differences among experimental groups (one-way ANOVA, P < 0.05). |
The contents of soluble proteins, soluble sugars and total phenols in M. spicatum in the treatments decreased significantly after 14 days of exposure to Microcystis cell extracts (Fig. 2; P < 0.05). The inhibitory effects of the cell extracts from the MC-producing Microcystis on the soluble sugar and total phenols of M. spicatum were greater than those from the non-MC-producing Microcystis (P < 0.05).

|
| Fig.2 Contents of soluble proteins, soluble sugars, and total phenols in M. spicatum in the MC– and MC+ treatments and the CT group Significant differences are indicated by different lowercase letters amongst different experimental groups (one-way ANOVA, P < 0.05). |
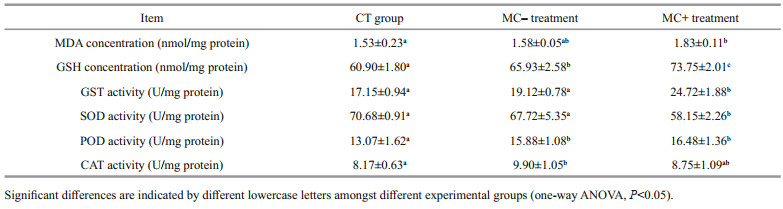
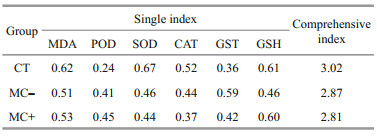
The MDA concentrations were significantly higher in the MC+ treatments (P < 0.05) than those in the control after 14 days of exposure, and were slightly higher in the MC– treatments than in the control (P > 0.05; Table 1). The GSH concentrations and GST activity increased in both treatments, and were 21.10% and 44.08% higher in the MC+ treatments compared with those in the control (P < 0.05). Meanwhile, the SOD activity decreased in both treatments, and was the lowest in MC+ treatments. The POD activity levels in the MC– and MC+ treatments were 21.45% and 26.03% higher than those in the CT group (P < 0.05). The CAT activity in the MC– treatments was 21.19% higher than that in the CT group (P < 0.05) and only 7.09% higher in the MC+ treatments (P > 0.05). The comprehensive resistance index of M. spicatum, calculated based on the six indices of the antioxidant defense systems, was lower in the treatment groups than in the CT group. The plant resistance index to the cell extracts of MC-producing Microcystis was the lowest (Table 2).
|
|
Average number of quality sequences obtained from all samples ranged from 44 016 to 50 468, with an average read length between 414 and 420 bp (Table 3). These sequences were classified into 1 047 OTUs, with a coverage of 1. All OTUs were assigned to 24 phyla and 436 genera. The Chao1 and Shannon indices of epiphytic bacterial communities were significantly lower (P < 0.05) in the treatments with Microcysts cell extracts (MC+, MC–) compared with those in the CT. For planktonic bacteria, the Chao1 indices in the MC+ and MC– treatments were significantly lower than those in the CT group (P < 0.05). The Shannon indices in the MC+ and MC– treatments were also lower than those in the CT group but without significant differences. The number of OTUs, Chao1 and Shannon indices were higher for epiphytic bacteria than for planktonic bacteria in the CT group.

|
Proteobacteria, Bacteroidetes, Firmicutes, and Actinobacteria were the four most dominant phyla of epiphytic and planktonic bacterial communities across all experimental groups (Fig. 3). The relative abundance of epiphytic Proteobacteria was significantly lower than that of planktonic Proteobacteria. The relative abundance of Proteobacteria and Bacteroidetes in the CT group was higher than that in the MC+ and MC– treatments, with significant differences only for Proteobacteria (P < 0.05). However, the relative abundance of Firmicutes in the MC+ and MC–treatments was higher than that in the CT group for epiphytic and planktonic bacteria (P < 0.05). Its relative abundance was significantly higher for epiphytic bacteria than for planktonic bacteria in the same treatments (P < 0.05).

|
| Fig.3 Six most dominant phyla of epiphytic (E) and planktonic bacteria (P) in the CT, MC–, and MC+ groups Different lowercase letters indicate significant differences amongst experimental groups (one-way ANOVA, P < 0.05). |
The main genera of epiphytic bacteria were clustered together, clearly different from those of planktonic genera based on the hierarchical cluster heatmap of the 30 most dominant genera (Fig. 4). For epiphytic bacteria, five genera including Flavihumibacter, Chitinophaga, and Phreatobacter in the CT group, three genera, i.e., Exiguobacterium, norank_f_norank_o_Chloroplast (belonging to Cyanobacteria) and Actinoplanes in the MC– treatments, and two genera, i.e., Acidovorax and Reyranella in the MC+ treatments showed the highest relative abundance. For planktonic bacteria, four genera including Limnohabitans, Sediminibacterium, and Hirschia showed the highest relative abundance in the CT group. Four genera including Devosia and Novosphingobium showed the highest relative abundance in the MC– treatments, whereas eight genera including Enterobacter, Pseudomonas, and Altererythrobacter showed the highest relative abundance in the MC+ treatments.

|
| Fig.4 Hierarchical cluster heatmap of the 30 most dominant genera of epiphytic (E) and planktonic bacteria (P) in the CT, MC–, and MC+ groups |
Eight genera showed significant differences between epiphytic and planktonic forms amongst different treatments (Fig. 5; P < 0.05). The genus norank_f__ Rhizobiales_Incertae_Sedis belonging to phylum Proteobacteria showed the highest abundance in the MC+ treatments and the lowest abundance in the CT group for epiphytic and planktonic bacteria. The genus Devosia belonging to phylum Proteobacteria showed higher abundance in planktonic forms than in epiphytic forms, with the highest abundance in the MC- treatments. Altererythrobacter and Limnohabitans belonging to phylum Proteobacteria showed higher abundance in planktonic forms than in epiphytic forms, with the highest abundance in the MC+ treatments and CT group, respectively. The abundance of Acidovorax belonging to phylum Bacteroidia and norank_f__ norank_o__Chloroplast belonging to Cyanobacteria was higher in epiphytic forms than in planktonic forms, with the highest abundance in the CT group and MC+ treatments, respectively. Pseudomonas belonging to phylum Proteobacteria and norank_f__Devosiaceae belonging to Actinobacteria showed higher abundance in planktonic forms than in epiphytic forms especially in the MC+ treatments.

|
| Fig.5 Eight dominant genera of epiphytic (E) and planktonic bacteria (P) with significant differences amongst the CT, MC–, and MC+ groups Different lowercase letters indicate significant differences amongst groups (one-way ANOVA, P < 0.05). |
PICRUSt-prediction revealed a significantly higher abundance of clusters of orthologous groups in planktonic forms than in epiphytic forms associated with energy production and conversion, amino acid transport and metabolism, transcription, inorganic ion transport and metabolism, general function prediction only, and function unknown, especially for the MC+ and MC– treatments (Fig. 6; P < 0.05). No significant difference was found for the remaining clusters of orthologous groups (P > 0.05).

|
| Fig.6 Clusters of orthologous groups of epiphytic (E) and planktonic bacteria (P) and their abundance in the CT, MC-, and MC+ groups by PICRUSt Different lowercase letters indicate significant differences amongst groups (one-way ANOVA, P < 0.05). |
The DOC concentrations in the culture solution increased 6.9 and 10.5 times immediately after adding cell extracts from MC– and non-MC-producing Microcystis strains compared with those in the CT (Fig. 7a). DIC concentrations also increased 2.2- and 1.8-fold, respectively (Fig. 7b). The TDN and TDP concentrations increased about 1.2 and 1.5 times in both treatments compared with those in the CT (Fig. 7c–d).

|
| Fig.7 Concentrations of dissolved organic carbon (DOC) (a), dissolved inorganic carbon (DIC) (b), dissolved total nitrogen (TDN) (c), and dissolved total phosphorus (TDP) (d) in plant culture solutions of all experiment groups on days 0 and 14 |
The initial DOC concentrations were the highest in the MC– treatments, and the lowest in the CT group. Their concentrations showed no significant differences between the treatments and the CT group at the end of the experiment (Fig. 7a; P > 0.05). The DOC concentrations in the MC– and MC+ treatments decreased, whereas those in the CT group increased over time. The initial DIC concentrations were significantly higher in the MC– and MC+ treatments than in the CT group (Fig. 7b; P < 0.05), and the DIC concentrations increased more than threefold at the end of the experiment for all experimental groups. TDN concentrations slightly increased in the CT but decreased over time in the two treatments (Fig. 7c). DOC, DIC, and TDN concentrations at the end of the experiment did not significantly differ between the CT and the two treatments (P > 0.05). TDP concentrations in the control and the two treatments decreased with time (Fig. 7d). TDP concentrations were significantly higher in both treatments than in the CT group (P < 0.05).
3.5 Chemical profiles of cell extracts from both Microcystis strainsMore than 400 chemicals were determined in the cell extracts of both strains by using UPLC-Oribitrap MS/MS analysis. The dominant forms of microcystin in the cell extracts of MC-producing strains were MC-LR and [Dha7]-microcystin-LR, and their relative abundance was 5%. They were undetected in the cell extracts of non-MC-producing strains. The relative abundance of the 20 most dominant chemical genera accounted for more than 60% (Fig. 8a). The main chemical classes were amino acids, antibiotics, fatty acids, esters, and amide. The relative abundance of amino acids in MC-producing cell extracts was 24%, much higher than the 8% of non-MC-producing cell extracts. However, the relative abundance of esters in non-MC-producing cell extracts was 24%, much higher than the 7% of MC-producing cell extracts. MC-LR concentrations in the MC+ treatment were 0.85 μg/L in the beginning and 0.03 μg/L at the end of the experiment (Fig. 8b).

|
| Fig.8 Relative abundance of the 20 most dominant chemicals at class level (a) in the cell extracts of MC-producing (MC+) and non-MC-producing Microcystis (MC–), and changes in MC-LR concentrations in the MC+ treatments on days 0 and 14 (b) *: significant differences from the initial concentrations (t-test; P < 0.05). |
The present study provided multiple lines of evidence that cell extracts from MC- and non-MC-producing Microcystis strains during the decline phase negatively affected the growth, photosynthesis, antioxidant systems, and primary and secondary metabolism of the submerged macrophyte M. spicatum. Damage to M. spicatum by MC-producing Microcystis was more extensive than that by non-MC-producing strains. Several studies have shown that pure MCs or MC-producing Microcystis populations affect the growth and physiological processes of submerged plants, including M. spicatum, C. demersum, E. canadensis, and V. natans (Pflugmacher, 2002; Jiang et al., 2011; Li et al., 2020a). However, the negative effects of Microcystis blooms during the decline phase on submerged macrophytes were previously found to be stronger than those during the formation phase (Li et al., 2020b; Zhang et al., 2021). The effects of non-MC-producing Microcystis on submerged macrophytes are not yet attracting considerable attention. A previous study has found that the physiological processes of another submerged macrophyte Egeria densa was affected by MC-producing Microcystis but not by non-MC-producing Microcystis (Amorim et al., 2017). Our study provided growth and physiological evidence for the first time that M. spicatum can be affected by cell extracts from MC- and non-MC-producing Microcystis strains during the decline phase, thereby improving our understanding of the overall impacts of Microcystis blooms on submerged macrophytes.
The chemical profiles of cell extracts from both strains differed, which may explain the different extents of their inhibition effects on M. spicatum. The presence of MC-LR and [Dha7]-microcystin-LR with a relative abundance of 5% and an initial concentration of 0.85 μg/L in the MC+ treatment may be the main reason why the cell extracts of MC-producing Microcystis exerted stronger inhibition effects on M. spicatum compared to the MC– treatment. The photosynthesis of aquatic plants has been found to be consistently inhibited by MCs within a range of exposure concentrations (Zhang et al., 2022). The photosynthetic oxygen production of M. spicatum could be clearly inhibited by 0.5-μg/L MC-LR (Pflugmacher, 2002). Apart from MC, Microcystis was reported previously to produce other cyanopeptide compounds, primarily including aeruginosins, anabaenopeptins, cyanobactins, cyanopeptolins, microginins, and microviridins (Janssen, 2019). Non-MC-producing Microcystis mutant reportedly produces higher concentrations of cyanopeptolins, aerucyclamides, and aeruginosins than the wild MC-producing strain (Briand et al., 2016). Herein, we did not detect these compounds in the cell extracts, but the species and relative abundance of amino acids were found to differ between MC– and non-MC-producing Microcystis. Amino acids play various roles in the production of MCs and other cyanotoxins (Dai et al., 2009). The ecotoxicity of cyanopeptides against grazing crustacean, fungi, and bacteria rather than aquatic plants has been previously reported (Janssen, 2019). To answer whether and which cyanopeptides are responsible for the inhibition on M. spicatum by cell extracts from non-MC-producing Microcystis, further research using higher analytical techniques for identification and quantification, as well as ecotoxicity assessment with reference standards, is needed.
Measures related to the photosynthesis and the antioxidant system of plants are frequently selected as biomarkers for the impacts of pure MCs and MC-producing Microcystis cells (Pflugmacher, 2002; Jiang et al., 2011; Zhang et al., 2021). In the current study, the reduced plant growth because of exposure to cell extracts from both Microcystis strains was due to the damage to photosynthesis processes, changes in primary and secondary metabolism measures and effects on the plant antioxidant defense systems. The concentrations of the photosynthesis pigments, chl a and chl b markedly decreased, which may indicate damage to photosynthesis structures and function. Additionally, the reduced contents of soluble proteins and sugars in the plants indicated that nutrient biosynthesis pathways were damaged by Microcystis cell extracts. Plant phenols are the typical allelochemicals produced by M. spicatum for self-defense against cyanobacteria (Zhu et al., 2010). Therefore, the measured decline in total phenol contents reflected a decrease in plant defense to the Microcystis cell extracts.
Changes in the indicators related to plant antioxidant systems, including GSH, GST, SOD, and CAT were observed. Their roles are to limit the formation of new reactive oxygen species and accelerate the scavenging of generated free radicals (Wu et al., 2009). Studies have shown that the MCLR-GSH conjugate can be formed to detoxify MC-LR (Jiang et al., 2011), and MC-LR can be transformed into a glutathione conjugate by GST, which has the ability to detoxify the metabolites of lipid peroxidation (Stüven and Pflugmacher, 2007). This finding may explain the significant decrease in MC-LR concentration in the MC+ treatments during the experiment. Additionally, the increase in POD and MDA contents indicated the accumulation of reactive oxygen species and lipid peroxidation, and a decrease in plant defense capacity (Zhang et al., 2021). Lower comprehensive resistance indices of the plant antioxidant systems in the MC+ and MC– treatments indicated that the damage inflicted by Microcystis cell extracts reduced the comprehensive defense capability of the plant M. spicatum.
4.2 Responses of epiphytic and planktonic bacteriaA previous investigation in Taihu Lake, China, has shown that Microcystis blooms result in low bacterioplankton diversity, whereas Bacillariophyta and Cryptophyta blooms lead to more diverse bacterioplankton communities (Niu et al., 2011). The present study provided evidence that the richness expressed as Chao1 indices and diversity expressed as Shannon indices of epiphytic and planktonic bacteria decreased after adding cell extracts of both Microcystis strains.
Bacterial community composition was also altered at the phylum and genus levels with the addition of Microcystis cell extracts. At the phylum level, the relative abundance of Proteobacteria and Bacteroidetes was lower but that of Firmicutes was significantly higher in the MC+ and MC– treatments than in the CT group. Previous studies have found that Proteobacteria was dominant in epiphytic bacteria attached to macrophytes, and bacterioplankton in adjacent waters (Hempel et al., 2008; Burke et al., 2011; Gong et al., 2018; Jiang et al., 2019a). Bacteroidetes was previously found to be abundant in epiphytic bacterial communities of several submerged macrophytes including M. spicatum in natural water bodies (Hempel et al., 2008). Firmicutes was the main dominant phylum in various anaerobic habitats, i.e., periphytic biofilm of pollutant-removal systems and sediments during the occurrence of MC-LR biodegradation and adsorption in Meiliang Bay, Taihu Lake (Li et al., 2016). The abundance of Firmicutes is always higher than that of Proteobacteria in sludge samples (Li et al., 2015). Bacteria within Firmicutes have the ability to degrade various organic compounds, including proteins and carbohydrates (Levén et al., 2007). We speculate that the increased initial DOC concentrations in the MC+ and MC– treatments after adding Microcystis cell extracts may benefit the increased abundance of Firmicutes, which may degrade these organic compounds and cause the decrease in DOC concentrations in the MC– and MC+ treatments at the end of the experiment.
At the genus level, variations in the community structure of epiphytic bacteria in different treatments indicated the influences from Microcystis cell extracts on epiphytic bacteria. Five genera with the highest abundance in the CT group, were reduced by Microcystis cell extracts in the MC– and MC+ treatments. The genus Phreatobacter, belonging to phylum Proteobacteria, has been documented only in ultrapure-water purification systems and drinking-water distribution systems with low chlorine concentrations (Perrin et al., 2019). We speculated that the growth of this genus needs a clear-water state without environmental stress. Another dominant genus, Chitinophaga from phylum Bacteroidota in the CT group, has been found previously in efficient dissolved cyanobacterial solutions as one of the dominant genera, indicating its potential role to help the host plants compete with cyanobacteria (Berg et al., 2009). These bacteria may originate from the plant M. spicatum itself in epiphytic forms, despite the strict washing steps including the use of sterile water to remove as many bacteria as possible. The good growth performance of M. spicatum further indicates that these dominant genera in the CT group may have mutualistic interactions with the host plants (Wijewardene et al., 2022).
The genera with the highest abundance in the MC– treatment were Exiguobacterium belonging to phylum Firmicutes, norank_f_norank_o_Chloroplast within phylum Cyanobacteria and Actinoplanes within phylum Actinobacteriota, whereas the dominant genera in the MC+ treatments were Acidovorax within phylum Bacteroidota, Reyanella and Flavobacterium both belonging to phylum Proteobacteria. The growth of these genera was promoted in the MC+ and MC– treatments. Most of them have been previously reported in water bodies with Microcystis blooms, e.g., Acidovorax, Exiguobacterium, and Flavobacterium in Taihu Lake (Fan et al., 2016). They contribute to nutrient exchange and interact with bloom formers like Microcysits (Hoke et al., 2021), enhance the growth of cyanobacteria including Microcysits (Berg et al., 2009), and contain strains those are important pathogens of aquatic animals (Zheng et al., 2020). However, Flavobacterium includes strains those can degrade cyanobacterial toxins or other recalcitrant and problematic organic compounds (Berg et al., 2009). Hence, further research is needed to determine the interactions of epiphytic bacteria with M. spicatum in the face of cyanobacteria stress.
For planktonic bacteria, the four genera belonging to phylum Proteobacteria including Limnohabitans showed the highest relative abundance in the CT group. Limnohabitans is a typical bacterioplankton taxon in freshwater bodies, and it lacks the capacity to live on the leaf surfaces of submerged macrophytes (He et al., 2014). Its abundance is significantly reduced in the MC+ and MC– treatments, indicating its sensitivity to stress from Microcystis cell extracts. Four genera including Devosia and Novosphingobium showed the highest abundance in the MC– treatments, whereas eight genera including Enterobacter, Pseudomonas, Chryseobacterium, and Microbacterium showed the highest abundance in the MC+ treatments. The presence of the genera Devosia, Novosphingobium, Enterobacter, Pseudomonas, and Chryseobacterium in eutrophic water bodies with cyanobacterial blooms such as Taihu Lake has been previously documented (Guo et al., 2015; Fan et al., 2016; Chen et al., 2018). Multiple strains within the genera Enterobacter, Pseudomonas, Chryseobacterium, Microbacterium, and Novosphingobium have been reported their MC-degradation capabilities (Dziga et al., 2013; Kumar et al., 2018; Wang et al., 2018; Hoke et al., 2021). Their degradation capacity varied from 9.4 μg/(L·d) to 2 548 μg/(L·d) (Dziga et al., 2013). The MCs concentrations decreased by 97% at the end of the experiment, these dominant genera may also contribute to this process together with the plant itself. In addition to bioactive secondary metabolites, Microcystis have been shown to produce and release differing concentrations of various forms of organic substances (Pivokonsky et al., 2014; Villacorte et al., 2015). These substances may be consumed and degraded by dominant genera in the MC+ and MC– treatments.
The richness and diversity of epiphytic bacteria were higher than those of surrounding bacterioplankton, and the bacterial composition also differed at the genus level in our study. This finding was consistent with previous field investigations on submerged macrophytes Potamogeton crispus and M. spicatum, in which epiphytic bacteria possess higher diversity and more distinct community composition than the surrounding bacterioplankton (He et al., 2014; Liu et al., 2019). Bacteria may prefer to grow attached to a substrate, and most bacteria may originate from plant leaves and stems based on our experimental procedures in the present study. Different bacterial compositions lead to different bacterial functions. A previous study using PICRUSt analyses suggested the distinct nutrient-source utilization of epiphytic bacteria and bacterioplankton (Shi et al., 2017). In the MC+ and MC– treatments, bacterial genes associated with energy production and conversion, amino acid transport and metabolism, and inorganic ion transport and metabolism were more abundant for bacterioplankton than for epiphytic bacteria. This finding indicated that bacterioplankton might have strong capability to consume and degrade substances derived from Microcystis cell extracts. The dominant genera with algicidal and MC degradation capabilities in bacterioplankton community may be the main contributor to this process. Conversely, the nutrient-source utilization of epiphytic bacteria may be affected by the cell extracts. PICRUSt analyses revealed that bacterioplankton and epiphytic bacteria responded differently to cell extracts from Microcystis at the end of the experiment. Bacterioplankton may play a role in alleviating damage to M. spicatum by decomposing substances from Microcystis blooms if they can consume and degrade toxic substances derived from Microcystis. The structure and function of epiphytic bacteria may be affected negatively by toxic substances from Microcystis. Whether this process enhances or alleviates damage to M. spicatum remains unclear.
Based on the experimental results, we speculated on the ecological damage to M. spicatum inflicted by decomposing substances from Microcystis blooms, as shown in the schematic in Fig. 9. Decomposing substances from MC- and non-MC-producing Microcystis populations affected the photosynthesis, primary and secondary metabolism, and defense capacity of the antioxidant systems of M. spicatum. MC-producing Microcystis inflicted stronger damage to the plant due to the presence of MCs. Meanwhile, epiphytic and planktonic bacteria responded differently to the decomposing substances from Microcystis blooms. The nutrient utilization capability of bacterioplankton was promoted by decomposing substances from Microcystis, and several dominant genera had the potential to degrade MCs. Conversely, the nutrient utilization capability of epiphytic bacteria was inhibited. The responses of planktonic bacteria may be beneficial for M. spicatum to alleviate damage from Microcystis, but the interactions between epiphytic bacteria and M. spicatum facing stress from Microcystis remains unclear. Further research should focus on the structure and function dynamics of bacteria in various microhabitats to reveal the ecological mechanisms of the interactions between cyanobacteria and submerged macrophytes.

|
| Fig.9 Schematic diagram of the ecological damage to the submerged macrophyte M. spicatum by the decomposing substances from MC- and non-MC-producing Microcystis populations |
This study compared multiple physiological responses of M. spicatum to cell extracts of MC- and non-MC-producing Microcystis strains. The growth, photosynthesis, antioxidant systems, and primary and secondary metabolism of the submerged macrophyte M. spicatum were significantly affected by cell extracts from both Microcystis strains. Damage inflicted by MC-producing strains was greater than that by non-MC-producing strains due to the presence of MCs. Epiphytic and planktonic bacterial communities responded differently to Microcystis cell extracts. Bacterial genes associated with energy production and conversion, amino acid transport and metabolism, inorganic ion transport and metabolism were more abundant in the MC+ and MC– treatments than in the CT group for planktonic bacteria but less abundant for epiphytic bacteria. Planktonic bacteria seemed to utilize and degrade substances derived from Microcystis cell extracts, which may be beneficial for M. spicatum to alleviate damage from Microcystis.
6 DATA AVAILABILITY STATEMENTAll datasets generated and/or analyzed during this study are available from the corresponding author on reasonable request.
7 ACKNOWLEDGMENTWe thank four anonymous reviewers for their helpful comments and suggestions to improve this manuscript.
Amorim C A, Ulisses C, Moura A N. 2017. Biometric and physiological responses of Egeria densa Planch. cultivated with toxic and non-toxic strains of Microcystis. Aquatic Toxicology, 191: 201-208.
DOI:10.1016/j.aquatox.2017.08.012 |
Bai G L, Zhang Y, Yan P, et al. 2020. Spatial and seasonal variation of water parameters, sediment properties, and submerged macrophytes after ecological restoration in a long-term (6 year) study in Hangzhou West Lake in China: submerged macrophyte distribution influenced by environmental variables. Water Research, 186: 116379.
DOI:10.1016/j.watres.2020.116379 |
Bates D, Maechler M, Bolker B et al. 2012. Lme4: Linear mixed-effects models using S4 classes. R Package Version: 0.999999-2. R Foundation for Statistical Computing, Vienna. http://cran.r-project.org/web/packages/lme4/lme4.pdf.
|
Berg K A, Lyra C, Sivonen K, et al. 2009. High diversity of cultivable heterotrophic bacteria in association with cyanobacterial water blooms. The ISME Journal, 3(3): 314-325.
DOI:10.1038/ismej.2008.110 |
Bormans M, Savar V, Legrand B, et al. 2020. Cyanobacteria and cyanotoxins in estuarine water and sediment. Aquatic Ecology, 54(2): 625-640.
DOI:10.1007/s10452-020-09764-y |
Briand E, Bormans M, Gugger M, et al. 2016. Changes in secondary metabolic profiles of Microcystis aeruginosa strains in response to intraspecific interactions. Environmental Microbiology, 18(2): 384-400.
DOI:10.1111/1462-2920.12904 |
Burford M A, Carey C C, Hamilton D P, et al. 2020. Perspective: advancing the research agenda for improving understanding of cyanobacteria in a future of global change. Harmful Algae, 91: 101601.
DOI:10.1016/j.hal.2019.04.004 |
Burke C, Thomas T, Lewis M, et al. 2011. Composition, uniqueness and variability of the epiphytic bacterial community of the green alga Ulva australis. The ISME Journal, 5(4): 590-600.
DOI:10.1038/ismej.2010.164 |
Chen C Y, Pan G, Shi W Q, et al. 2018. Clay flocculation effect on microbial community composition in water and sediment. Frontiers in Environmental Science, 6: 60.
DOI:10.3389/fenvs.2018.00060 |
Dai R H, Liu H J, Qu J H, et al. 2009. Effects of amino acids on microcystin production of the Microcystis aeruginosa. Journal of Hazardous Materials, 161(2-3): 730-736.
DOI:10.1016/j.jhazmat.2008.04.015 |
Dziga D, Wasylewski M, Wladyka B, et al. 2013. Microbial degradation of microcystins. Chemical Research in Toxicology, 26(6): 841-852.
DOI:10.1021/tx4000045 |
Fadrosh D W, Ma B, Gajer P, et al. 2014. An improved dual-indexing approach for multiplexed 16S rRNA gene sequencing on the Illumina MiSeq platform. Microbiome, 2(1): 6.
DOI:10.1186/2049-2618-2-6 |
Fan Z, Han R M, Ma J, et al. 2016. Submerged macrophytes shape the abundance and diversity of bacterial denitrifiers in bacterioplankton and epiphyton in the Shallow Fresh Lake Taihu, China. Environmental Science and Pollution Research, 23(14): 14102-14114.
DOI:10.1007/s11356-016-6390-1 |
Finkler Ferreira T, Crossetti L O, Motta Marques D M L, et al. 2018. The structuring role of submerged macrophytes in a large subtropical shallow lake: clear effects on water chemistry and phytoplankton structure community along a vegetated-pelagic gradient. Limnologica, 69: 142-154.
DOI:10.1016/j.limno.2017.12.003 |
Gao Y N, Dong J, Fu Q Q, et al. 2017. Allelopathic effects of submerged macrophytes on phytoplankton. Allelopathy Journal, 40(1): 1-22.
DOI:10.26651/2017-40-1-1062 |
Gong L X, Zhang S H, Chen D Q, et al. 2018. Response of biofilms-leaves of two submerged macrophytes to high ammonium. Chemosphere, 192: 152-160.
DOI:10.1016/j.chemosphere.2017.09.147 |
Guo X L, Liu X L, Pan J L, et al. 2015. Synergistic algicidal effect and mechanism of two diketopiperazines produced by Chryseobacterium sp. strain GLY-1106 on the harmful bloom-forming Microcystis aeruginosa. Scientific Reports, 5: 1-12.
DOI:10.1038/srep14720 |
Harke M J, Steffen M M, Gobler C J, et al. 2016. A review of the global ecology, genomics, and biogeography of the toxic cyanobacterium, Microcystis spp. Harmful Algae, 54: 4-20.
DOI:10.1016/j.hal.2015.12.007 |
He D, Ren L J, Wu Q L. 2014. Contrasting diversity of epibiotic bacteria and surrounding bacterioplankton of a common submerged macrophyte, Potamogeton crispus, in freshwater lakes. FEMS Microbiology Ecology, 90(3): 551-562.
DOI:10.1111/1574-6941.12414 |
Hempel M, Blume M, Blindow I, et al. 2008. Epiphytic bacterial community composition on two common submerged macrophytes in brackish water and freshwater. BMC Microbiology, 8: 58.
DOI:10.1186/1471-2180-8-58 |
Hilt S, Ghobrial M G N, Gross E M. 2006. In situ allelopathic potential of Myriophyllum verticillatum (Haloragaceae) against selected phytoplankton species. Journal of Phycology, 42(6): 1189-1198.
DOI:10.1111/j.1529-8817.2006.00286.x |
Hilt S, Gross E M. 2008. Can allelopathically active submerged macrophytes stabilise clear-water states in shallow lakes?. Basic and Applied Ecology, 9(4): 422-432.
DOI:10.1016/j.baae.2007.04.003 |
Hoke A K, Reynoso G, Smith M R, et al. 2021. Genomic signatures of Lake Erie bacteria suggest interaction in the Microcystis phycosphere. PLoS One, 16(9): e0257017.
DOI:10.1371/journal.pone.0257017 |
Janssen E M L. 2019. Cyanobacterial peptides beyond microcystins - a review on co-occurrence, toxicity, and challenges for risk assessment. Water Research, 151: 488-499.
DOI:10.1016/j.watres.2018.12.048 |
Jiang J L, Gu X Y, Song R, et al. 2011. Microcystin-LR induced oxidative stress and ultrastructural alterations in mesophyll cells of submerged macrophyte Vallisneria natans (Lour.) Hara. Journal of Hazardous Materials, 190(1-3): 188-196.
DOI:10.1016/j.jhazmat.2011.03.023 |
Jiang M Q, Zhou Y P, Ji X Y, et al. 2019a. Responses of leaf-associated biofilms on the submerged macrophyte Vallisneria natans during harmful algal blooms. Environmental Pollution, 246: 819-826.
DOI:10.1016/j.envpol.2018.12.081 |
Jiang M Q, Zhou Y P, Wang N, et al. 2019b. Allelopathic effects of harmful algal extracts and exudates on biofilms on leaves of Vallisneria natans. Science of the Total Environment, 655: 823-830.
DOI:10.1016/j.scitotenv.2018.11.296 |
Kumar P, Hegde K, Brar S K, et al. 2018. Biodegradation of microcystin-LR using acclimatized bacteria isolated from different units of the drinking water treatment plant. Environmental Pollution, 242: 407-416.
DOI:10.1016/j.envpol.2018.07.008 |
Le Manach S, Khenfech N, Huet H, et al. 2016. Gender-specific toxicological effects of chronic exposure to pure microcystin-LR or complex Microcystis aeruginosa extracts on adult Medaka fish. Environmental Science & Technology, 50(15): 8324-8334.
DOI:10.1021/acs.est.6b01903 |
Levén L, Eriksson A R B, Schnürer A. 2007. Effect of process temperature on bacterial and archaeal communities in two methanogenic bioreactors treating organic household waste. FEMS Microbiology Ecology, 59(3): 683-693.
DOI:10.1111/j.1574-6941.2006.00263.x |
Lezcano M Á, Velázquez D, Quesada A, et al. 2017. Diversity and temporal shifts of the bacterial community associated with a toxic cyanobacterial bloom: an interplay between microcystin producers and degraders. Water Research, 125: 52-61.
DOI:10.1016/j.watres.2017.08.025 |
Li J M, Li J, Shi G, et al. 2016. Discerning biodegradation and adsorption of microcystin-LR in a shallow semi-enclosed bay and bacterial community shifts in response to associated process. Ecotoxicology and Environmental Safety, 132: 123-131.
DOI:10.1016/j.ecoenv.2016.05.033 |
Li Q, Gu P, Zhang C, et al. 2020a. Combined toxic effects of anatoxin-a and microcystin-LR on submerged macrophytes and biofilms. Journal of Hazardous Materials, 389: 122053.
DOI:10.1016/j.jhazmat.2020.122053 |
Li Q, Gu P, Zhang H, et al. 2020b. Response of submerged macrophytes and leaf biofilms to the decline phase of Microcystis aeruginosa: antioxidant response, ultrastructure, microbial properties, and potential mechanism. Science of the Total Environment, 699: 134325.
DOI:10.1016/j.scitotenv.2019.134325 |
Li Y M, Wang J, Zhang A, et al. 2015. Enhancing the quantity and quality of short-chain fatty acids production from waste activated sludge using CaO2 as an additive. Water Research, 83: 84-93.
DOI:10.1016/j.watres.2015.06.021 |
Liu L M, Yang J, Yu Z, et al. 2015. The biogeography of abundant and rare bacterioplankton in the lakes and reservoirs of China. The ISME Journal, 9(9): 2068-2077.
DOI:10.1038/ismej.2015.29 |
Liu Q, Liu M M, Zhang Q, et al. 2019. Epiphytic bacterial community composition on the surface of the submerged macrophyte Myriophyllum spicatum in a low-salinity sea area of Hangzhou Bay. Oceanological and Hydrobiological Studies, 48(1): 43-55.
DOI:10.1515/ohs-2019-0005 |
Liu Q, Sun B, Huo Y Z, et al. 2018. Nutrient bioextraction and microalgae growth inhibition using submerged macrophyte Myriophyllum spicatum in a low salinity area of East China Sea. Marine Pollution Bulletin, 127: 67-72.
DOI:10.1016/j.marpolbul.2017.11.031 |
Liu Y, Chen Y X, Fang H Y, et al. 2021. Relationship between morphospecies and microcystin-producing genotypes of Microcystis species in Chinese freshwaters. Journal of Oceanology and Limnology, 39(5): 1926-1937.
DOI:10.1007/s00343-020-0276-2 |
Liu Y, Xu Y, Wang Z J, et al. 2016. Dominance and succession of Microcystis genotypes and morphotypes in Lake Taihu, a large and shallow freshwater lake in China. Environmental Pollution, 219: 399-408.
DOI:10.1016/j.envpol.2016.05.021 |
Niu Y, Shen H, Chen J, et al. 2011. Phytoplankton community succession shaping bacterioplankton community composition in Lake Taihu, China. Water Research, 45(14): 4169-4182.
DOI:10.1016/j.watres.2011.05.022 |
Perrin Y, Bouchon D, Delafont V, et al. 2019. Microbiome of drinking water: a full-scale spatio-temporal study to monitor water quality in the Paris distribution system. Water Research, 149: 375-385.
DOI:10.1016/j.watres.2018.11.013 |
Pflugmacher S. 2002. Possible allelopathic effects of cyanotoxins, with reference to microcystin-LR, in aquatic ecosystems. Environmental Toxicology, 17(4): 407-413.
DOI:10.1002/tox.10071 |
Pivokonsky M, Safarikova J, Baresova M, et al. 2014. A comparison of the character of algal extracellular versus cellular organic matter produced by cyanobacterium, diatom and green alga. Water Research, 51: 37-46.
DOI:10.1016/j.watres.2013.12.022 |
Plaas H E, Paerl H W. 2021. Toxic cyanobacteria: a growing threat to water and air quality. Environmental Science & Technology, 55(1): 44-64.
DOI:10.1021/acs.est.0c06653 |
R Development Core Team. 2011. R: A Language and Environment for Statistical Computing. R Foundation for Statistical Computing, Vienna, Austria, https://www.R-project.org/.
|
Rastogi R P, Sinha R P, Incharoensakdi A. 2014. The cyanotoxin-microcystins: current overview. Reviews in Environmental Science and Bio/Technology, 13(2): 215-249.
DOI:10.1007/s11157-014-9334-6 |
Rolland D C, Haury J, Marmonier P, et al. 2015. Effect of macrophytes on flow conditions and deposition of suspended particles in small streams: an experimental study using artificial vegetation. Revue des Sciences de L'Eau, 28(3): 231-245.
DOI:10.7202/1034012ar |
Shi L M, Huang Y X, Zhang M, et al. 2017. Bacterial community dynamics and functional variation during the long-term decomposition of cyanobacterial blooms in-vitro. Science of the Total Environment, 598: 77-86.
DOI:10.1016/j.scitotenv.2017.04.115 |
Sidelev S, Zubishina A, Chernova E. 2020. Distribution of microcystin-producing genes in Microcystis colonies from some Russian freshwaters: is there any correlation with morphospecies and colony size?. Toxicon, 184: 136-142.
DOI:10.1016/j.toxicon.2020.06.005 |
Smutná M, Babica P, Jarque S, et al. 2014. Acute, chronic and reproductive toxicity of complex cyanobacterial blooms in Daphnia magna and the role of microcystins. Toxicon, 79: 11-18.
DOI:10.1016/j.toxicon.2013.12.009 |
Steiner K, Wood S A, Puddick J, et al. 2017. A comparison of bacterial community structure, activity and microcystins associated with formation and breakdown of a cyanobacterial scum. Aquatic Microbial Ecology, 80(3): 243-256.
DOI:10.3354/ame01852 |
Stüven J, Pflugmacher S. 2007. Antioxidative stress response of Lepidium sativum due to exposure to cyanobacterial secondary metabolites. Toxicon, 50(1): 85-93.
DOI:10.1016/j.toxicon.2007.02.019 |
Švanys A, Paškauskas R, Hilt S. 2014. Effects of the allelopathically active macrophyte Myriophyllum spicatum on a natural phytoplankton community: a mesocosm study. Hydrobiologia, 737(1): 57-66.
DOI:10.1007/s10750-013-1782-4 |
Svirčev Z, Drobac D, Tokodi N, et al. 2017. Toxicology of microcystins with reference to cases of human intoxications and epidemiological investigations of exposures to cyanobacteria and cyanotoxins. Archives of Toxicology, 91(2): 621-650.
DOI:10.1007/s00204-016-1921-6 |
Teeling H, Fuchs B M, Becher D, et al. 2012. Substrate-controlled succession of marine bacterioplankton populations induced by a phytoplankton bloom. Science, 336(6081): 608-611.
DOI:10.1126/science.1218344 |
Villacorte L O, Ekowati Y, Neu T R, et al. 2015. Characterisation of algal organic matter produced by bloom-forming marine and freshwater algae. Water Research, 73: 216-230.
DOI:10.1016/j.watres.2015.01.028 |
Wang H J, Xu C, Liu Y, et al. 2021. From unusual suspect to serial killer: cyanotoxins boosted by climate change may jeopardize megafauna. The Innovation, 2(2): 100092.
DOI:10.1016/j.xinn.2021.100092 |
Wang J P, Wang C, Li J H, et al. 2018. Comparative genomics of degradative Novosphingobium strains with special reference to microcystin-degrading Novosphingobium sp. THN1. Frontiers in Microbiology, 9: 2238.
DOI:10.3389/fmicb.2018.02238 |
Wang Y J, Cao X Y, Zeng J, et al. 2020. Distinct shifts in bacterioplankton community composition and functional gene structure between macrophyte- and phytoplankton-dominated regimes in a large shallow lake. Limnology and Oceanography, 65(S1): S208-S219.
DOI:10.1002/lno.11373 |
Wijewardene L, Wu N C, Fohrer N, et al. 2022. Epiphytic biofilms in freshwater and interactions with macrophytes: current understanding and future directions. Aquatic Botany, 176: 103467.
DOI:10.1016/j.aquabot.2021.103467 |
Wood K A, OoHare M T, McDonald C, et al. 2017. Herbivore regulation of plant abundance in aquatic ecosystems. Biological Reviews, 92(2): 1128-1141.
DOI:10.1111/brv.12272 |
Wu A P, Cao T, Wu S K, et al. 2009. Trends of superoxide dismutase and soluble protein of aquatic plants in lakes of different trophic levels in the middle and lower reaches of the Yangtze River, China. Journal of Integrative Plant Biology, 51(4): 414-422.
DOI:10.1111/j.1744-7909.2009.00814.x |
Wu Q L, Zwart G, Wu J F, et al. 2007. Submersed macrophytes play a key role in structuring bacterioplankton community composition in the large, shallow, subtropical Taihu Lake, China. Environmental Microbiology, 9(11): 2765-2774.
DOI:10.1111/j.1462-2920.2007.01388.x |
Wu Y L, Li L, Gan N Q, et al. 2014. Seasonal dynamics of water bloom-forming Microcystis morphospecies and the associated extracellular microcystin concentrations in large, shallow, eutrophic Dianchi Lake. Journal of Environmental Sciences, 26(9): 1921-1929.
DOI:10.1016/j.jes.2014.06.031 |
Xiao M, Li M, Reynolds C S. 2018. Colony formation in the cyanobacterium Microcystis. Biological Reviews, 93(3): 1399-1420.
DOI:10.1111/brv.12401 |
Yang W, Zheng Z M, Lu K H, et al. 2020. Manipulating the phytoplankton community has the potential to create a stable bacterioplankton community in a shrimp rearing environment. Aquaculture, 520: 734789.
DOI:10.1016/j.aquaculture.2019.734789 |
Zhang M, Cao T, Ni L Y, et al. 2010. Carbon, nitrogen and antioxidant enzyme responses of Potamogeton crispus to both low light and high nutrient stresses. Environmental and Experimental Botany, 68(1): 44-50.
DOI:10.1016/j.envexpbot.2009.09.003 |
Zhang W Z, Gu P, Zheng X W, et al. 2021. Ecological damage of submerged macrophytes by fresh cyanobacteria (FC) and cyanobacterial decomposition solution (CDS). Journal of Hazardous Materials, 401: 123372.
DOI:10.1016/j.jhazmat.2020.123372 |
Zhang Y Y, Vo Duy S, Munoz G, et al. 2022. Phytotoxic effects of microcystins, anatoxin-a and cylindrospermopsin to aquatic plants: a meta-analysis. Science of the Total Environment, 810: 152104.
DOI:10.1016/j.scitotenv.2021.152104 |
Zheng X, Feng L, Jiang W D, et al. 2020. The regulatory effects of pyridoxine deficiency on the grass carp (Ctenopharyngodon idella) gill barriers immunity, apoptosis, antioxidant, and tight junction challenged with Flavobacterium columnar. Fish & Shellfish Immunology, 105: 209-223.
DOI:10.1016/j.fsi.2020.07.036 |
Zhu J Y, Liu B Y, Wang J, et al. 2010. Study on the mechanism of allelopathic influence on cyanobacteria and chlorophytes by submerged macrophyte (Myriophyllum spicatum) and its secretion. Aquatic Toxicology, 98(2): 196-203.
DOI:10.1016/j.aquatox.2010.02.011 |