 2022, Vol. 40
Institute of Oceanology, Chinese Academy of Sciences
Article Information
- DUAN Zhipeng, TAN Xiao, ZENG Qingfei
- Key physiological traits and chemical properties of extracellular polymeric substances determining colony formation in a cyanobacterium
- Journal of Oceanology and Limnology, 40(5): 1720-1731
- http://dx.doi.org/10.1007/s00343-022-1353-5
Article History
- Received Oct. 26, 2021
- accepted in principle Dec. 4, 2021
- accepted for publication Jan. 14, 2022


2 College of Hydrology and Water Resources, Hohai University, Nanjing 210098, China;
3 State Key Laboratory of Lake Science and Environment, Nanjing Institute of Geography and Limnology, Chinese Academy of Sciences, Nanjing 210008, China
Cyanobacterial blooms globally threaten freshwater ecosystems that supply drinking water, recreation, and support fisheries (Harke et al., 2016). One of the key traits of most bloom-forming cyanobacteria is colony formation that enforces the formation of surface cyanobacterial scums through enhancing vertical and horizontal migration (Xiao et al., 2018) and resisting to predation from zooplankton (Gerphagnon et al., 2015). The floating accumulation of cyanobacterial colonies provides better access to carbon dioxide and light while, at the same time, shading to other phytoplankton in the water column below (Sukenik and Kaplan, 2021).
Extracellular polymeric substances (EPS) are critical for the colony formation of cyanobacteria (Stal, 2017; Xiao et al., 2018). In the past decades, studies focused on colony formation have made great efforts to identify the culturing conditions that influence the production and chemical composition of EPS in cyanobacteria (Yang et al., 2008; Wilson et al., 2010; Li et al., 2013; Duan et al., 2018; Xiao et al., 2019). Despite that, knowledge on how EPS production and EPS chemical characteristics of cyanobacteria depended on their physiological traits and impacted the colony formation is limited (Duan et al., 2018). Cyanobacterial cells in colonies commonly invest abundant photosynthates into EPS compared with unicellular ones (Zhang et al., 2011). Excessive investment in EPS has been shown to negatively correlate with growth rates, although this relationship was derived mainly from laboratory experiments using unicellular strains under different culturing conditions (Yang et al., 2008; Li et al., 2013; Xu et al., 2016a). However, considerably physiological variations existed between unicellular and colonial strains. More specifically, in comparison to unicells, colonies contained higher pigment content, more effective photosystems, and higher affinity for inorganic carbon (Shen and Song, 2007; Zhang et al., 2007; Wu and Song, 2008), which might enhance their capacities to harvest light and accumulate photosynthates. It implies that the negative correlation between EPS production and growth rate may be absent in colonial strains (Duan et al., 2018). Therefore, it is worthy to estimate the relationships among photosynthetically energy acquisition and allocation for growth and EPS production or colony formation, using multiple strains with different morphological characteristics.
Colony formation is not only associated with EPS content but relies heavily on EPS composition (Duan et al., 2019). Initially, polysaccharides were found in cyanobacterial EPS, which contained various mono-saccharides, and varied with morphospecies or strains (Forni et al., 1997). Although polysaccharides are dominant in cyanobacterial EPS by weight (e.g., c.~75% of the total extracellular polymers in cyanobacterial EPS), other biomolecules (e.g., protein, lipid, and DNA) existed as well (Pereira et al., 2009; Helm and Potts, 2012). With the development and application of fluorescence excitation-emission matrices (EEMs) in semi-quantifying dissolved organic matters (Stedmon and Markager, 2005; Murphy et al., 2014), various protein- and humic-like components were identified in cyanobacterial EPS (Xu et al., 2013a, c; Xu et al., 2014; Duan et al., 2019). Despite the rapidly collected information on the chemical composition of EPS, however, key chemical components involved in colony formation remain to be distinguished (Xiao et al., 2019). EPS extraction is a major challenge in the assays of EPS composition because it is easy to cause cell lysis and contamination (Xu et al., 2013c). It is responsible for the uncertainties in chemical assays of EPS composition (Pereira et al., 2009; Xu et al., 2013c; Liu et al., 2014). Recently, a thermal method for EPS extraction has been developed, which can effectively improve EPS yield and minimize cell lysis through stabilizing the cellular osmotic pressure and external pH (Duan et al., 2020). It may contribute to a more accurate assay of EPS chemical composition, especially the identification of colony-involved components.
A cosmopolitan cyanobacterium, Microcystis, often exists as large colonies in natural waters (Xiao et al., 2018), and forms harmful cyanobacterial blooms all over the world (Harke et al., 2016). Moreover, Microcystis contains numerous strains that have a diversity of morphological characteristics (large colonies, small colonies, and unicellular forms). Therefore, the mechanisms underlying colony formation of cyanobacteria can be investigated on an intraspecific level. In this study, six Microcystis strains (including both colonies and unicells) were employed. It aims to i) examine the interspecific variation in physiological and extracellular properties; ii) estimate the linkage between the properties and colony formation using structural equation modelling (SEM), EEMs, and Fourier Transform Infrared Spectrometer (FTIR) analyses; and iii) identify the key components in EPS involved in colony formation. The findings of this study provide new insights into colony formation of cyanobacteria prospected from the physiological and extracellular properties.
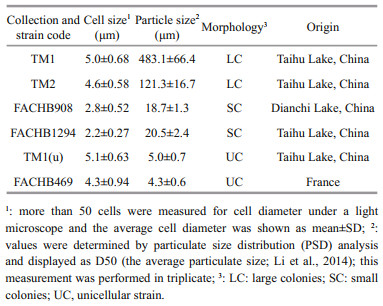
2 MATERIAL AND METHOD 2.1 Preparation of Microcystis strainsSix Microcystis strains with different morphological characteristics were employed to assess the interspecific variation of physiological and extracellular properties (Table 1). TM1 and TM2 (large colonies) were isolated from Meiliang Bay of Taihu Lake, China (Duan et al., 2018). FACHB908 and FACHB1294 (small colonies) were purchased from the Freshwater Algae Culture Collection at the Institute of Hydrobiology (FACHB), Chinese Academy of Sciences. TM1(u) was separated from TM1, but has lost its ability to form colonies. FACHB469 (unicells) was also purchased from FACHB. These strains were pre-cultured and activated separately in BG-11 medium (Stanier et al., 1971) for 6 days. The culture condition was set at 25±0.5 ℃ under 45 μmol photons/(m2·s) light intensity with a light to dark cycle of 12 h:12 h. After acclimation, all strains were grown in 300-mL Erlenmeyer flasks containing 200 mL of fresh BG-11 with three replicates for each strain. The starting cell concentration was set at 5×10⁴ cells/mL. These flasks were gently mixed and randomly repositioned every day. For the assessments of physiological traits, extracellular properties, and size distribution, all strains were harvested at the exponential phase after being cultured for 10 days. Average growth rate (μ) was calculated following the equation (Xu et al., 2010): μ=ln(Nt–N0)/∆t, where Nt and N0 represent the cell concentrations (cells/mL) at the end and the start of the experiment, respectively; and ∆t indicates the experimental period (day). The cell concentration was determined via cell counting under a light microscope using a hemocytometer. For colonial strains, before cell counting, colonies were dispensed into single cells using Milli-Q water according to the method of Duan et al. (2021).
Morphological characteristics of these strains were examined, and images were taken using a microscope (Carl Zeiss, Germany) equipped with a camera (AxioCam ICc 3). For cell size, the microscopic images were analyzed by using UTHSSA ImageTool v3.00 software (Duan et al., 2018).
2.3 Photosynthetic activity measurementCyanobacterial cultures (2 mL) were taken at the exponential phase and kept them in darkness for 20 min before the measurement (Duan et al., 2017). Photosynthetic activity or maximum quantum yield (Fv/Fm) was recorded in triplicate using a FluorPen fluorometer (AquaPen-C AP-C 100, Photon Systems Instruments, Czech Republic) at room temperature. Illumination in the equipment was provided by a PIN photodiode with 667- to 750-nm bandpass filters, with the saturating light of 3 000 μmol photons/(m2·s).
2.4 Particulate size distribution (PSD) analysis for colony sizeA particle analyzer (Mastersizer 2000, Malvern Instruments Ltd., UK) was used to measure the particle size distribution. Particulate size of D50 indicated the average colony size (Li et al., 2014). The dispersant was NaCl solution (8.6 mmol/L). A refractive index of 1.40 and a light absorption index of 0.1 was used for all the strains (Li et al., 2014).
2.5 EPS extraction and analysisIn this study, EPS indicates soluble EPS (S-EPS) and bound EPS. Generally, the bound EPS of microorganisms is double-layered (Sheng et al., 2010), including loosely bound EPS (L-EPS) and tightly bound EPS (T-EPS). S-EPS and L-EPS were extracted according to Yang et al. (2008) and Xu et al. (2013a), respectively. A thermal extraction method was applied to extract T-EPS (Duan et al., 2020). All the EPS samples were filtered (0.45 μm, Xinya Purification Materials Co., China) and were stored at 4 ℃ before EEM, FTIR, and biochemical assays.
2.6 EEM and FTIR analysesEEM spectra were assayed by a fluorescence spectrometer (Hitachi F-7100, Tokyo, Japan) with a 700-voltage xenon lamp at 25 ℃ after instrument-specific correction. Parameters of the spectrometer for EEM measurements were set according to Xu et al. (2013a). The blank scans were conducted using NaCl solution (8.6 mmol/L). Beforehand, non-fluorescence of the blank solutions was verified. Raman and Rayleigh scatterings of water were eliminated by subtracting the EEM spectra of Milli-Q water as blank or were filtered using interpolation (Bahram et al., 2006). The measurement of EEM spectra was conducted in quadruplicate. Normalization of fluorescent intensity was performed according to Murphy et al. (2010).
The EPS samples for FTIR analysis were dried overnight by lyophilization. FTIR spectra were recorded using an attenuated reflectance (ATR)-FTIR spectrometer (Bruker Tensor 27, Ettlingen, Germany) with a DLaTGS detector and a KBr beamsplitter. Each sample was placed in an ATR cell with a platinum single crystal, and then scanned from 4 000/cm to 400/cm at a resolution of 2/cm. Data were analyzed using OPUS 7.2 software.
2.7 Chemical assays and statistical analysesPhycocyanin (PC) and chlorophyll a (Chl a) were extracted and measured following a previous study (Duan et al., 2021). Polysaccharide and protein in EPS samples were determined by the anthrone-sulfuric acid method (Li et al., 2013) and Bradford's method (Bradford, 1976), respectively. All measurements were performed in triplicate. The contents of pigment and EPS were divided by cell volume and cell surface area, respectively, to eliminate the potential interferences from cell size. The cell volume and cell surface area were calculated based on the cell diameter.
EEM spectra were decomposed using PARAFAC analysis coupled with DOMFluor toolbox (http://www.models.life.ku.dk/) in MATLAB 12.0 (Mathworks, Natick, MA) following a tutorial (Stedmon and Bro, 2008). Data are presented as means±standard deviation (SD). Pearson correlation analysis was employed to estimate the relationships among physiological characteristics, extracellular polysaccharide and protein content, and particulate size of Microcystis strains. Structural equation modelling (SEM) was conducted in Amos 21.0.0 to evaluate effects of physiological and extracellular properties on colony formation. Principal component analysis (PCA) was performed using the "prcomp" function in the "stats" package of R to identify the potential correlation between EPS chemical composition and colony formation. Significant differences in photosynthetic activity (Fv/Fm), growth rate, and cellular pigment and EPS content among different strains were analyzed with one-way ANOVA in SPSS 22.0 after testing for homoscedasticity. The significance level for comparative purposes was defined at P < 0.05, unless mentioned otherwise.
3 RESULT 3.1 Intraspecific variations in morphological and physiological traitsThe cell size of the six strains varied from 2.2 μm to 5.0 μm in diameter (Table 1). TM1 and TM2 formed large colonies with the average colony sizes at 483.1 and 121.3 μm, respectively. The particulate size distribution of FACHB908 and FACHB1294 were bimodal with peaks at around 2.5 and 70 μm, which indicated the cell diameter and colony size, respectively. It revealed that culture suspensions of both strains contained unicells and small colonies. TM1(u) and FACHB469 were unicells (Fig. 1a).

|
| Fig.1 Particulate size distribution curves (a) and microscopic images (b) of the six strains; interspecific variations in Chl a (c) and phycocyanin (d) content, photosynthetic activity (Fv/Fm) (e), and growth rate (f) Different letters indicate the significant differences at P < 0.05. |
These strains differed from pigment content (Fig. 1c–d). The large colony strains (TM1 and TM2) contained much more Chl a (7–10 fg/μm3) and phycocyanin (~65 fg/μm), whereas the unicellular strains (TM1(u) and FACHB469) have less pigment (~3.5-fg/μm3 Chl a and ~25-fg/μm3 PC). However, the unicells and small colonies (FACHB906 and FACHB1294) grew much faster than the large colonies (Fig. 1f). Similar Fv/Fm values (~0.42) were found among these strains (P > 0.05), indicating a comparable photosynthetic efficiency (Fig. 1e).
3.2 Intraspecific variations in extracellular propertiesCells of the large colonial strains contained high EPS content, especially the massive bound EPS (L-and T-EPS) (Fig. 2). Specifically, polysaccharide content in EPS of the large colonies (TM1 and TM2) was approximately 3 times higher than those of the unicells (TM1(u) and FACHB469). T-EPS was the main EPS fraction (> 50% of total EPS). There was no difference in EPS polysaccharide content between the small colonies strain FACHB908 and the unicellular strain FACHB469 (Fig. 2a), where both strains contained less extracellular polysaccharides (12.1 fg/μm2 for FACHB908 and 13.3 fg/μm2 for FACHB469). Large colonies strains contained more extracellular protein as well (Fig. 2b). However, protein content in EPS of the unicellular strain TM1(u) was dramatically higher than those of the small colonies (FACHB908 and FACHB1294). The unicellular strain FACHB469 contained the lowest extracellular proteins (2.6 fg/μm2).

|
| Fig.2 Polysaccharide and protein contents in EPS fractions of the six strains Different letters indicate the significant differences of the total EPS at P < 0.05. |
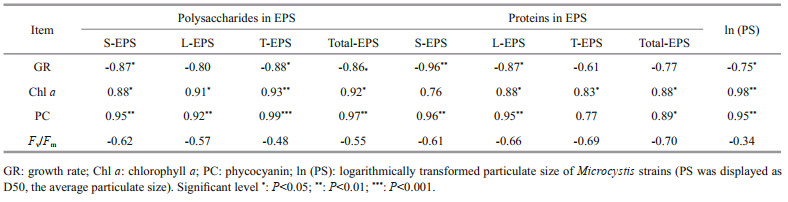
Extracellular polysaccharide content (particularly the polysaccharides in T-EPS) was negatively correlated with growth rate, but positively with Chl a and phycocyanin contents (RPearson > 0.9, P < 0.05). Extracellular protein content was positively related to pigment content as well. Particulate size of the strains was negatively related to the growth rate (RPearson=-0.75, P < 0.05), but positively associated with Chl a and phycocyanin contents (RPearson > 0.95, P < 0.01). Non-significant correlation was observed between photosynthetic activity (Fv/Fm) and extracellular polysaccharides, extracellular proteins, and particulate size (Table 2).
|
Effects of physiological and extracellular properties on colony formation were further estimated by structural equation modeling (Fig. 3). Chl a positively affected growth rate and enhanced extracellular polysaccharide and protein accumulation, whereas phycocyanin mainly negatively responded to growth rate with a standardized path coefficient at -1.60. Polysaccharides negatively responded to growth rate as well, indicating that phycocyanin could enhance polysaccharide accumulation indirectly. Polysaccharide accumulation was the main contributor to particulate size with a standardized path coefficient at 1.98. Conversely, extracellular protein negatively correlated with particulate size.

|
| Fig.3 The effect of physiological and extracellular properties on the colony formation as estimated using structural equation modelling χ2=12.1, P=0.1, GFI=0.86, RMR=0.002. Blue lines indicate positive effects, while red lines indicate negative effects. The width of arrows indicates the strength of significant standardized path coefficients (P < 0.05). Paths with non-significant coefficients are not shown. Chl a: chlorophyll a; PC: phycocyanin; GR: growth rate; Total-Pol.: polysaccharide content in all EPS fractions (including S-, L- and T-EPS); Total-Pro.: protein content in all EPS fractions; PS, particulate size of the strains was displayed as D50 (the average particulate size). |
To examine the potential key components in EPS facilitating colony formation of Microcystis, EEM was employed to characterize EPS composition in all the fractions (Supplementary Figs.S1–S3). Assignments of the peaks identified in the EEM contours are summarized in Supplementary Tables S1 & S2 shows the identified peaks in different EPS fractions and strains. As for S-EPS, both large colonial strains (TM1 and TM2) and unicellular strains (TM1(u) and FACHB469) contained tryptophan- and humic-like substances, while only humic-like substances were observed in S-EPS of the small colonial strains (FACHB908 and FACHB1294). Tryptophan-like substances were identified in all samples of the L-EPS fraction, but additional humic-like substances were observed in the small colonial strains (Supplementary Table S2). Humic- and tyrosine-like substances were identified in the T-EPS fraction of colonial strains, while tryptophan- and humic-like substances were in unicellular strains except for the tyrosine-like substances of TM1(u).
The PARAFAC analysis was conducted to decompose the fluorescence EEM spectra and to semi-quantitatively identify the fluorophore composition using PARAFAC-derived compounds. A five-component model was appropriate according to the residual and split-half analyses of the PARAFAC (Supplementary Fig.S4), and the five components are shown in Supplementary Fig.S5. Specifically, component 1 (C1, excitation/emission (Ex/Em)=(230, 280)/336) and component 3 (C3, Ex/Em=(220, 272)/292) were attributed to tryptophan-like and tyrosine-like substances, respectively (Xu et al., 2013a; Duan et al., 2019). Component 2 (C2, Ex/Em=280/346) was identified as protein-like substances (Chen et al., 2003). Component 4 (C4, Ex/Em=(260, 370)/452) and component 5 (C5, Ex/Em=(230, 280, 360)/444) were attributed to humic-like substances (Xu et al., 2014; Xiao et al., 2019).
The main fluorescent components in S-EPS were C2 and C4, whereas C1 and C2 dominated in L-EPS of the large colonies and unicellular strains (Fig. 4a). T-EPS was more complex and composed of the five PARAFAC-derived components. Specifically, C3 and C5 dominated in T-EPS of the colonial strains, but a weak signal of them in the unicells, indicating C3 and C5 may play an essential role in colony formation of Microcystis. Plots of PCA showed that fluorescent component composition in S-EPS and L-EPS failed to distinguish colonies and unicells, indicating colonies and unicells shared some identical components in both EPS fractions (Fig. 4b). In the PCA plot of the T-EPS, however, colonies and unicells were separated under the first PCA axis (PC1) that explained 74.0% of the total variation (Fig. 4b). Fluorescent C3, C4, and C5 negatively contributed to PC1, but they were positively related to colony formation (especially the C3). In comparison, C1 and C2 positively contributed to PC1, but negatively related to colony formation.

|
| Fig.4 Fluorescent component composition in the EPS fractions of Microcystis strains as estimated by EEM coupled with PARAFAC analysis based on the five PARAFAC-derived components (a); principal component analysis (PCA) plots of the variation in the fluorescent composition of the EPS fractions (b) C1, C2, C3, C4, and C5 are the PARAFAC-derived components in EEM of the EPS fractions. LC: large colonies; SC: small colonies; UC: unicellular Microcystis. |
To further explore functional groups of organic molecules in the tightly bound EPS (T-EPS), FTIR was conducted. The FTIR spectra of T-EPS samples are illustrated in Fig. 5; the dominant bands with their assignments are included in Supplementary Table S3. The FTIR spectra of T-EPS extracted from colonial strains were highly overlapping, which significantly differed from those of the unicellular ones, especially the FACHB469. The band around 3 394/cm (hydrogen bonded N-H and O-H stretching vibrations) and 3 182/cm (stretching vibration of hydrogen bonded-CONH2) (Griffiths and de Haseth, 2006) were observed merely in T-EPS of colonies. The peaks at 2 918/cm and 2 848/cm pertaining to the methyl-metal stretching vibration (from 2 810/cm to 3 050/cm) (Nakamoto, 2009) were much stronger in T-EPS of colonial strains, but weak or disappeared in unicellular ones. Similarly, the peaks at 1 469/cm and 1 418/cm were found in T-EPS of colonial strains, which assigned to stretching vibration of -CH2 or -COO– groups (Xu et al., 2017; Wang et al., 2018). The bands of 1 644/cm (C=O/C=N stretches in δ-lactam or proteins) (Xu et al., 2013c) and 1 039/cm (stretching vibration of -CO or -OH in polysaccharides) (Duan et al., 2019) appeared in all the T-EPS samples, indicating there were common proteins or polysaccharides in T-EPS. The fingerprint region included a band at 646/cm (assigned to ring vibrations from aromatic amino acids) (Wang et al., 2018) in T-EPS of colonial strains, which was red-shift in that of the unicellular FACHB469.

|
| Fig.5 FTIR spectra of the tightly bound EPS extracted from the six Microcystis strains LC: large colonies; SC: small colonies; UC: unicellular Microcystis. |
In this study, Microcystis strains differed profoundly in their EPS protein and polysaccharide contents, particularly in the tightly bound EPS (Fig. 2). This EPS fraction has been recognized to greatly contribute to colony formation (Li et al., 2013), especially at the early stage of cell adhesion (Xu et al., 2014). This can explain the positive effect of polysaccharide content in EPS on colony formation (Fig. 3). However, it should be noted that the relationship between EPS content and colony size is not in a straight line (Duan et al., 2018), and EPS composition dramatically impacts Microcystis colony size and morphology as well (Duan et al., 2019; Xiao et al., 2019).
The fluorophore composition in tightly bound EPS (T-EPS) was more complex compared to the soluble and loosely bound EPS, and it could be used to identify the colonial strains (Fig. 4). Specifically, tyrosine-like substances in the T-EPS were key components for colony formation, because they were observed mainly in the colonial strains rather than the unicells (Fig. 4). Tyrosine-like substances have also been found frequently and abundantly in various morphospecies of Microcystis colonies (i.e., M. ichthyoblabe, M. aeruginosa, and M. novacekii) collected from Taihu Lake, China (Xu et al., 2013b; Duan et al., 2019). In contrast, tyrosine-like substances were much lower in T-EPS of the unicellular strains, where tryptophan- and protein-like substances dominated (Fig. 4 and Table 1; see also Xu et al., 2013a). The existence of aromatic substances (e.g., tyrosine and tryptophan) in T-EPS was also confirmed by the FTIR spectra (Fig. 5).
Tyrosine is highly reactive due to the tyrosine residues. They are easy to form multi-tyrosine crosslinking in vitro via multiple physiologically and photochemically relevant reactions (e.g., enzymatic, photo-initiated), which may contribute to cell aggregation (Fig. 6). These reactions can also naturally occur in tyrosine residues or additional phenol moieties that may be added via tyramine derivatization to non-tyrosine-containing substrates (i.e., polysaccharides and humic-like substances) by bio- or photo-chemical reactions (Sofia et al., 2002; Partlow et al., 2016). It indicates that tyrosine-like substances could be a critical crosslinking agent for EPS assemblage. Alternatively, tyrosine-like substances were associated with cation captures (e.g., Fe3+) in EPS (Xu et al., 2013b), which can form a "bridge effect" of cations to bind mucilaginous EPS and cells (Xu et al., 2016b). It is consistent with the metal-binding groups that were detected abundantly in T-EPS of colonial strains, but significantly weak in that of the unicellular FACHB469 (Fig. 5). Humic-like substances often occurred in T-EPS (C4 and C5 in Fig. 4), which may contribute to colony formation as well (Duan et al., 2019; Xiao et al., 2019). However, the unicellular strain (TM1(u)) also contained higher humic-like substances in its T-EPS; for example, the humic-like C5 was nearly two-fold higher than that of the colonies strain of TM1 (Fig. 4). It indicates that humic-like substances could hardly gather cells by themselves.

|
| Fig.6 Mechanisms of tyrosine cross-linking reactions |
The large colonial strains invested large amounts of EPS production for colony formation, while the unicells were devoted to proliferation (Figs. 1–2). Pigment content commonly reflects the photosynthetic potential of light energy acquisition and transformation (Glazer, 1984). In photosystems (PS) of Microcystis, phycocyanin is the main light-harvesting pigment connecting to the reaction center (RC), which is composed of Chl a-protein complex or P680 in PSII (P700 in PSI is also a Chl a-protein complex) (Glazer, 1984; Grossman et al., 1993). Light photons captured by phycocyanin protein are transported into RC for photochemical reactions (e.g., ATP production and carbon fixation). Similar to Zhang et al.(2007, 2011), the colonial strains contained much more Chl a and phycocyanin compared to the unicellular ones (Fig. 1c–d). It indicates that the colonial strains contained a higher number of RCs in their photosystems. Moreover, colonies may be equipped with more effective photosystems. For example, Zhang et al. (2011) found that the Fv/Fm of colonies was much higher than that of the unicells, especially under high light intensities (> 300 photons/(m2·s)). However, in this study, all strains displayed a similar maximal quantum yield of PSII (Fv/Fm), implying comparable photosynthetic efficiencies among the strains. Therefore, enriching the RC number was a significant strategy of the colonial strains to promote carbon accumulation. Excessive carbon accumulation in cells facilitated EPS secretion (Fig. 2; see also Myklestad, 1995), and then colony formation (Yang et al., 2008).
Growth rate was negatively related to colony formation (Table 2; see also Li et al., 2013) through down-regulating carbon allocation into EPS production (Duan et al., 2021). It indicates that the large colonial strains might enhance EPS content via reducing growth rate as well (Fig. 1f). However, it should be noted that colony formation can elevate phycocyanin content but frustrate growth rate as well, owing to the strong effect of "self-shading" (Wilson et al., 2006). More phycocyanin content facilitates light acquisition of the inner cells of colonies (Zhang et al., 2011). This may be responsible for the significant negative relationship between phycocyanin and growth rate, and the indirectly positive effects of phycocyanin on extracellular polysaccharide production (Fig. 3; Table 1). Therefore, increasing phycocyanin in the colonial strains could partly compensate for the negative effect of "self-shading" on light harvesting. Nevertheless, it offers new insights into the effect of photosynthetic energy acquisition and reallocation on colony formation (Fig. 3).
5 CONCLUSIONThis study estimated the linkages between colony formation and the variations in physiological traits and extracellular characteristics in six Microcystis strains. The chemical components of EPS involved in colony formation were identified. Our data revealed that increasing in photosynthetic reaction centers and reducing growth rate could be the main strategies of Microcystis to enhance EPS production, then enlarging colony size. Although five PARAFAC-derived fluorescent components were identified in the tightly bound EPS (T-EPS), tyrosine-like substances acted as a crosslinking agent and connected polysaccharides and humic- or protein-like substances for EPS assemblage and thus enhancing colony formation. This study provides a better understanding of how physiological and extracellular properties contribute to colony formation in cyanobacteria.
6 DATA AVAILABILITY STATEMENTThe datasets generated during and/or analyzed during this study are available from the corresponding author on reasonable request.
Electronic supplementary material
Supplementary material (Supplementary Figs.S1–S5 and Supplementary Tables S1–S3) is available in the online version of this article at https://doi.org/10.1007/s00343-022-1353-5.
Bahram M, Bro R, Stedmon C, et al. 2006. Handling of Rayleigh and Raman scatter for PARAFAC modeling of fluorescence data using interpolation. Journal of Chemometrics, 20(3-4): 99-105.
DOI:10.1002/cem.978 |
Bradford M M. 1976. A rapid and sensitive method for the quantitation of microgram quantities of protein utilizing the principle of protein-dye binding. Analytical Biochemistry, 72(1-2): 248-254.
DOI:10.1016/0003-2697(76)90527-3 |
Chen W, Westerhoff P, Leenheer J A, et al. 2003. Fluorescence excitation-emission matrix regional integration to quantify spectra for dissolved organic matter. Environmental Science & Technology, 37(24): 5701-5710.
DOI:10.1021/es034354c |
Duan Z P, Tan X, Li N G. 2017. Ultrasonic selectivity on depressing photosynthesis of cyanobacteria and green algae probed by chlorophyll-a fluorescence transient. Water Science & Technology, 76(8): 2085-2094.
DOI:10.2166/wst.2017.376 |
Duan Z P, Tan X, Paerl H W, et al. 2021. Ecological stoichiometry of functional traits in a colonial harmful cyanobacterium. Limnology and Oceanography, 66(5): 2051-2062.
DOI:10.1002/lno.11744 |
Duan Z P, Tan X, Parajuli K, et al. 2018. Colony formation in two Microcystis morphotypes: effects of temperature and nutrient availability. Harmful Algae, 72: 14-24.
DOI:10.1016/j.hal.2017.12.006 |
Duan Z P, Tan X, Parajuli K, et al. 2019. Characterization of Microcystis morphotypes: implications for colony formation and intraspecific variation. Harmful Algae, 90: 101701.
DOI:10.1016/j.hal.2019.101701 |
Duan Z P, Tan X, Zhang D F, et al. 2020. Development of thermal treatment for the extraction of extracellular polymeric substances from Microcystis: evaluating extraction efficiency and cell integrity. Algal Research, 48: 101879.
DOI:10.1016/j.algal.2020.101879 |
Forni C, Telo' F R, Caiola M G. 1997. Comparative analysis of the polysaccharides produced by different species of Microcystis (Chroococcales, Cyanophyta). Phycologia, 36(3): 181-185.
DOI:10.2216/i0031-8884-36-3-181.1 |
Gerphagnon M, Macarthur D J, Latour D, et al. 2015. Microbial players involved in the decline of filamentous and colonial cyanobacterial blooms with a focus on fungal parasitism. Environmental Microbiology, 17(8): 2573-2587.
DOI:10.1111/1462-2920.12860 |
Glazer A N. 1984. Phycobilisome a macromolecular complex optimized for light energy transfer. Biochimica et Biophysica Acta (BBA) - Reviews on Bioenergetics, 768(1): 29-51.
DOI:10.1016/0304-4173(84)90006-5 |
Griffiths P R, de Haseth J A. 2006. Fourier Transform Infrared Spectrometry. 2th ed. John Wiley & Sons, Inc., Hoboken, New Jersey.
|
Grossman A R, Schaefer M R, Chiang G G, et al. 1993. The phycobilisome, a light-harvesting complex responsive to environmental conditions. Microbiological Reviews, 57(3): 725-749.
|
Harke M J, Steffen M M, Gobler C J, et al. 2016. A review of the global ecology, genomics, and biogeography of the toxic cyanobacterium, Microcystis spp. Harmful Algae, 54: 4-20.
DOI:10.1016/j.hal.2015.12.007 |
Helm R F, Potts M. 2012. Extracellular matrix (ECM). In: Whitton B A ed. Ecology of Cyanobacteria Ⅱ: Their Diversity in Space and Time. Springer, Dordrecht. p. 461-480, https://doi.org/10.1007/978-94-007-3855-3_18.
|
Li M, Zhu W, Gao L, et al. 2013. Changes in extracellular polysaccharide content and morphology of Microcystis aeruginosa at different specific growth rates. Journal of Applied Phycology, 25(4): 1023-1030.
DOI:10.1007/s10811-012-9937-7 |
Li M, Zhu W, Gao L. 2014. Analysis of cell concentration, volume concentration, and colony size of Microcystis via laser particle analyzer. Environmental Management, 53(5): 947-958.
DOI:10.1007/s00267-014-0252-8 |
Liu L Z, Qin B Q, Zhang Y L, et al. 2014. Extraction and characterization of bound extracellular polymeric substances from cultured pure cyanobacterium (Microcystis wesenbergii). Journal of Environmental Sciences, 26(8): 1725-1732.
DOI:10.1016/j.jes.2014.06.013 |
Murphy K R, Butler K D, Spencer R G M, et al. 2010. Measurement of dissolved organic matter fluorescence in aquatic environments: an interlaboratory comparison. Environmental Science & Technology, 44(24): 9405-9412.
DOI:10.1021/es102362t |
Murphy K R, Stedmon C A, Wenig P, et al. 2014. OpenFluor-an online spectral library of auto-fluorescence by organic compounds in the environment. Analytical Methods, 6(3): 658-661.
DOI:10.1039/C3AY41935E |
Myklestad S M. 1995. Release of extracellular products by phytoplankton with special emphasis on polysaccharides. Science of The Total Environment, 165(1-3): 155-164.
DOI:10.1016/0048-9697(95)04549-G |
Nakamoto K. 2009. Infrared and Raman Spectra of Inorganic and Coordination Compounds: Part B: Applications in Coordination, Organometallic, and Bioinorganic Chemistry. 6th ed. John Wiley & Sons, Inc., Hoboken. 416p.
|
Partlow B P, Applegate M B, Omenetto F G, et al. 2016. Dityrosine cross-linking in designing biomaterials. ACS Biomaterials Science & Engineering, 2(12): 2108-2121.
DOI:10.1021/acsbiomaterials.6b00454 |
Pereira S, Zille A, Micheletti E, et al. 2009. Complexity of cyanobacterial exopolysaccharides: composition, structures, inducing factors and putative genes involved in their biosynthesis and assembly. FEMS Microbiology Reviews, 33(5): 917-941.
DOI:10.1111/j.1574-6976.2009.00183.x |
Shen H, Song L R. 2007. Comparative studies on physiological responses to phosphorus in two phenotypes of bloom-forming Microcystis. Hydrobiologia, 592(1): 475-486.
|
Sheng G P, Yu H Q, Li X Y. 2010. Extracellular polymeric substances (EPS) of microbial aggregates in biological wastewater treatment systems: a review. Biotechnology Advances, 28(6): 882-894.
DOI:10.1016/j.biotechadv.2010.08.001 |
Sofia S J, Singh A, Kaplan D L. 2002. Peroxidase-catalyzed crosslinking of functionalized polyaspartic acid polymers. Journal of Macromolecular Science, Part A, 39(10): 1151-1181.
DOI:10.1081/MA-120014843 |
Stal L J. 2017. Gregarious cyanobacteria. Environmental Microbiology, 19(6): 2105-2109.
DOI:10.1111/1462-2920.13739 |
Stanier R Y, Kunisawa R, Mandel M, et al. 1971. Purification and properties of unicellular blue-green algae (Order Chroococcales). Bacteriological Reviews, 35(2): 171-205.
DOI:10.1128/br.35.2.171-205.1971 |
Stedmon C A, Bro R. 2008. Characterizing dissolved organic matter fluorescence with parallel factor analysis: a tutorial. Limnology and Oceanography: Methods, 6(11): 572-579.
DOI:10.4319/lom.2008.6.572 |
Stedmon C A, Markager S. 2005. Tracing the production and degradation of autochthonous fractions of dissolved organic matter by fluorescence analysis. Limnology and Oceanography, 50(5): 1415-1426.
DOI:10.4319/lo.2005.50.5.1415 |
Sukenik A, Kaplan A. 2021. Cyanobacterial harmful algal blooms in aquatic ecosystems: a comprehensive outlook on current and emerging mitigation and control approaches. Microorganisms, 9(7): 1472.
DOI:10.3390/microorganisms9071472 |
Wang B B, Liu X T, Chen J M, et al. 2018. Composition and functional group characterization of extracellular polymeric substances (EPS) in activated sludge: the impacts of polymerization degree of proteinaceous substrates. Water Research, 129: 133-142.
DOI:10.1016/j.watres.2017.11.008 |
Wilson A E, Kaul R B, Sarnelle O. 2010. Growth rate consequences of coloniality in a harmful phytoplankter. PLoS One, 5(1): e8679.
DOI:10.1371/journal.pone.0008679 |
Wilson A E, Wilson W A, Hay M E. 2006. Intraspecific variation in growth and morphology of the bloom-forming cyanobacterium Microcystis aeruginosa. Applied and Environmental Microbiology, 72(11): 7386-7389.
DOI:10.1128/AEM.00834-06 |
Wu Z X, Song L R. 2008. Physiological comparison between colonial and unicellular forms of Microcystis aeruginosa Kȹtz. (Cyanobacteria). Phycologia, 47(1): 98-104.
DOI:10.2216/07-49.1 |
Xiao M, Li M, Duan P F, et al. 2019. Insights into the relationship between colony formation and extracellular polymeric substances (EPS) composition of the cyanobacterium Microcystis spp. Harmful Algae, 83: 34-41.
DOI:10.1016/j.hal.2019.02.006 |
Xiao M, Li M, Reynolds C S. 2018. Colony formation in the cyanobacterium Microcystis. Biological Reviews, 93(3): 1399-1420.
DOI:10.1111/brv.12401 |
Xu F, Zhu W, Xiao M, et al. 2016a. Interspecific variation in extracellular polysaccharide content and colony formation of Microcystis spp. cultured under different light intensities and temperatures. Journal of Applied Phycology, 28(3): 1533-1541.
DOI:10.1007/s10811-015-0707-1 |
Xu H C, Cai H Y, Yu G H, et al. 2013a. Insights into extracellular polymeric substances of cyanobacterium Microcystis aeruginosa using fractionation procedure and parallel factor analysis. Water Research, 47(6): 2005-2014.
DOI:10.1016/j.watres.2013.01.019 |
Xu H C, Jiang H L, Yu G H, et al. 2014. Towards understanding the role of extracellular polymeric substances in cyanobacterial Microcystis aggregation and mucilaginous bloom formation. Chemosphere, 117: 815-822.
DOI:10.1016/j.chemosphere.2014.10.061 |
Xu H C, Lv H, Liu X, et al. 2016b. Electrolyte cations binding with extracellular polymeric substances enhanced Microcystis aggregation: implication for Microcystis bloom formation in eutrophic freshwater lakes. Environmental Science & Technology, 50(17): 9034-9043.
DOI:10.1021/acs.est.6b00129 |
Xu H C, Yan Z S, Cai H Y, et al. 2013b. Heterogeneity in metal binding by individual fluorescent components in a eutrophic algae-rich lake. Ecotoxicology and Environmental Safety, 98: 266-272.
DOI:10.1016/j.ecoenv.2013.09.008 |
Xu H C, Yu G H, Jiang H L. 2013c. Investigation on extracellular polymeric substances from mucilaginous cyanobacterial blooms in eutrophic freshwater lakes. Chemosphere, 93(1): 75-81.
DOI:10.1016/j.chemosphere.2013.04.077 |
Xu H, Paerl H W, Qin B Q, et al. 2010. Nitrogen and phosphorus inputs control phytoplankton growth in eutrophic Lake Taihu, China. Limnology and Oceanography, 55(1): 420-432.
DOI:10.4319/lo.2010.55.1.0420 |
Xu Y, Lu Y Q, Dai X H, et al. 2017. The influence of organic-binding metals on the biogas conversion of sewage sludge. Water Research, 126: 329-341.
DOI:10.1016/j.watres.2017.09.046 |
Yang Z, Kong F X, Shi X L, et al. 2008. Changes in the morphology and polysaccharide content of Microcystis aeruginosa (cyanobacteria) during flagellate grazing. Journal of Phycology, 44(3): 716-720.
DOI:10.1111/j.1529-8817.2008.00502.x |
Zhang M, Kong F X, Tan X, et al. 2007. Biochemical, morphological, and genetic variations in Microcystis aeruginosa due to colony disaggregation. World Journal of Microbiology and Biotechnology, 23(5): 663-670.
DOI:10.1007/s11274-006-9280-8 |
Zhang M, Shi X L, Yu Y, et al. 2011. The acclimative changes in photochemistry after colony formation of the cyanobacteria Microcystis aeruginosa. Journal of Phycology, 47(3): 524-532.
DOI:10.1111/j.1529-8817.2011.00987.x |