 2022, Vol. 40
Institute of Oceanology, Chinese Academy of Sciences
Article Information
- ZHOU Lei, HUANG Shihui, WANG Qing, LI Zhenhai, LI Zongyang, HE Anyou, CHEN Jiehu, LIU Li, ZOU Keshu
- Novel evolutionary insights into nemacheilid cavefish: evidence from comparative analysis of mitochondrial genomes
- Journal of Oceanology and Limnology, 40(4): 1640-1653
- http://dx.doi.org/10.1007/s00343-021-1047-4
Article History
- Received Feb. 24, 2021
- accepted in principle May 31, 2021
- accepted for publication Sep. 13, 2021


2 Guangxi Key Laboratory of Aquatic Genetic Breeding and Healthy Aquaculture, Guangxi Academy of Fishery Sciences, Nanning 530021, China;
3 Science Corporation of Gene, Guangzhou 510000, China
Cavefish are unique hypogean species whose evolutionary histories are associated with caves and other subterranean waters (Ma et al., 2019). There are two kinds of cavefish: stygobionts (also called typical or troglomorphic cavefishes) and stygophiles (also called atypical or non-troglomorphic cavefishes) (Zhao et al., 2011). Stygobionts are obligate cavefish whose adaptive traits, such as the degeneration or loss of eyes and reduced pigmentation, both enable and restrict them to complete their entire life cycles within cave environments. Stygophiles are not limited to hypogean aquatic environments but rely heavily on cave habitats during their life cycles (Ma et al., 2019).
Globally, more than 350 species of cavefish live in caves and other subterranean habitats, including at least 199 species of stygobionts (Niemiller et al., 2019). Most cavefish species are found in the subtropics and tropics, and 75% of known populations are located in Southeast Asia or Central and South America within karst landscapes (Ma et al., 2019).
There are 148 described species of cavefish in China (accounting for 39% of such species worldwide), most of which reside within the 620 000 km2 of karst landscape in the southwest (Huang et al., 2008). Karst landscapes feature complex surfaces and underground systems and provide diverse habitat to aquatic and terrestrial species (Deharveng et al., 2009; Luo et al., 2016). However, most species are limited to one independent cave or subterranean stream (Shu et al., 2013). For example, Heminoemacheilus hyalinus is only distributed in a single cave in Du'an in the Guangxi Zhuang Autonomous Region. Karst habitats comprise variable and unique geological structures that can harbor communities of highly endemic and endangered species (Luo et al., 2016); these habitats are extremely fragile and sensitive to environmental change (Zhao et al., 2011; Palandačić et al., 2012). Caves are natural laboratories for ecological and evolutionary research, and the ability of cavefish to survive in extreme environments makes them excellent models for adaptation studies (Riddle et al., 2018). However, difficulties in accessing and sampling remote caves have limited study of these ecosystems (Shu et al., 2013). As such, many cave species remain poorly studied, particularly with regard to their genome-level characteristics.
Cave environments are characterized by permanent darkness. The lack of autotrophic primary producers in dark environments can lead to restrictions in food supply; hence, cavefish have likely developed strategies to enhance their energy utilization to survive. Mitochondria play vital roles in energy metabolism. Cavefish mitochondrial DNA (mtDNA) may have undergone positive directional selection in response to the extreme environmental pressures in cave habitats (Boore, 1999; Xu et al., 2007; Tomasco and Lessa, 2011). Generally, mtDNA is characterized by its simple structure, small size, maternal inheritance, and rapid evolution (Avise et al., 1984) and has been extensively studied in relation to taxonomy, genetics, phylogenetics, and evolution (Satoh et al., 2016; Liu et al., 2017). However, few fully sequenced cavefish mitochondrial genomes (mitogenomes) are available with which to study adaptive evolution to subterranean life.
Nemacheilidae is the most diverse cavefish family (53 species) (Niemiller et al., 2019), which may have arisen due to the strong selective pressures found in isolated cave habitats (Zhao and Zhang, 2009). In southwest China, nemacheilid cavefish exhibit rich species diversity and some species, such as Paranemachilus pingguoensis, have relatively large population sizes (Lan et al., 2013). Nemacheilid fish can be valuable for systematic study of cavefish evolution and adaptation and can serve as references for the study of karst development in the Yunnan-Guizhou area. However, despite their great scientific value, Nemacheilidae cavefish have been much less studied than their surface-dwelling counterparts, with very few studies to date (Lan et al., 2013).
In the current research, the complete mitogenomes of three nemacheilid cavefish species, i.e., Paranemachilus pingguoensis, Oreonectes polystigmus, and Heminoemacheilus longibarbatus, were sequenced. In morphology, O. polystigmus can be distinguished from P. pingguoensis and H. longibarbatus by caudal fin rounded and tip of anterior nostril elongated and barbel-like. H. longibarbatus and P. pingguoensis share closely set nostrils but can be separated from each other by cheek scales present in Paranemachilus vs. absent in Heminoemacheilus. The genomic characteristics of these cavefish were compared with those of closely related species within Nemacheilidae to investigate genetic adaptations to cave habitats. The evolutionary history of the nemacheilid cavefish was explored and found to be linked to geological events that altered the karst environments.
2 MATERIAL AND METHOD 2.1 Sample collectionParanemachilus pingguoensis (tag number: PG-20190701; GPS: 23.33°N, 107.32°E), Oreonectes polystigmus (tag number: DB-20190701; GPS: 25.03°N, 110.31°E), and Heminoemacheilus longibarbatus (tag number: CX-20190701; GPS: 24.11°N, 108.10°E) specimens used in this study were collected in Guangxi Zhuang Autonomous Region, China in July 2019 using a cage net (mesh size: 0.70 cm, length: 20 m, width: 45 cm, height: 33 cm). After collection, specimens were euthanized in tricaine mesylate (MS-222), and then dissected. Muscle tissues were preserved in 95% ethanol in the field and transferred to a -80-℃ freezer for long-term storage in a laboratory at the College of Marine Sciences, South China Agricultural University (SCAU), China. The experiments were approved by the Animal Ethics Committee of SCAU (SYXK-2019-0136).
2.2 DNA extraction and mitogenome sequencingGenomic DNA was extracted from the muscle tissue samples using an EZNA® Tissue DNA kit (Omega Bio-tek, USA) following the manufacturer's instructions. The DNA was evaluated and quantified using 1.0% gel electrophoresis followed by ultraviolet spectroscopy (NanoDrop 2000, Thermo Fisher Scientific, USA). The resulting high-quality genomic DNA was isolated and used for library construction (TruseqTM RNA Sample Prep Kit, Illumina, USA), with a 350-bp insert used for paired-end (150 bp) sequencing on the HiSeq4000 platform (Illumina). The mitogenomes then underwent next-generation sequencing following the manufacturer's instructions.
2.3 Analysis of sequence dataRaw sequencing data were retrieved and trimmed using Cutadapt v1.16 software with the parameters -q 20 -m 20 (http://cutadapt.readthedocs.io/) to obtain clean data. The clean paired-end reads were then used for de novo assembly using NOVOPlasty v3.8 software (Dierckxsens et al., 2017).
The mitogenomes were annotated using Mitofish v3.51 (Iwasaki et al., 2013) and ORF Finder (https://www.ncbi.nlm.nih.gov/orfinder/). The preliminary results were compared with the coding proteins and rRNA of mitogenomes from related species, using Blastp and Blastn (https://blast.ncbi.nlm.nih.gov/Blast.cgi), respectively, to confirm and correct the accuracy of the results. The complete mitochondrial DNA sequences were deposited in GenBank under accession numbers MW043720 (P. pingguoensis), MW043721 (H. longibarbatus), and MW043722 (O. polystigmus).
Mitochondrial codon usage biases can affect gene expression and reflect the evolutionary relationships among species (Wei et al., 2014). Therefore, the relative synonymous codon usage (RSCU) for each genome was analysed (Sharp and Li, 1987). Repeat sequences were isolated using Tandem Repeats Finder v4.04. The skew associated with nucleotide bases was calculated using the following formulae: adenine (A) and thymine (T) skew=(A T)/(A+T) and guanine (G) and cytosine (C) skew=(G C)/(G+C). Non-synonymous/synonymous mutation (Ka/Ks) ratios were calculated and applied to investigate the influence of selective pressures on protein-coding genes (PCGs) in cavefishes and related species; this was performed using the seqinr package in R software (Charif and Lobry, 2007).
2.4 Phylogenetic analysisThe mitogenome sequences of 61 nemacheilid species were subjected to phylogenetic analyses, with Leptobotia pellegrini (NC_031602) rooted as the outgroup. We aligned the individual genes for all species using MUSCLE v.3.8.31 (Edgar, 2004) according to the selected coding sequence. Following alignment, the genes of each species were then connected into a series that was integrated into a corresponding PCG sequence set for the following analyses.
Phylogenetic analyses were conducted using two approaches: maximum likelihood (ML) and Bayesian inference (BI). The DNA models were tested using jModelTest (Posada, 2008) based on selected sequences; the best model was selected based on the minimum Akaike information criterion. For the ML phylogenetic analysis, RAxML v8.1.5 software (Stamatakis, 2014) was applied using 1 000 bootstrap replicates. The number of replicates was determined automatically using the protein substitution model with the highest score. For the BI phylogenetic analysis, MrBayes v3.2.6 (Ronquist et al., 2012) was used, and results were considered reliable if the split frequency standard deviations were < 0.01.
A molecular clock was constructed using MEGA X v10.1.7 software (Kumar et al., 2018) following phylogenetic and corresponding sequence analyses using ML. The differentiation times among species were queried using TimeTree (Kumar et al., 2017) with the following reference differentiation times: 11.70million years ago (Ma) 45.42 Ma for Triplophysa stenura and Schistura fasciolata, 1.50 Ma 11.69 Ma for Lefua nikkonishe and Lefua costata and 48 Ma 103 Ma for Oreonectes platycephalus and Triplophysa stenura.
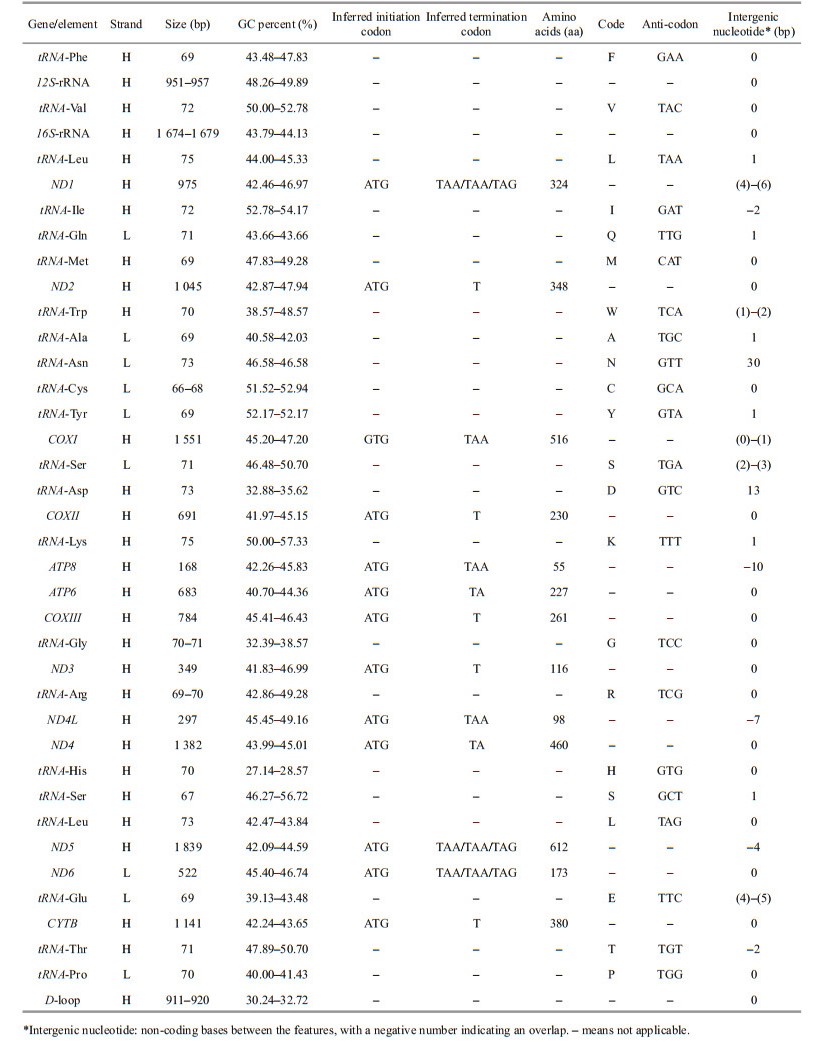
3 RESULT 3.1 Mitogenome organization and compositionThe complete mitogenomes of Oreonectes polystigmus, Paranemachilus pingguoensis, and H. longibarbatus were 16 568, 16 562, and 16 569 bp in length, respectively. They each contained the canonical 13 PCGs, two rRNA genes (12S and 16S), 22 tRNA genes, and a D-loop control region. The majority of the genes are encoded by the heavy strand (H-strand), except for nicotinamide adenine dinucleotide hydride (NADH) dehydrogenase subunit 6 (ND6) and eight tRNA genes for glutamine, alanine, asparagine, cysteine, tyrosine, serine, glutamate, and proline, which were all located on the light strand (L-strand) (Fig. 1 and Table 1). The two rRNAs, 16S and 12S, were located between tRNA-Leu (TAA) and tRNA-Val (TAC) and between tRNA-Val (TAC) and tRNA-Phe (CAA), respectively (Fig. 1).

|
| Fig.1 The complete mitogenomes of Paranemachilus pingguoensis, Oreonectes polystigmus, and Heminoemacheilus longibarbatus The outer circle represents light strand, and inner circle represents heavy strand. CDS: coding sequence. |
|
The nucleotide composition (H-strand) of the three cavefish in descending order was 30.13% A, 27.69% C, 25.75% T, and 16.43% G, with an AT content of 55.88% (54.91%–56.44%).
Most PCGs had a negative GC skew, except for ND6, which exhibited a positive GC skew (Fig. 2). Furthermore, the AT skews of most PCGs were around zero, except for ND6, which had a negative AT skew (-0.48, -0.53, and -0.50 for Oreonectes polystigmus, Paranemachiluspingguoensis, and Heminoemacheilus longibarbatus, respectively).

|
| Fig.2 AT- and GC-skew in PCGs of Oreonectes polystigmus (a), Paranemachilus pingguoensis (b), and Heminoemacheilus longibarbatus (c) mitogenome |
The coding regions of the three species were 11 427 bp (3 800 amino acids) in length, accounting for approximately 69% of the total mitogenome. The initiation codon for most PCGs was the canonical methionine sequence (ATG), with the exception of the start codon for COXI, which was GTG. We also identified T, TA, TAA, and TAG termination codons in the cavefish mitogenomes, with TAA and T being the most prevalent. The TAG termination codon was only found in the ND1, ND5, and ND6 genes of Heminoemacheilus longibarbatus (Table 1).
For the three examined species, all amino acids were encoded by two or four codon variations, except for leucine and serine, which were encoded by six (Fig. 3). RSCU analysis revealed that the following codon sequences had higher frequencies: stop (TAA), arginine (CGA), and leucine (CTA). According to RSCU values, codons with A or C in the third position occurred more frequently than those with T or G (Fig. 3).

|
| Fig.3 Relative synonymous codon usage (RSCU) of mitogenomes for Paranemachilus pingguoensis (a), Oreonectes polystigmus (b), and Heminoemacheilus longibarbatus (c) |
The PCG Ka/Ks ratios were all < 1 (Fig. 4). The Ka/Ks ratios for ATP8 and ND2 were the highest (Fig. 4).

|
| Fig.4 Ka/Ks ratios of 13 protein-coding genes in pairwise mitonchondrial genome of Paranemachilus pingguoensis, Oreonectes polystigmus, and Heminoemacheilus longibarbatus |
In total, 22 tRNA genes were identified in the three cavefishes, ranging from 66 bp (tRNA-Cys) to 75 bp (tRNA-Leu and tRNA-Lys) in length. In general, codons and anticodons exhibited a one-to-one relationship. However, two anticodons were present for both serine (TGA and GCT) and leucine (TAG and TAA). The dihydrouridine (DHU) arm of tRNA-Ser (GCT) was absent, whereas the secondary structures of the other 21 tRNAs exhibited typical clover structures.
3.5 Compositional biases between cavefishes and other nemacheilid speciesThe genomic sequences of other cavefishes (stygobionts and stygophiles) and other nemacheilid species were compared to investigate differences in nucleotide composition. Absolute value of GC and AT skews were higher in the cavefishes than in other nemacheilid species (Fig. 5); this was the case for the entire mitogenome, as well as for individual elements such as PCGs, rRNAs, and tRNAs. Principal component analyses (PCA) suggested that the overall codon and amino acid usage patterns of cavefishes were notably different from those of other fish (Fig. 5e & f).

|
| Fig.5 Comparison of nucleotide skews, codon usage, amino acid usage of the mitogenomes of stygobionts, stygophiles, and other Nemacheilidae species a–d. nucleotide skews of the full genomes, PCGs, rRNAs, and tRNAs, respectively; e–f. principal component analysis of the codon usage (e) and amino acid usage (f) in the PCGs of Nemacheilidae species. |
A phylogenetic tree was constructed based on the mitogenomic PCGs of 61 nemacheilid species, including three species of stygobionts and five species of stygophiles, with Leptobotia pellegrini as the outgroup (Fig. 6). Both ML and BI approaches produced trees with similar topologies and branch lengths, indicating a well-resolved and highly supported phylogeny of Nemacheilidae. The results show that the 61 nemacheilid species could be divided into four branches or clades. Clade Ⅰ included all species of Triplophysa and Barbatula. Clade Ⅱ was sister to Clade Ⅰ and comprised Homatula, Schistura, and Tuberoschistura. Clade Ⅲ included the genera Heminoeacheilus, Micronemacheilus, Oreonectes, Troglonectes, Paranemachilus, Lefua, and Traccatichthys. The other eight genera, Petruichthys, Schistura, Nemaceilus, Oxynoemacheilus, Nemachilichthys, Hedinichthys, Acanthocobitis, and Aborichthys, were clustered into Clade Ⅳ, which was positioned at the base of the Clade Ⅲ + (Clade Ⅱ + Clade Ⅰ) clade.

|
| Fig.6 Phylogenetic tree and divergence time of Nemacheilidae based on sequences of 13 PCGs Leptobotia pellegrini (GenBank: NC_031602) were included as the outgroup taxon. Stygobionts were marked with □, stygophiles △, and other Nemacheilidae species ○. Numbers along nodes indicate posterior probabilities (BI) and bootstrap support (ML). Number above BI/ML represents estimated mean divergence time (million years ago, Ma). |
The cavefishes were distributed across five genera (Triplophysa, Heminoemacheilus, Oreonectes, Troglonectes, and Paranemachilus) in Clade Ⅰ and Clade Ⅲ. In Clade Ⅰ, the genus Triplophysa appeared to diverge from the other species around 24.83 Ma (Fig. 6). In Triplohysa, the divergence of two stygobionts (Triplophysa xiangxiensis and Triplophysa rosa) from other non-cave species was estimated to have occurred around 20.93 Ma during the Miocene epoch. In Clade Ⅲ, the cavefishes (Paranemachilus jinxiensis, Paranemachilus pingguoensis, Troglonectes daqikongensis, and Troglonectes furcocaudalis) diverged from their sister group Lefua around 24.65 Ma during the Chattian age of the late Oligocene epoch. The stygophile Oreonectes polystigmus diverged from its surface counterpart (Oreonectes platycephalus) circa 6.40 Ma during the Messinian age of the late Miocene epoch, and the stygophile Heminoemacheilus longibarbatus diverged from its surface counterpart (Y. cruciatus) circa 18.91 Ma during the Burdigalian age of the Miocene epoch. In terms of divergence times among cavefishes, the occurrence range was 7.71 Ma (Triplophysa xiangxiensis and Triplophysa rosa) to 13.76 Ma (Troglonectes daqikongenis and Troglonectes furcocaudalis) (Serravallian to Messinian Age, Miocene Epoch).
4 DISCUSSIONPrevious research has shown that certain teleostean fish possess only one or similar arrangements of mitochondrial genes (Miya et al., 2003). We found similar gene arrangements in the mitogenomes of the three cavefish species, which are also teleostean fish. Gene arrangement and distribution without subsequent gene rearrangement is a common feature in vertebrates (Broughton et al., 2001). The genomes of all examined nemacheilid species exhibited higher AT content relative to GC, consistent with the high AT and low GC contents displayed in most vertebrates (Cheng et al., 2012; Luo et al., 2017; Kundu et al., 2018; Huang et al., 2019). However, negative AT skews were found in ND6 in the three cavefish, which are uncommon in mitochondrial genes, but have been detected in other vertebrates such as Marmota himalayana (Chao et al., 2014), Cetonurus globiceps (Shi et al., 2016), and Ophichthus brevicaudatus (Lü et al., 2019). These animals inhabit extreme environments, a feature shared by nemacheilid cavefish. The nucleotide skews may have been the result of mutational and selective pressures during DNA replication and transcription (Perna and Kocher, 1995; Wei et al., 2010a, b). Thus, the unusual composition of ND6 in the cavefish may be related to selective pressure from their extreme habitat. Nevertheless, further investigation is required to understand how nucleotide skews influence replication direction or gene orientation, and what selective pressures cause skews to arise.
The PCG Ka/Ks ratios were all < 1 (Fig. 4), suggesting that the PCGs evolved under purifying selection, during which harmful mutations with negative selection coefficients were naturally selected against (Yang and Bielawski, 2000). Under purifying selection, it is difficult for disadvantageous mutations to be established, and the long-term stability of biological structures is maintained. Thus, low Ka/Ks ratios for COXI, COXIII, and CYTB indicate strong purifying selection and evolutionary conservation in these genes. Differences in Ka/Ks ratios can indicate differences in selection pressures and evolutionary mechanisms among genes (Lynch et al., 2006). The Ka/Ks ratios for ATP8 and ND2 were highest (Fig. 4), suggesting that ATP8 and ND2 evolved at a faster rate than the other mitochondrial PCGs in the nemacheilid cavefish. More functional genes are present in the H-strand of the mitogenome; for example, ATP8 and ND2 both reside on the H-strand of the mitogenome, implying that selective pressures may have exerted stronger influence on the heavy chain than on the light chain in nemacheilid cavefish mtDNA.
Based on principal component analysis (PCA), the overall codon and amino acid usage patterns of the cavefish differed significantly from those of other fish (Fig. 5e & f), further supporting the nucleotide composition and skew results. Mitochondria are the centres of energy metabolism in eukaryotic organisms and produce more than 95% of all cellular energy via oxidative phosphorylation (Xu et al., 2007). In cave habitats, the lack of autotrophic primary producers due to constant darkness can lead to limitations in food supply (Zhao and Zhang, 2009). The differences in nucleotide compositional biases between cavefish and other nemacheilid species suggest that mtDNA may have been subjected to evolutionary selection to improve energy use efficiency in response to food limitations in cave environments; however, further investigations are required for this to be confirmed.
To explore the evolutionary history between cavefish and their surface-dwelling relatives, we constructed a phylogenetic tree based on the mitogenome PCGs of 61 nemacheilid species, including three species of stygobionts and five species of stygophiles, with Leptobotia pellegrini as the outgroup (Fig. 6). Both maximum-likelihood (ML) and Bayesian inference (BI) approaches produced trees with similar topologies and branch lengths, indicating a well-resolved and highly supported phylogeny of Nemacheilidae. The data revealed that Heminoemacheilus longibarbatus and Micronemacheilus cruciatus clustered into one separate group, while Paranemachilus jinxiensis grouped with Paranemachilus pingguoensis. This corroborates the findings of Du et al. (2021) that Paranemachilus jinxiensis (formerly Yunnanilus jinxiensis) belongs to the genus Paranemachilus. Our results also support Troglonectes furcocaudalis and Troglonectes daqikongensis (formerly Oreonectes furcocaudalis and Oreonectes daqikongensis, respectively) as species of Troglonectes (Huang et al., 2020). Convergent evolution is a common phenomenon in extreme cave environments, and the present study challenges the results of previous morphological phylogenetic analyses (Wilkens and Strecker, 2003; Protas et al., 2006; Trontelj, 2019). Therefore, comprehensive taxonomic revisions of these species, using both morphological and genomic data, are needed.
The separation of cave and non-cave species (24.83 Ma–24.65 Ma–20.93 Ma–6.40 Ma) occurred concurrently with the early stages of the Miocene uplift of the southern Qinghai-Tibet Plateau (QTP), which was characterized by intensive intraplate tectonism, magmatism, and metallogeny (Li, 2010). Differentiation among cavefish occurred during the late stage of the Miocene uplift (13.76 Ma 9.08 Ma– 7.71 Ma), by which time the tectonism and magmatism that had defined the earlier stages were less prominent (Li, 2010). These splitting events coincided with the intraplate orogeny of the southern QTP, which mainly occurred 25 Ma 7 Ma (Li, 2010). Throughout the Miocene uplift of the southern QTP, large-scale karst development occurred in the limestone regions (Shi et al., 1999). Uplift of the QTP significantly affected both the climate and habitat of the area (An et al., 2001; Xiao et al., 2005; Zhao and Zhang, 2009). Thus, the isolation of cave habitats, along with the unique environmental effects of the QTP uplift process, are considered key reasons for cavefish speciation (Zhao and Zhang, 2009; Yang et al., 2016). Our results provide further evidence that the speciation and diversification of nemacheilid cavefish are correlated with uplift of the QTP.
5 CONCLUSIONThe complete mitogenomes of three cavefish (Order Cypriniformes, Family Nemacheilidae) were sequenced, annotated, and characterized. The mitogenome contained 37 genes (13 PCGs, 22 transfer RNAs (tRNAs), and two ribosomal RNAs (rRNAs)) and a single control region. The Ka/Ks ratios indicate that the PCGs of the three cavefish evolved under purifying selection. The low Ka/Ks ratios for COXI, COXIII, and CYTB indicate strong purifying selection and evolutionary conservation in these genes, whereas the high Ka/Ks ratios for ATP8 and ND2 indicate that these genes evolved at a faster rate than the other mitochondrial PCGs in nemacheilid cavefish. PCA revealed that the mitogenomes of the three nemacheilids exhibited nucleotide biases within the PCGs, tRNAs, rRNAs, and full genomes. These results imply that the mtDNA underwent evolutionary selection to improve energy use efficiency in response to food limitations in cave environments. Divergence time and evolutionary history analyses indicated that speciation and diversification of the cavefish coincided with the Miocene uplift of the southern QTP, when the cave habitats were undergoing significant change. This study has helped to elucidate the mitogenomes and phylogeny of fish in Nemacheilidae and provided insights into the evolutionary history of cavefish.
6 DATA AVAILABILITY STATEMENTThe complete mitochondrial DNA sequences were deposited in GenBank under accession numbers MW043720 (P. pingguoensis), MW043721 (H. longibarbatus), and MW043722 (O. polystigmus). The datasets generated during and/or analyzed during the current study are available from the corresponding author on reasonable request.
7 ACKNOWLEDGMENTWe are very grateful to Jiahu LAN from Du'an Fishery Technique Popularization Station for specimen collection and photographing on the three species.
An Z S, Kutzbach J E, Prell W L, Porter S C. 2001. Evolution of Asian monsoons and phased uplift of the Himalaya-Tibetan plateau since Late Miocene times. Nature, 411(6833): 62-66.
DOI:10.1038/35075035 |
Avise J C, Neigel J E, Arnold J. 1984. Demographic influences on mitochondrial DNA lineage survivorship in animal populations. Journal of Molecular Evolution, 20(2): 99-105.
DOI:10.1007/BF02257369 |
Boore J L. 1999. Animal mitochondrial genomes. Nucleic Acids Research, 27(8): 1767-1780.
DOI:10.1093/nar/27.8.1767 |
Broughton R E, Milam J E, Roe B A. 2001. The complete sequence of the zebrafish (Danio rerio) mitochondrial genome and evolutionary patterns in vertebrate mitochondrial DNA. Genome Research, 11(11): 1958-1967.
DOI:10.1101/gr.156801 |
Chao Q J, Li Y D, Geng X X, Zhang L, Dai X, Zhang X, Li J, Zhang H J. 2014. Complete mitochondrial genome sequence of Marmota himalayana (Rodentia: Sciuridae) and phylogenetic analysis within Rodentia. Genetics and Molecular Research, 13(2): 2739-2751.
DOI:10.4238/2014.April.14.3 |
Charif D, Lobry J R. 2007. SeqinR 1.0-2: a contributed package to the r project for statistical computing devoted to biological sequences retrieval and analysis. In: Bastolla U, Porto M, Roman H E, Vendruscolo M eds. Structural Approaches to Sequence Evolution: Molecules, Networks, Populations. Springer, Berlin, Heidelberg. p. 207-232, https://doi.org/10.1007/978-3-540-35306-5_10.
|
Cheng J, Ma G Q, Song N, Gao T X. 2012. Complete mitochondrial genome sequence of bighead croaker Collichthys niveatus (Perciformes, Sciaenidae): a mitogenomic perspective on the phylogenetic relationships of Pseudosciaeniae. Gene, 491(2): 210-223.
DOI:10.1016/j.gene.2011.09.020 |
Deharveng L, Stoch F, Gibert J, Bedos A, Galassi D, Zagmajster M, Brancelj A, Camacho A, Fiers F, Martin P, Giani N, Magniez G, Marmonier P. 2009. Groundwater biodiversity in Europe. Freshwater Biology, 54(4): 709-726.
DOI:10.1111/j.1365-2427.2008.01972.x |
Dierckxsens N, Mardulyn P, Smits G. 2017. NOVOPlasty: de novo assembly of organelle genomes from whole genome data. Nucleic Acids Research, 45(4): e18.
DOI:10.1093/nar/gkw955 |
Du L N, Yang J, Min R, Chen X Y, Yang J X. 2021. A review of the Cypriniform tribe Yunnanilini Prokofiev, 2010 from China, with an emphasis on five genera based on morphologies and complete mitochondrial genomes of some species. Zoological Research, 42(3): 310-334.
DOI:10.24272/j.issn.2095-8137.2020.229 |
Edgar R C. 2004. MUSCLE: multiple sequence alignment with high accuracy and high throughput. Nucleic Acids Research, 32(5): 1792-1797.
DOI:10.1093/nar/gkh340 |
Huang J Q, Yang J, Wu Z Q, Zhao Y H. 2020. Oreonectes guilinensis (Teleostei, Cypriniformes, Nemacheilidae), a new loach species from Guangxi, China. Journal of Fish Biology, 96(1): 111-119.
DOI:10.1111/jfb.14191 |
Huang Q H, Cai Y L, Xing X S. 2008. Rocky desertification, antidesertification, and sustainable development in the karst mountain region of Southwest China. AMBIO: A Journal of the Human Environment, 37(5): 390-392.
DOI:10.1579/08-S-493.1 |
Huang W, Shi G F, He A Y, Wen Y H, Huang J, Luo F G. 2019. Characterization of complete mitochondrial genome of Yunnanilus jinxiensis (Cypriniformes, Balitoridae, Nemacheilidae). Mitochondrial DNA Part B, 4(1): 185-186.
DOI:10.1080/23802359.2018.1545543 |
Iwasaki W, Fukunaga T, Isagozawa R, Yamada K, Maeda Y, Satoh T P, Sado T, Mabuchi K, Takeshima H, Miya M, Nishida M. 2013. MitoFish and MitoAnnotator: a mitochondrial genome database of fish with an accurate and automatic annotation pipeline. Molecular Biology and Evolution, 30(11): 2531-2540.
DOI:10.1093/molbev/mst141 |
Kumar S, Stecher G, Li M, Knyaz C, Tamura K. 2018. MEGA X: molecular evolutionary genetics analysis across computing platforms. Molecular Biology and Evolution, 35(6): 1547-1549.
DOI:10.1093/molbev/msy096 |
Kumar S, Stecher G, Suleski M, Hedges S B. 2017. TimeTree: a resource for timelines, timetrees, and divergence times. Molecular Biology and Evolution, 34(7): 1812-1819.
DOI:10.1093/molbev/msx116 |
Kundu S, Kumar V, Tyagi K, Chakraborty R, Singha D, Rahaman I, Pakrashi A, Chandra K. 2018. Complete mitochondrial genome of Black Soft-shell Turtle (Nilssonia nigricans) and comparative analysis with other Trionychidae. Scientific Reports, 8(1): 17378.
DOI:10.1038/s41598-018-35822-5 |
Lan J H, Gan X, Wu T J, Yang J. 2013. Cave Fishes of Guangxi, China. Science Press, Beijing.
(in Chinese)
|
Li D W. 2010. Temporal‐spatial structure of intraplate uplift in the Qinghai‐Tibet Plateau. Acta Geologica Sinica (English Edition), 84(1): 105-134.
DOI:10.1111/j.1755-6724.2010.00174.x |
Liu Q N, Xin Z Z, Zhu X Y, Chai X Y, Zhao X M, Zhou C L, Tang B P. 2017. A transfer RNA gene rearrangement in the lepidopteran mitochondrial genome. Biochemical and Biophysical Research Communications, 489(2): 149-154.
DOI:10.1016/j.bbrc.2017.05.115 |
Lü Z M, Zhu K H, Jiang H, Lu X T, Liu B J, Ye Y Y, Jiang L H, Liu L Q, Gong L. 2019. Complete mitochondrial genome of Ophichthus brevicaudatus reveals novel gene order and phylogenetic relationships of Anguilliformes. International Journal of Biological Macromolecules, 135: 609-618.
DOI:10.1016/j.ijbiomac.2019.05.139 |
Luo F G, Huang J, Liu J L, Situ L, Liu X, Wen Y H. 2017. Characterization of complete mitochondrial genome of Oreonectes furcocaudalis (Cypriniformes, Balitoridae, Nemacheilidae). Mitochondrial DNA Part B, 2(1): 69-70.
DOI:10.1080/23802359.2017.1280697 |
Luo Z H, Tang S H, Jiang Z G, Chen J, Fang H X, Li C W. 2016. Conservation of terrestrial vertebrates in a global hotspot of karst area in southwestern China. Scientific Reports, 6(1): 25717.
DOI:10.1038/srep25717 |
Lynch M, Koskella B, Schaack S. 2006. Mutation pressure and the evolution of organelle genomic architecture. Science, 311(5768): 1727-1730.
DOI:10.1126/science.1118884 |
Ma L, Zhao Y H, Yang J X. 2019. Cavefish of China. In: White W B, Culver D C, Pipan T eds. Encyclopedia of Caves. 3rd edn. Elsevier, Amsterdam. p. 237-254, https://doi.org/10.1016/B978-0-12-814124-3.00027-3.
|
Miya M, Takeshima H, Endo H, Ishiguro N B, Inoue J G, Mukai T, Satoh T P, Yamaguchi M, Kawaguchi A, Mabuchi K, Shirai S M, Nishida M. 2003. Major patterns of higher teleostean phylogenies: a new perspective based on 100 complete mitochondrial DNA sequences. Molecular Phylogenetics and Evolution, 26(1): 121-138.
DOI:10.1016/S1055-7903(02)00332-9 |
Niemiller M L, Bichuette M E, Chakrabarty P, Fenolio D B, Gluesenkamp A G, Soares D, Zhao Y H. 2019. Cavefishes. In: White W B, Culver D C, Pipan T eds. Encyclopedia of Caves. 3rd edn. Elsevier, Amsterdam. p. 227-236, https://doi.org/10.1016/B978-0-12-814124-3.00026-1.
|
Palandačić A, Bonacci O, Snoj A. 2012. Molecular data as a possible tool for tracing groundwater flow in karst environment: example of Delminichthys adspersus in Dinaric karst system. Ecohydrology, 5(6): 791-797.
DOI:10.1002/eco.269 |
Perna N T, Kocher T D. 1995. Patterns of nucleotide composition at fourfold degenerate sites of animal mitochondrial genomes. Journal of Molecular Evolution, 41(3): 353-358.
DOI:10.1007/BF01215182 |
Posada D. 2008. jModelTest: phylogenetic model averaging. Molecular Biology and Evolution, 25(7): 1253-1256.
DOI:10.1093/molbev/msn083 |
Protas M E, Hersey C, Kochanek D, Zhou Y, Wilkens H, Jeffery W R, Zon L I, Borowsky R, Tabin C J. 2006. Genetic analysis of cavefish reveals molecular convergence in the evolution of albinism. Nature Genetics, 38(1): 107-111.
DOI:10.1038/ng1700 |
Riddle M R, Aspiras A C, Gaudenz K, Peuß R, Sung J Y, Martineau B, Peavey M, Box A C, Tabin J A, McGaugh S, Borowsky R, Tabin C J, Rohner N. 2018. Insulin resistance in cavefish as an adaptation to a nutrient-limited environment. Nature, 555(7698): 647-651.
DOI:10.1038/nature26136 |
Ronquist F, Teslenko M, Van Der Mark P, Ayres D L, Darling A, Höhna S, Larget B, Liu L, Suchard M A, Huelsenbeck J P. 2012. MrBayes 3.2: efficient Bayesian phylogenetic inference and model choice across a large model space. Systematic Biology, 61(3): 539-542.
DOI:10.1093/sysbio/sys029 |
Satoh T P, Miya M, Mabuchi K, Nishida M. 2016. Structure and variation of the mitochondrial genome of fishes. BMC Genomics, 17(1): 719.
DOI:10.1186/s12864-016-3054-y |
Sharp P M, Li W H. 1987. The codon adaptation index-a measure of directional synonymous codon usage bias, and its potential applications. Nucleic Acids Research, 15(3): 1281-1295.
DOI:10.1093/nar/15.3.1281 |
Shi X F, Tian P, Lin R C, Huang D Y, Wang J J. 2016. Characterization of the complete mitochondrial genome sequence of the globose head whiptail Cetonurus globiceps (Gadiformes: Macrouridae) and its phylogenetic analysis. PLoS One, 11(4): e0153666.
DOI:10.1371/journal.pone.0153666 |
Shi Y F, Li J J, Li B Y, Yao T D, Wang S M, Li S J, Cui Z J, Wang F B, Pan B T, Fang X M, Zhang Q S. 1999. Uplift of the Qinghai-Xizang (Tibetan) plateau and East Asia environmental change during late Cenozoic. Acta Geographica Sinica, 54(1): 10-21.
DOI:10.3321/j.issn:0375-5444.1999.01.002.(inChinesewithEnglishabstract) |
Shu S S, Jiang W S, Whitten T, Yang J X, Chen X Y. 2013. Drought and China's cave species. Science, 340(6130): 272.
DOI:10.1126/science.340.6130.272-a |
Stamatakis A. 2014. RAxML version 8: a tool for phylogenetic analysis and post-analysis of large phylogenies. Bioinformatics, 30(9): 1312-1313.
DOI:10.1093/bioinformatics/btu033 |
Tomasco I H, Lessa E P. 2011. The evolution of mitochondrial genomes in subterranean caviomorph rodents: adaptation against a background of purifying selection. Molecular Phylogenetics and Evolution, 61(1): 64-70.
DOI:10.1016/j.ympev.2011.06.014 |
Trontelj P. 2019. Adaptation and natural selection in caves. In: White W B, Culver D C, Pipan T eds. Encyclopedia of Caves. 3rd edn. Elsevier, Amsterdam. p. 40-46, https://doi.org/10.1016/B978-0-12-814124-3.00006-6.
|
Wei L, He J, Jia X, Qi Q, Liang Z S, Zheng H, Ping Y, Liu S Y, Sun J C. 2014. Analysis of codon usage bias of mitochondrial genome in Bombyx mori and its relation to evolution. BMC Evolutionary Biology, 14(1): 262.
DOI:10.1186/s12862-014-0262-4 |
Wei S J, Shi M, Chen X X, Sharkey M J, van Achterberg C, Ye G Y, He J H. 2010a. New views on strand asymmetry in insect mitochondrial genomes. PLoS One, 5(9): e12708.
DOI:10.1371/journal.pone.0012708 |
Wei S J, Shi M, Sharkey M J, van Achterberg C, Chen X X. 2010b. Comparative mitogenomics of Braconidae (Insecta: Hymenoptera) and the phylogenetic utility of mitochondrial genomes with special reference to Holometabolous insects. BMC Genomics, 11(1): 371.
DOI:10.1186/1471-2164-11-371 |
Wilkens H, Strecker U. 2003. Convergent evolution of the cavefish Astyanax (Characidae, Teleostei): genetic evidence from reduced eye-size and pigmentation. Biological Journal of the Linnean Society, 80(4): 545-554.
DOI:10.1111/j.1095-8312.2003.00230.x |
Xiao H, Chen S Y, Liu Z M, Zhang R D, Li W X, Zan R G, Zhang Y P. 2005. Molecular phylogeny of Sinocyclocheilus (Cypriniformes: Cyprinidae) inferred from mitochondrial DNA sequences. Molecular Phylogenetics and Evolution, 36(1): 67-77.
DOI:10.1016/j.ympev.2004.12.007 |
Xu S Q, Luosang J B, Hua S, He J, Ciren A, Wang W, Tong X M, Liang Y, Wang J, Zheng X G. 2007. High altitude adaptation and phylogenetic analysis of Tibetan horse based on the mitochondrial genome. Journal of Genetics and Genomics, 34(8): 720-729.
DOI:10.1016/S1673-8527(07)60081-2 |
Yang J X, Chen X L, Bai J, Fang D M, Qiu Y, Jiang W S, Yuan H, Bian C, Lu J, He S Y, Pan X F, Zhang Y L, Wang X A, You X X, Wang Y S, Sun Y, Mao D Q, Liu Y, Fan G Y, Zhang H, Chen X Y, Zhang X H, Zheng L P, Wang J T, Cheng L, Chen J M, Ruan Z Q, Li J, Yu H, Peng C, Ma X Y, Xu J M, He Y, Xu Z F, Xu P, Wang J, Yang H M, Wang J, Whitten T, Xu X, Shi Q. 2016. The Sinocyclocheilus cavefish genome provides insights into cave adaptation. BMC Biology, 14(1): 1.
DOI:10.1186/s12915-015-0223-4 |
Yang Z H, Bielawski J P. 2000. Statistical methods for detecting molecular adaptation. Trends in Ecology & Evolution, 15(12): 496-503.
DOI:10.1016/S0169-5347(00)01994-7 |
Zhao Y H, Gozlan R E, Zhang C G. 2011. Out of sight out of mind: current knowledge of Chinese cave fishes. Journal of Fish Biology, 79(6): 1545-1562.
DOI:10.1111/j.1095-8649.2011.03066.x |
Zhao Y H, Zhang C G. 2009. Endemic Fishes of Sinocyclocheilus (Cypriniformes: Cyprinidae) in China—Species Diversity, Cave Adaptation, Systematics and Zoogeography. Science Press, Beijing, China.
(in Chinese)
|