Institute of Oceanology, Chinese Academy of Sciences
Article Information
- HAN Libin, LI Qiuhua, CHEN Wensheng, WANG Xing, ZHOU Shihui, HAN Mengshu, BRANCELJ Anton
- The key environmental factors driving the succession of phytoplankton functional groups in Hongfeng Reservoir, southwest China
- Journal of Oceanology and Limnology, 40(4): 1472-1484
- http://dx.doi.org/10.1007/s00343-021-1120-z
Article History
- Received Apr. 11, 2021
- accepted in principle Aug. 16, 2021
- accepted for publication Sep. 23, 2021
2 Guizhou International Science&Technology Cooperation Base-International Joint Research Centre for Aquatic Ecology, Guizhou Normal University, Guiyang 550001, China;
3 Key Laboratory for Information and Computing Science of Guizhou Province, Guizhou Normal University, Guiyang 550001, China;
4 National Institute of Biology, Vecna pot 111, Ljubljana 1000, Slovenia
Currently, water ecosystems worldwide are affected by eutrophication and water resource degradation (Ho et al., 2019). With the increasing frequency of algal blooms, a growing number of ecologists are focusing on ways to control this phenomenon (Niu et al., 2011; Nwankwegu et al., 2020; Yao et al., 2020). As the primary producer in the water ecosystem, the phytoplankton community composition and biomass variation can directly and quickly reflect changes in the water environment, which usually reveals the degree of eutrophication of the water body (Yang et al., 2016; Kozak et al., 2020). The traditional phytoplankton classification method can reflect the community structure well, but it has some limitations regarding environmental and ecological characteristics. Therefore, functional groups are used to assess water quality and are applicable to lakes and reservoirs, as well as rivers. Phytoplankton functional groups were proposed by Reynolds et al. (2002), based on similarities in the functions of phytoplankton communities in aquatic ecosystems, and supplemented and improved by Padisák et al. (2009). At present, this method is widely used to analyze the relationship between environmental variables and phytoplankton succession in reservoirs, lakes, and rivers (Katsiapi et al., 2011; Demir et al., 2014; Zhu et al., 2020).
Succession is a directional change determined by differences in the growth rate of the community, which leads to changes in the biomass of each species. Since the growth cycle of phytoplankton is short (Zhao et al., 2015), succession rate can be used to analyze the process of phytoplankton change. The succession rate can represent the gradual and abrupt changes of phytoplankton (Romanov and Kirillov, 2012), and the succession rate based on the biomass of phytoplankton functional groups can better reflect the composition of community structure and environmental ecological characteristics. In addition, the succession of phytoplankton functional groups is closely related to the growth strategy of phytoplankton (Crossetti and de M Bicudo, 2008), which can further explore the internal relationship between phytoplankton and environmental factors during the succession process (Biggs and Stevenson, 1998).
Hongfeng Reservoir is an important water supply reservoir in southwest China, used mainly for drinking water (Lv et al., 2014). Therefore, the development of the reservoir depends not only on water availability but also on water quality. Therefore, it is essential to study the water quality changes and provide theoretical support for water quality protection. Hence, the objectives of this study were as follows: 1) to study the community structure and adaptive strategies of phytoplankton; 2) to identify the key environmental factors of phytoplankton succession; and 3) to explore the main environmental factors affecting the succession rates.
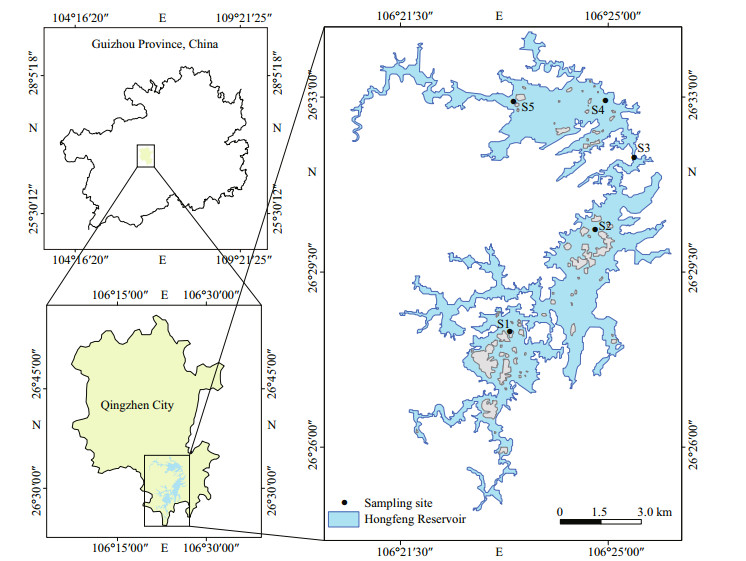
2 MATERIAL AND METHOD 2.1 Study areaHongfeng Reservoir (106°19'E–106°28'E, 26°26'N–26°35'N), located in the southwest of China, is the largest karst artificial lake in Guizhou, located upstream of the Maotiao River, the main tributary of the Wujiang River. The water storage area and capacity are 57.2 km2 and 6.01×10⁸ m3. The maximum depth of the reservoir is 45 m, the average depth is 10.52 m, and its drainage area covers 1 551 km2. For other characteristics of the reservoir refer to Li et al. (2018). It is an important drinking water source in Guiyang and plays an important role in power generation, flood control, irrigation, and tourism (Fig. 1).
|
| Fig.1 Geographical location of Hongfeng Reservoir and sampling sites |
The water and phytoplankton samples were collected monthly at five sites (S1, S2, S3, S4, and S5) in the Hongfeng Reservoir from March 2016 to December 2019 (Fig. 1). Portable multi-parameter water quality analysis tester (HANNA, HI98194, Shenzhen) was used to measure water temperature (WT), conductivity (EC), dissolved oxygen (DO), and pH in the field. Transparency (SD) was measured with Secchi disk in the field. Water samples were taken at the sites at a depth of 0.5 m beneath the water surface using a Van Dorn sampler and were collected in 1-L polyethylene bottles. The concentrations of total nitrogen (TN), total phosphorus (TP), and permanganate index (CODMn) were analyzed using unfiltered water, while filtered water was used to determine the concentration of nitrate nitrogen (NO3-N). The concentrations of chlorophyll a (Chl a) were determined by the acetone extraction method after a 500-mL water sample was filtered through a 0.45-μm cellulose acetate membrane. All water quality parameters were measured according to the Chinese National Standard Method (The State Environmental Protection Administration, 2002).
For the quantitative samples of phytoplankton, 1.5-L surface water samples were collected in polyethylene bottles and fixed with 1% Lugol's solution. After 24–48 h of sedimentation in the laboratory, the samples were concentrated to 30 mL by the siphon method and then identified under the biological microscope (Olympus CX43 Biological Microscope) according to the literature (Hu and Wei, 2006) to quantify cell densities. For the qualitative samples of phytoplankton, samples were collected from the surface water using a #25 plankton net, trawling horizontally and vertically for 1 min. Subsequently, 3%–5% formaldehyde was added to the samples for fixation. Then laboratory identification was based on literature (Hu and Wei, 2006).
2.3 Data analysisSuccession rates in plankton communities may be both tractable and informative. In particular, the importance of causal factors may be analyzed by comparing the succession rates of phytoplankton in lakes differing in environmental equability and primary productivity (Williams and Goldman, 1975). Succession rate is measured by calculating the change in the relative contribution of individual species to total biomass diversity. The fraction of total diversity attributable to a single species was calculated as:

where xia is the biomass of species i at time a, and Xa is the total biomass at time a.
The succession rates are represented as the summed difference (Kim et al., 2020), and methods of the summed difference (SD) is calculated as shown below. In this study, the time intervals varied between 13 and 47 days.

where a represents species i at time a, and b represents species i at time b. The biomass of phytoplankton was calculated using the standard geometric formula (Hillebrand et al., 1999), and the cell was equivalent to the corresponding geometric shape to calculate the biological volume of cells. Assuming that the cell density was equal to 1, the biological volume was converted to biomass. Biomass was expressed as micrograms per liter. One-way analysis of variance (ANOVA) was used to compare the differences in environmental factors and phytoplankton biomass between years and to compare the differences in succession rates among the five sites. Pearson correlation analysis was used to analyze the correlation between succession rates and environmental factors. Redundancy analysis (RDA) was used to reveal the contribution of environmental factors to variations in the biomass of representative phytoplankton functional groups each year, and Monte Carlo permutation test the values of P and F are calculated (using a test with 999 permutations) to significance test. To extract the gradients in the phytoplankton composition over time based on the Bray-Curtis distance matrix, nonmetric multidimensional scaling (NMDS) was performed based on the biomass of functional groups. The dataset of biomass and environmental factors value (except pH) were log (x+1) transformed before analysis; RDA analysis was analyzed using the CANOCO 5.0 software package, NMDS was analyzed using the R package Vegan (R version 4.0.3), and other analyses were performed using the SPSS 20.0 statistical package software. The other charts were drawn using Origin 2020.
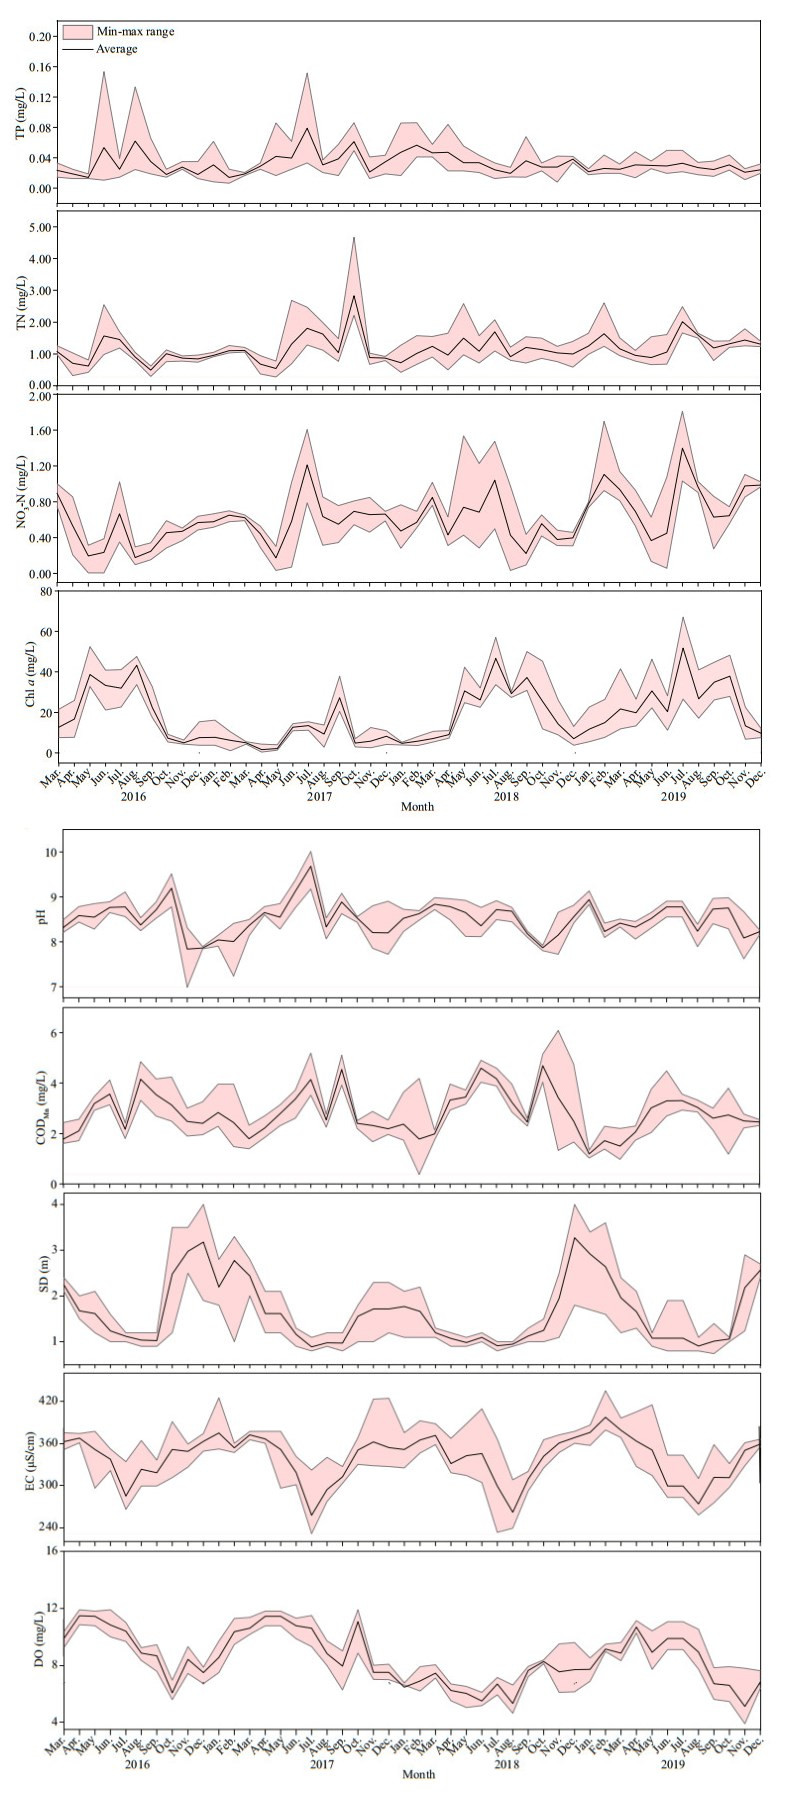
3 RESULT 3.1 Variations in environmental factorDuring the survey period (Fig. 2), the monthly concentration of TN ranged from 0.28 to 4.68 mg/L, with a maximum value in October 2017, and TN concentration differed significantly between 2016 and 2019 (n=46; P < 0.05). Monthly values of TP and CODMn ranged 0.01–0.15 mg/L and 0.38–6.09 mg/L respectively, and TP and CODMn showed significant differences between 2018 and 2019 (n=46; P < 0.05). Water temperature and pH were higher in summer, and there were both no significant differences among the years. Transparency and EC were higher in spring than in other seasons, while no significant differences were found between the years (n=46; P < 0.05). The values of NO3-N concentrations fluctuated significantly, and values in 2019 differed significantly from those of the other three years (n=46; P < 0.05). Dissolved oxygen concentrations differed significantly between 2018 and 2016 and 2017, whereas Chl-a concentrations differed between 2017 and 2019 (n=46; P < 0.05).
|
| Fig.2 Mean values and min-max ranges of total nitrogen (TN), total phosphorus (TP), nitrate nitrogen (NO3-N), electronic conductivity (EC), permanganate index (CODMn), transparency (SD), chl-a concentration (Chl a), dissolved oxygen (DO), and pH in Hongfeng Reservoir for each month from March 2016 to December 2019 |
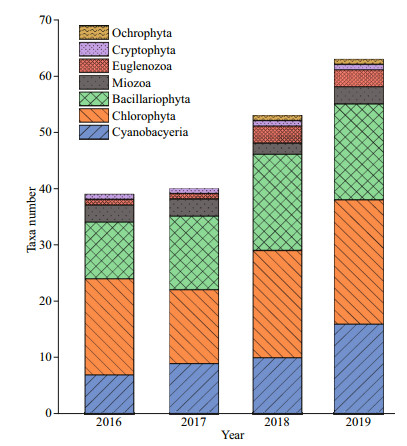
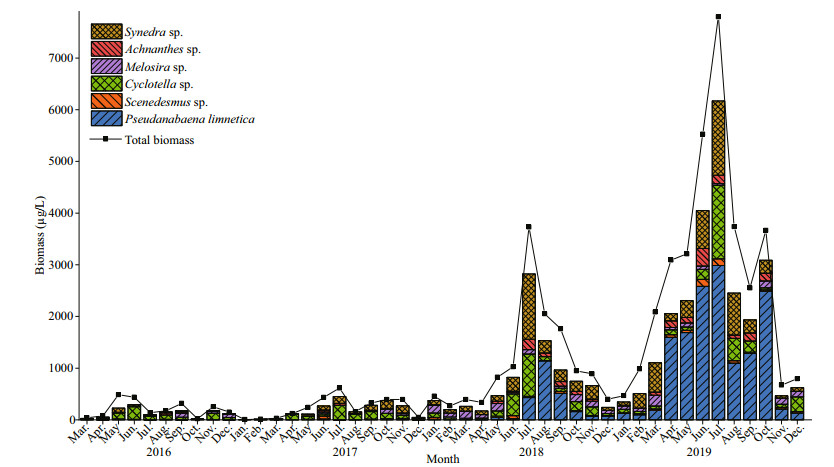
In total, about 70 phytoplankton species were identified in the study area, it varies from 39 to 40 taxa in 2016–2017 and 53–63 taxa were collected in 2018–2019, respectively. The species richness in 2019 and 2018 was greater than that in 2016 and 2017 (Fig. 3). The phytoplankton biomass through the study varied between 8.09 and 7 797.76 μg/L, with a minimum value in January 2017 and a maximum value in July 2019 (Fig. 4). The total biomass in 2019 differed significantly from those of the other three years (n=46; P < 0.05), and no significant differences were found between the other three years.
|
| Fig.3 Numbers of phytoplankton taxa in Hongfeng Reservoir from March 2016 to December 2019 |
|
| Fig.4 Monthly biomass of main species and total phytoplankton in Hongfeng Reservoir from March 2016 to December 2019 |
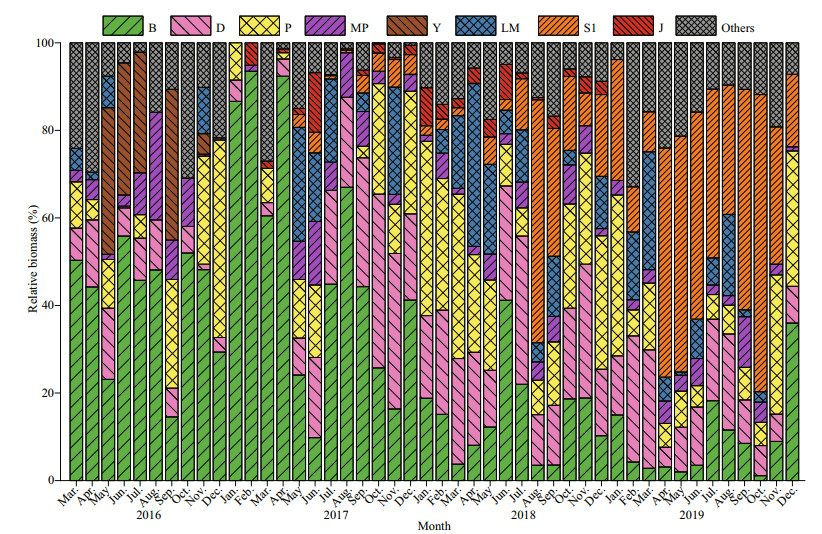
The functional groups in the reservoir were identified according to the functional group classification methods proposed by Reynolds et al. (2002) and Padisák et al. (2009). All the identified species were assigned to 26 functional groups: A, B, C, D, N, P, MP, T, TC, S1, SN, X3, X2, X1, E, Y, F, G, J, K, H1, Lo, LM, M, W1, and W2 (Table 1). Functional groups with relative biomass greater than 5% were defined as the dominant functional groups. Eight groups were defined as dominant groups: B, D, P, MP, S1, Y, J, and LM (marked with "#" in Table 1). During the study period, group B showed absolute dominance in 2016 and 2017, while its dominance was gradually replaced by group S1 in 2019. Group P was abundant in 2018, with a maximum proportion of 39.82% (Fig. 5).

|
|
| Fig.5 Monthly relative biomass of the dominant functional groups of phytoplankton in Hongfeng Reservoir from March 2016 to December 2019 |
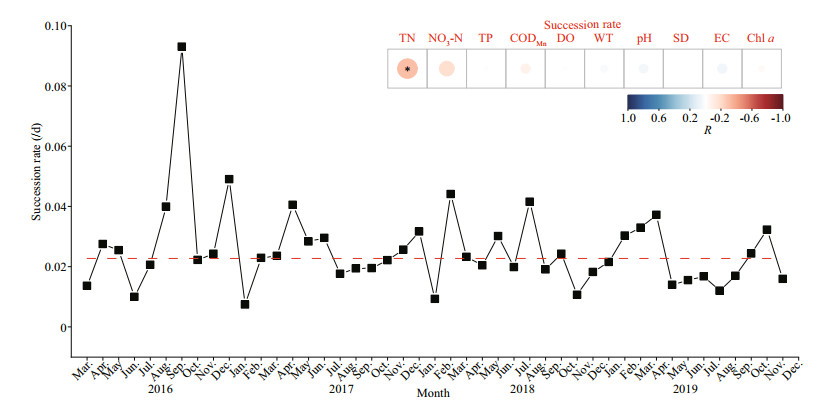
According to the results of ANOVA, there were no significant differences between the five sites (n=46; P < 0.05). Thus, in this study, the average succession rates of the five sites were used to reflect the dynamic changes in the phytoplankton community. Differences in succession rates are undoubtedly related to differences in phytoplankton growth potential (Lewis, 1978). In this study, the change in succession rates was relatively small, and the rates showed obvious seasonal changes. Succession rates increased in the summer (Fig. 6). Moreover, as can be seen from the results of Pearson correlation analysis, succession rates were significantly correlated with TN (P < 0.05; R=-0.315).
|
| Fig.6 Monthly succession rates of functional groups from 2016 to 2019 The red line represented the average value of succession rates. The embedded graph was the relationship between environmental factors and succession rates. *: significantly correlated at P < 0.05. |
The phytoplankton functional group detrended correspondence analysis (DCA) eigenvalue in this study was below 3. Therefore, redundancy analysis linear model (RDA) was applied to analyze the variation between the phytoplankton functional groups and environmental factors. Figure 7 shows the results of the RDA analysis based on the dominant functional groups and environmental factors. In 2016, axis 1 and axis 2 explained 48.17% and 27.92% of the total variation, respectively, and in 2017, the first axis explained 52.84% of the total variation, and the second axis explained 16.65%. Axis 1 and axis 2 explained 52.96% and 14.05% of the total variation, respectively, in 2018. In 2019, the percentage explained variance of axis 1 and axis 2 was 58.93% and 16.46%, respectively. The results showed that axes 1 and 2 could explain the distribution of the major phytoplankton groups.

|
| Fig.7 Results of redundancy analysis (RDA) based on the biomass of functional groups and environmental factors a. 2016; b. 2017; c. 2018; d. 2019. |
According to the Monte Carlo permutation test, WT was the most important environmental factor affecting phytoplankton functional groups during the entire study period (P < 0.05). Key environmental impact factors differed among years and the relationship between environmental factors and functional groups also altered. In 2016, WT was positively correlated with group MP, while DO showed a significant correlation with groups Y and B. WT was the most important environmental factor affecting groups B and MP in 2017. In 2018, WT was positively associated with group LM, while CODMn was positively associated with groups D, MP, and B. In 2019, CODMn and WT were positively associated with groups P and S1.
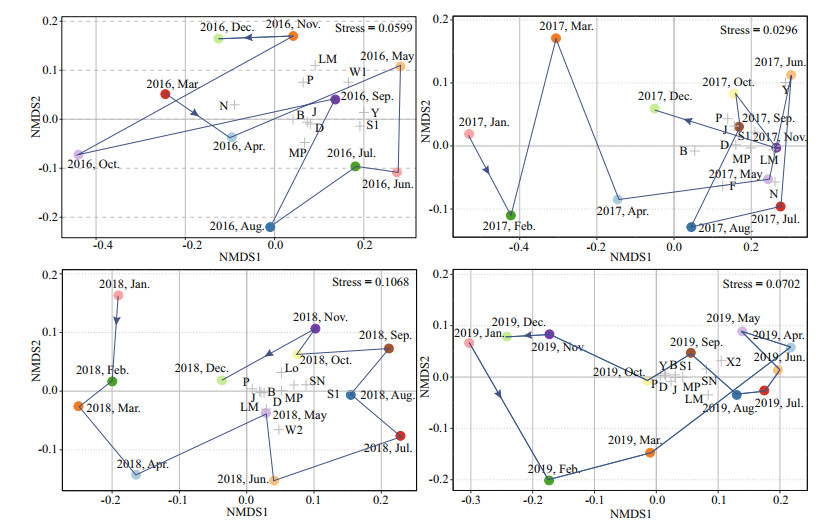
3.5 The nonmetric multidimensional scaling ordinationThe NMDS results are shown in Fig. 8, where the stress values of the NMDS were between 0.02 and 0.11. The points corresponding to chronologically contiguous samples were united by lines to highlight the development over time. In 2018 and 2019, the periodicity of seasonal phytoplankton development was particularly obvious, while in 2016 and 2017, the regularity of time was complex. In 2018 and 2019, the gradient in the composition of the functional groups was strongly separated along the axis of the NMDS configurations, while the samples from 2016 and 2017 showed a disorganized time sequence. Larger distances on functional groups were found in 2016 and 2017, which showed clear differences between months. However, the close similarity of functional groups was observed between 2018 and 2019 due to the predominance of Pseudanabaena limnetica.
|
| Fig.8 Results of nonmetric multidimensional scaling ordination (NMDS) based on the biomass of functional groups among years |
From 2016 to 2019, the total biomass showed an increasing trend, and the maximum biomass of phytoplankton was 487.23, 615.04, 3 729.32, and 7 797.76 μg/L in 2016, 2017, 2018, and 2019, respectively. The significant biomass increased of P. limnetica led to the annual increase of the total biomass in Hongfeng Reservoir. During the study period, the biomass in summer was significantly higher than in the other seasons because, in summer, the temperatures were higher, and solar radiation caused the surface water temperature to increase. Water temperature is an important direct environmental factor affecting phytoplankton growth and succession (Jiang et al., 2014). An increase in water temperature can enhance the photosynthetic rates of phytoplankton and cause an increase in biomass.
Overall, Bacillariophyta, Cyanobacteria, and Chlorophyta were the main phyla in Hongfeng Reservoir, which is consistent with previous studies (Li et al., 2014). The Cyanobacteria were dominated by P. limnetica (S1), the Chlorophyta by Scenedesmus sp. (J), and the Bacillariophyta by Synedra sp. (D), Cyclotella sp. (B), Melosira sp. (P), and Achnanthes sp. (MP). The growth of these species varied over time in Hongfeng Reservoir, and this was related to the growth strategy of the phytoplankton and the reservoir's water quality. For example, diatoms are high-growth species adapted to a nutrient-rich environment (Salmaso, 1996). In 2016 and 2017, the total phosphorus concentrations changed significantly; therefore, Cyclotella sp. was at an advantage. P. limnetica belongs to the R adaptive strategy and is an aggressive, opportunistic species, and its competitive ability is superior to that of other species (Reynolds, 1998). Therefore, the biomass of P. limnetica continued to rise after 2018, although the fierce nutrient competition between species.
It was clear that the same water body had different dominant species at different times; that is, each period had a specific ecosystem. It is well known that the phytoplankton community structure and composition are greatly affected by environmental factors. Indeed, phytoplankton are quite sensitive to minute disturbances in the environment and are thus a useful indicator of water quality changes (Rangel et al., 2016). From the analysis results, it can be concluded that the changes in phytoplankton functional groups were related to the changes in environmental factors, and the key influencing factors changed with the change in dominant functional groups over time. Many studies have shown that small changes in nutrient concentrations, such as TN and TP, can cause significant spatial changes in the phytoplankton community (Cao et al., 2018). This was consistent with the results of the research in Hongfeng Reservoir, a significant difference in the TN and TP concentration caused obvious variation in phytoplankton community structure. In addition, the total biomass of phytoplankton also increased significantly, firstly the pH value of water in Hongfeng Reservoir was above 8.0, and the adaptability of Cyanobacteria to high pH values was conducive to the growth of P. limnetica, leading to an annual increase in total biomass. Secondly, the obvious fluctuation of NO3-N concentration in 2019 was conducive to the growth of Synedra sp. and Melosira sp., which were the species with strong nutrient absorption capacity. In addition, the concentration of DO in Hongfeng Reservoir was relatively high in summer, probably because Hongfeng Reservoir is located on the karst plateau in southwest China and the air quality is good. The DO in the water is continuously supplemented by oxygen in the air and the vigorous photosynthetic activity of green aquatic plants in summer.
4.2 The relationship between phytoplankton functional groups and the concentration of CODMnThe RDA results indicating annual differences in environmental factors between quadrants explained that the redundancy of environmental factors differed among years, and the relationship between environmental factors and functional groups also fluctuated annually. In 2018, CODMn became an important factor affecting the functional groups. In addition, the dominant functional groups changed significantly. The functional group S1 gradually occupied the dominant position in 2018 and became the dominant group in 2019, while the dominant position of functional group B was gradually replaced. The RDA results showed that CODMn was highly correlated with functional group B in 2018 and significantly correlated with functional group S1 in 2019. This pattern indicated that 2018 was a transitional period in the succession, and there was a closer relationship between the concentration of CODMn and functional groups succession. The CODMn in reservoir water mainly comes from exogenous inputs, such as rivers, sewage discharge, and biological metabolism and decomposition (Yao et al., 2011). Hongfeng Reservoir is located in a densely populated agricultural production area. Pesticides, fertilizers, and other organic or inorganic pollutants in agricultural production activities enter the water body through artificial or natural ways, which causes organic pollution in the water body of the reservoir. The results of Pearson correlation analysis showed that the concentration of CODMn in Hongfeng Reservoir had a significant positive correlation with Chl a (R=0.505; P < 0.05), and a significant negative correlation with SD (R=-0.505; P < 0.05). Many studies have shown that degradation of cyanobacteria and chlorophyll would cause an increase in organics, which resulted in a change of CODMn in the water (Tang et al., 2007). Moreover, the increased biomass of phytoplankton in Hongfeng Reservoir also led to a decrease of the SD and increase in chl a. The synchronization between succession and CODMn indicated that CODMn must be a key factor in change period, but the interrelation between the succession of functional groups and CODMn needs to be further explored.
In addition, the monthly distribution of the dominant functional groups over the years was tested by NMDS analysis based on the biomass of phytoplankton (Fig. 8). The analysis results indicated that the monthly distance and succession of the functional groups of Hongfeng Reservoir differed from year to year. The monthly succession of 2016 and 2017 was disorganized, and the distribution of functional groups was scattered. The monthly succession trajectories of 2018 and 2019 could be clearly distinguished along axis 1, and the distribution distance of the functional groups was close. The NMDS analysis results showed two different periods as well, which were consistent with the above analysis results, indicating that Hongfeng Reservoir had an obvious succession of functional groups in 2018. Moreover, it can be concluded from the NMDS results that the distance between functional group B and other functional groups in the previous period was large, indicating that competition between the functional groups was small; hence, group B maintained a dominant position. However, the distance was reduced in the later period, and the biomass increased, so group S1, which had strong competitive ability, began to occupy the dominant position.
4.3 Succession rates indicating the gradual effect of environmental factors in phytoplankton successionComparing the succession rates in the same water body in different years can be used as the basis for evaluating the characteristics of phytoplankton succession (Romanov and Kirillov, 2012). Using succession rates to analyze the composition of phytoplankton functional groups can distinguish the time of significant change in a reservoir. In Hongfeng Reservoir, biomass-based succession rates varied from 0.007 to 0.093/d, and high succession rates occurred in the months with high functional group diversity. Additionally, high biomass of phytoplankton does not necessarily lead to high succession rates (de S Cardoso and da Motta Marques, 2003). From the analysis results, the variation of succession rates in Hongfeng Reservoir were significantly affected by the concentration of TN, which is an essential nutrient for long-term growth and succession of phytoplankton. Therefore, the long-term succession of functional groups is significantly related to nutrient concentration, indicating that it is necessary to control nutrient concentration in reservoir management. In addition, the sequence of changes in phytoplankton structure and abundance observed at stable sampling sites in the reservoir may not be "true succession". Instead, these effects may be the overlap of several processes, such as the residence time of water flow, the resuscitation of phytoplankton in sediments, and the seasonal succession of phytoplankton. Therefore, the long-term succession of phytoplankton species in reservoirs might depend upon factors not entirely understood and the effect of chance cannot be ignored.
5 CONCLUSIONThe major succession processes of phytoplankton functional groups in Hongfeng Reservoir changed from B/D/P/Y to S1/D/P, with a significant increase in the total biomass. This study showed that, in a eutrophic reservoir, nutrients and water temperatures are prominent drivers for shaping the phytoplankton community structure. The phytoplankton functional groups combined with the growth strategy of phytoplankton, provide a detailed description of phytoplankton community behavior and ecosystem functioning. The phytoplankton functional groups changed rapidly in 2018 were significantly related with the concentration of CODMn, and the gradual change in succession rates was significantly related to the concentration of TN. We suggested that a sudden and gradual increase of energy resources in reservoirs and the increase in biomass could induce the dominance of enriched competitive species and result in phytoplankton succession as seen in this study.
6 DATA AVAILABILITY STATEMENTThe data for this study are available through the corresponding author.
7 ACKNOWLEDGMENTWe appreciate our colleagues for assisting with fieldwork and laboratory experiments.
Biggs B J F, Stevenson R J, Lowe R L. 1998. A habitat matrix conceptual model for stream periphyton. Archiv für Hydrobiologie, 143(1): 21-56.
DOI:10.1127/archiv-hydrobiol/143/1998/21 |
Cao J, Hou Z Y, Li Z K, Chu Z S, Yang P P, Zheng B H. 2018. Succession of phytoplankton functional groups and their driving factors in a subtropical plateau lake. Science of the Total Environment, 631–632: 1127-1137.
|
Crossetti L O, de M Bicudo C E. 2008. Adaptations in phytoplankton life strategies to imposed change in a shallow urban tropical eutrophic reservoir, Garças Reservoir, over 8 years. Hydrobiologia, 614(1): 91-105.
DOI:10.1007/s10750-008-9539-1 |
de S Cardoso L, da Motta Marques D. 2003. Rate of change of the phytoplankton community in Itapeva Lake (north coast of Rio Grande do Sul, Brazil), based on the wind driven hydrodynamic regime. Hydrobiologia, 497(1–3): 1-12.
|
Demir A N, Fakioğlu Ö, Dural B. 2014. Phytoplankton functional groups provide a quality assessment method by the Q assemblage index in Lake Mogan (Turkey). Turkish Journal of Botany, 38(1): 169-179.
|
Hillebrand H, Dürselen C D, Kirschtel D, Pollingher U, Zohary T. 1999. Biovolume calculation for pelagic and benthic microalgae. Journal of Phycology, 35(2): 403-424.
DOI:10.1046/j.1529-8817.1999.3520403.x |
Ho J C, Michalak A M, Pahlevan N. 2019. Widespread global increase in intense lake phytoplankton blooms since the 1980s. Nature, 574(7780): 667-670.
DOI:10.1038/s41586-019-1648-7 |
Hu H J, Wei Y X. 2006. The Freshwater Algae of China: Systematics, Taxonomy and Ecology. Science Press, Beijing, China.
(in Chinese)
|
Jiang Z B, Liu J J, Chen J F, Chen Q Z, Yan X J, Xuan J L, Zeng J N. 2014. Responses of summer phytoplankton community to drastic environmental changes in the Changjiang (Yangtze River) estuary during the past 50 years. Water Research, 54: 1-11.
DOI:10.1016/j.watres.2014.01.032 |
Katsiapi M, Moustaka-Gouni M, Michaloudi E, Kormas K A. 2011. Phytoplankton and water quality in a mediterranean drinking-water reservoir (Marathonas Reservoir, Greece). Environmental Monitoring and Assessment, 181(1–4): 563-575.
|
Kim H G, Hong S, Kim D K, Joo G J. 2020. Drivers shaping episodic and gradual changes in phytoplankton community succession: taxonomic versus functional groups. Science of the Total Environment, 734: 138940.
DOI:10.1016/j.scitotenv.2020.138940 |
Kozak A, Budzyńska A, Dondajewska-Pielka R, Kowalczewska-Madura K, Gołdyn R. 2020. Functional groups of phytoplankton and their relationship with environmental factors in the restored Uzarzewskie Lake. Water, 12(2): 313.
DOI:10.3390/w12020313 |
Lewis Jr W M. 1978. Analysis of succession in a tropical phytoplankton community and a new measure of succession rate. The American Naturalist, 112(984): 401-414.
DOI:10.1086/283282 |
Li Q H, Shang L H, Gao T J, Zhang L, Ou T, Huang G J, Chen C, Li C X. 2014. Use of principal component scores in multiple linear regression models for simulation of chlorophyll-a and phytoplankton abundance at a karst deep reservoir, southwest of China. Acta Ecologica Sinica, 34(1): 72-78.
DOI:10.1016/j.chnaes.2013.11.009 |
Li Q H, Xiao J, Ou T, Han M S, Wang J F, Chen J G, Li Y L, Salmaso N. 2018. Impact of water level fluctuations on the development of phytoplankton in a large subtropical reservoir: implications for the management of cyanobacteria. Environmental Science and Pollution Research, 25(2): 1306-1318.
DOI:10.1007/s11356-017-0502-4 |
Lv H, Yang J, Liu L M, Yu X Q, Yu Z, Chiang P. 2014. Temperature and nutrients are significant drivers of seasonal shift in phytoplankton community from a drinking water reservoir, subtropical China. Environmental Science and Pollution Research, 21(9): 5917-5928.
DOI:10.1007/s11356-014-2534-3 |
Niu Y, Shen H, Chen J, Xie P, Yang X, Tao M, Ma Z M, Qi M. 2011. Phytoplankton community succession shaping bacterioplankton community composition in Lake Taihu, China. Water Research, 45(14): 4169-4182.
DOI:10.1016/j.watres.2011.05.022 |
Nwankwegu A S, Li Y P, Huang Y N, Wei J, Norgbey E, Ji D B, Pu Y S, Nuamah L A, Yang Z J, Jiang Y F, Paerl H W. 2020. Nitrate repletion during spring bloom intensifies phytoplankton iron demand in Yangtze River tributary, China. Environmental Pollution, 264: 114626.
DOI:10.1016/j.envpol.2020.114626 |
Padisák J, Crossetti L O, Naselli-Flores L. 2009. Use and misuse in the application of the phytoplankton functional classification: a critical review with updates. Hydrobiologia, 621(1): 1-19.
DOI:10.1007/s10750-008-9645-0 |
Rangel L M, Soares M C S, Paiva R, Silva L H S. 2016. Morphology-based functional groups as effective indicators of phytoplankton dynamics in a tropical cyanobacteria-dominated transitional river-reservoir system. Ecological Indicators, 64: 217-227.
DOI:10.1016/j.ecolind.2015.12.041 |
Reynolds C S, Huszar V, Kruk C, Naselli-Flores L, Melo S. 2002. Towards a functional classification of the freshwater phytoplankton. Journal of Plankton Research, 24(5): 417-428.
DOI:10.1093/plankt/24.5.417 |
Reynolds C S. 1998. What factors influence the species composition of phytoplankton in lakes of different trophic status?. Hydrobiologia, 369: 11-26.
|
Romanov R E, Kirillov V V. 2012. Analysis of the seasonal dynamics of river phytoplankton based on succession rate indices for key event identification. Hydrobiologia, 695(1): 293-304.
DOI:10.1007/s10750-012-1198-6 |
Salmaso N. 1996. Seasonal variation in the composition and rate of change of the phytoplankton community in a deep subalpine lake (Lake Garda, northern Italy). An application of nonmetric multidimensional scaling and cluster analysis. Hydrobiologia, 337(1–3): 49-68.
|
Tang J W, Zhuang M Q, Xing X L, Zhang X H, Guan F. 2007. Analysis of variation of algae and organic matter in raw water transformation using 3-D fluorescence spectroscopy. Advances in Water Science, 18(4): 609-613.
(in Chinese with English abstract) |
The State Environmental Protection Administration. 2002. Water and Wastewater Monitoring and Analysis Method. 4th edn. China Environmental Science Press, Beijing, China.
(in Chinese)
|
Williams N J, Goldman C R. 1975. Succession rates in lake phytoplankton communities: with 1 figure in the text. SIL Proceedings 1922–2010, 19(2): 808-811.
DOI:10.1080/03680770.1974.11896126 |
Yang B, Jiang Y J, He W, Liu W X, Kong X Z, Jørgensen S E, Xu F L. 2016. The tempo-spatial variations of phytoplankton diversities and their correlation with trophic state levels in a large eutrophic Chinese lake. Ecological Indicators, 66: 153-162.
DOI:10.1016/j.ecolind.2016.01.013 |
Yao L G, Zhao X M, Zhou G J, Liang R C, Gou T, Xia B C, Li S Y, Liu C. 2020. Seasonal succession of phytoplankton functional groups and driving factors of cyanobacterial blooms in a subtropical reservoir in South China. Water, 12(4): 1167.
DOI:10.3390/w12041167 |
Yao X, Zhang Y L, Zhu G W, Qin B Q, Feng L Q, Cai L L, Gao G. 2011. Resolving the variability of CDOM fluorescence to differentiate the sources and fate of DOM in Lake Taihu and its tributaries. Chemosphere, 82(2): 145-155.
DOI:10.1016/j.chemosphere.2010.10.049 |
Zhao H J, Wang L, Yang L L, Yuan L W, Peng D C. 2015. Relationship between phytoplankton and environmental factors in landscape water supplemented with reclaimed water. Ecological Indicators, 58: 113-121.
DOI:10.1016/j.ecolind.2015.03.033 |
Zhu G H, Noman A, Narale D D, Feng W H, Pujari L, Sun J. 2020. Evaluation of ecosystem health and potential human health hazards in the Hangzhou Bay and Qiantang Estuary region through multiple assessment approaches. Environmental Pollution, 264: 114791.
|
 2022, Vol. 40


