Institute of Oceanology, Chinese Academy of Sciences
Article Information
- SUN Congtao, SUN Ming, TAO Tao, QU Feng, WANG Gongxun, ZHANG Peng, LI Yantao, DUAN Jizhou
- Chloride-binding capacity of mortars composed of marine sand subjected to external chloride penetration
- Journal of Oceanology and Limnology, 40(4): 1462-1471
- http://dx.doi.org/10.1007/s00343-021-1144-4
Article History
- Received Apr. 25, 2021
- accepted in principle Jul. 23, 2021
- accepted for publication Aug. 27, 2021
2 School of Civil Engineering, Qingdao University of Technology, Qingdao 266033, China;
3 School of Civil Engineering, Hunan University of Science and Technology, Xiangtan 411201, China;
4 Open Studio for Marine Corrosion and Protection, Pilot National Laboratory for Marine Science and Technology(Qingdao), Qingdao 266237, China;
5 Nantong Research and Development Center of Marine Science and Technology, Institute of Oceanology, Chinese Academy of Sciences, Nantong 226004, China
Due to excessive exploitation and utilization of river sand, the ecological conditions in many places have been destroyed. In offshore engineering, replacing the river sand with marine sand (MS) as fine aggregates is a promising way, which can also produce good economic results. Steel in marine sand concrete is prone to corrosion induced by internal chloride and external chloride, which bring about great reduction in the service life, especially in marine environment. Nonetheless, hydration products have a chloride-binding capacity against chloride penetration that can reduce the risk of steel corrosion (Li and Shao, 2014; Jiang et al., 2019; Liu et al., 2019; Li et al., 2020; Wang et al., 2020). Therefore, in order to promote the large scale of MS, chloride-binding capacity must be taken into account in the durability design and assessment of concrete structures.
The two main mechanisms of bound chloride are chemical binding and physical binding (Cao et al., 2020; Fu et al., 2020). Chloride binding is complicated, as many factors, such as chloride concentration, cement composition, cation of chloride salt, temperature, carbonation, supplement cementing, and hydroxyl concentration, affect the binding process (Yuan et al., 2009). The manner of introducing chloride is also an important factor influencing chloride-binding capacity. Two types of chloride, namely, internal chloride introduced by raw materials and external chloride introduced from the environment, can penetrate concrete. The chemical binding mechanisms differ between the two types of chloride. Internal chloride reacts with C3A (tricalcium) via adsorption, whereas external chloride reacts with AFm (calcium monosulphoaluminate) via ion exchange (Yuan et al., 2009; Wang et al., 2019; Yang et al., 2019). In either case, both mechanisms generate Friedel's salt in chemical binding. Additionally, the external chloride bound in cementitious materials is about two or three times higher than the binding capacity of internal chloride (Nagataki et al., 1993).
Chloride-binding products are unstable, and bound chloride can be released into pore solutions when the external environment changes because of carbonation, sulphate penetration, and temperature rise (Geng et al., 2015; Chang, 2017; Qiao et al., 2018; Shen et al., 2019). The decomposition of Friedel's salt or C-S-H gel (hydrated calcium silicate) under these conditions will release bound chloride, causing the chloride-binding capacity reduced or even lost completely. In addition, chloride concentrations in pore solutions are one of the most important factors influencing the stability of chloride-binding products. The increase in chloride concentration of pore solutions will also increase the tendency of chloride to be captured by hydration products, resulting in the generation of more chloride-binding products (Zhang et al., 2019). The reverse process of chloride binding also occurs due to the decrease in chloride concentration of the pore solutions (Thomas et al., 2012; Plusquellec and Nonat, 2016).
Both internal chloride and external chloride can be bound by cementitious materials, but the interactional relations amongst the materials are still not well identified. The introduction of internal chloride before external chloride dramatically influences the external chloride diffusion process, but the stability of bound internal chloride after external chloride penetration remains to be investigated. In addition, the chloride-binding capacity of hydration products in chloride environments after the partial introduction of internal chloride needs to be further explored.
In this research, the chloride-binding capacity of mortars composed of MS at different immersion times was investigated. Internal chloride was introduced into the MS mortar and the washed marine sand (WMS) mortar, whereas external chloride was introduced into the mortar specimens by using a salt solution. The contents of total chloride and free chloride were obtained by potentiometric titration, and the bound chloride content and bound chloride conversion rate were calculated. Then, the changes in chloride-binding capacity under different immersion times were analyzed, and the chloride-binding capacities between the two types of mortars were compared. The variations in the hydration products at different immersion times were obtained by X-ray diffraction (XRD) analysis and thermogravimetric analysis (TGA). The influence of external chloride on pore structure was analyzed by mercury intrusion porosimetry (MIP).
2 MATERIAL AND METHOD 2.1 MaterialOrdinary Portland cement (grade 42.5) was used in this research. The main chemical composition of the cement is given in Table 1. For the fine aggregate, typical MS was mined from sea area of Zhoushan, which is located in Zhejiang Province in China. Then, the WMS was desalinated using the abovementioned MS. The properties of the two types of sand are shown in Table 2.
The proportions of the mortars can be referred from GB/T1761-1999 (Test Method for Cement Mortar Strength). For all mortar specimens, the mass ratio of cement, sand, and water was 1:3:0.5. The fresh mortar was cast into a 70.7-mm × 70.7-mm × 70.7-mm cube mold. After 24 h of curing at room temperature, all mortar specimens were remolded and placed in a curing room at 20±2 ℃ and relative humidity (RH) of ≥98% for 28 d. Before immersion, the samples were dried at 50 ℃ for 24 h. Then, the specimens were immersed in substitute seawater after five sides of the specimens were coated with epoxy. The preparation of substitute seawater can be referred from ASTM D1141-98(2013) (Stand Practice for the Preparation of Substitute Ocean Water). The content of chloride salt is listed in Table 3. At the immersion times of 3, 7, 28, and 56 d, the specimens were extracted and dried at 50 ℃ for 24 h.
After the immersion, the specimens were powdered by a grinding machine for chloride content measurement. The concrete powders were separately collected at the intervals of 1 mm for the first 10-mm distance from the exposed surface, and then at the intervals of 2 mm at the distance range of 10–30 mm. The contents of free chloride and total chloride in the mortars were tested using the silver nitrate titration method in compliance with the standards of ASTM C1218/C1218M-99 (Standard Test Method for Water-Soluble Chloride in Mortar and Concrete) and ASTM C1152/C1152M-04 (Standard Test Method for Acid-Soluble Chloride in Mortar and Concrete), respectively.
2.3.2 XRD analysisThe phase assemblage of the samples was characterized by an X-ray diffractometer (D8 Advance, LynxEye, Germany) with Cu radiation and current of 40 mA and 40 kV, respectively. The test rate was 0.1 s/step at 0.02-degree steps. The powders at the depth of 4 mm were selected for testing the samples at the immersion ages of 3, 7, 28, and 56 d.
2.3.3 TGAThe phase assemblage was verified by TGA using a comprehensive thermal analyzer (SDT Q600, TA, USA). The specimens were heated from room temperature to 900 ℃ in N2 atmosphere. The powders at the depth of 4 mm were also selected for testing the specimens at immersion ages of 3, 7, 28, and 56 d.
2.3.4 MIPMIP was conducted to characterize pore size distribution. The samples were dried in an oven at 50 ℃ to achieve constant weight and then tested using AutoPore IV 9510 (Micromeritics Instrument Corporation, USA). The maximum pressure was 420 MPa, the contact angle was 140° and the surface tension was 480 mN/m. Each tested sample was prepared by considering the depth of 3–5 mm from the mortar in the range of 1–10 mm. The curing age was 28 d, and the immersion age was 56 d.
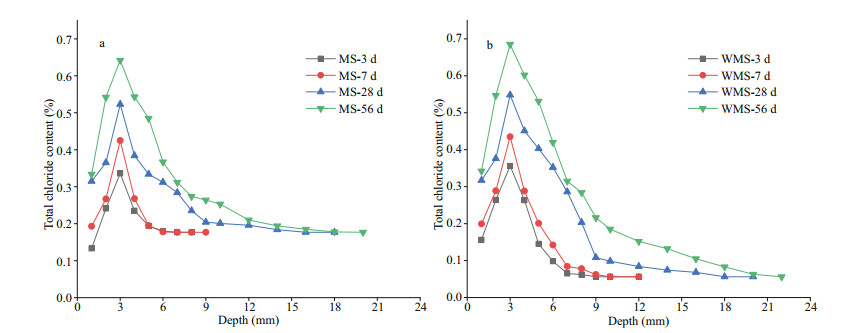
3 RESULT 3.1 Distribution of total chloride content at different immersion agesThe distribution curves of total chloride content in relation to depth for the mortars with MS or WMS at different immersion ages are shown in Fig. 1. As shown in the figure, the distribution of total chloride content can be divided into external chloride ions penetration area (EPA) and external chloride ions unaffected area (EUA). The total chloride content increases to the peak value at approximately 3 mm of depth from the exposed surface due to capillary adsorption (Zhao et al., 2020), and then it decreases due to chloride diffusion in EPA (Du et al., 2015). By contrast, the total chloride content appears somewhat unchanged in EUA. Moreover, with prolonged immersion time, the total chloride content at the different depths increases in EPA, and the range of external chloride ions penetration area expanded gradually. These trends suggest that more external chloride ions have penetrated the mortars, and it diffused deeper with prolonged immersion time.
|
| Fig.1 Distribution curves of total chloride content versus depth in the mortars a. MS; b. WMS. |
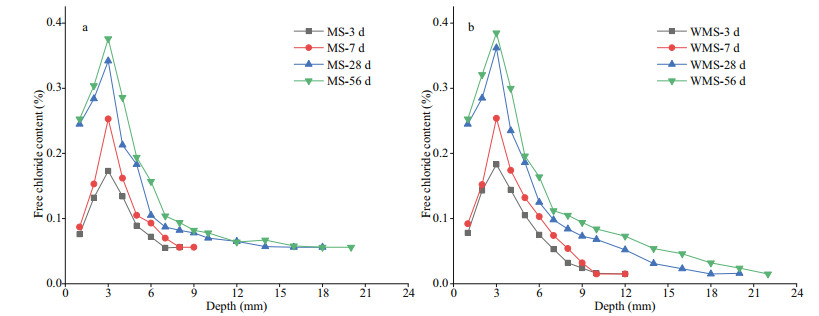
Figure 2 presents the distribution curves of free chloride content in relation to depth for the mortars with MS or WMS at different immersion ages. The distribution of free chloride content is highly consistent with the distribution of total chloride content. The distribution of free chloride content can also be divided into two areas (i.e., EPA and EUA). The free chloride content at the different depths increases with prolonged immersion time in the EPA, suggesting that the increase in free chloride content is closely related to external chloride penetration. By contrast, the free chloride content in the EUA is stable at the different immersion times.
|
| Fig.2 Distribution curves of free chloride content versus depth in the mortars a. MS; b. WMS. |
The chloride in this research is divided into two kinds, namely, internal chloride introduced by MS or WMS and external chloride introduced by the salt solution after cement hardening. Although chloride-binding capacity can be mainly divided into two aspects (i.e., chemical binding and physical adsorption), chloride migration resistance also plays an important role in hindering the transport of external chloride in concrete (Loser et al., 2010; Qu et al., 2018). A comparison of the total chloride contents of the MS and WMS mortars is shown in Fig. 1a–b, respectively. It is observed that the range of external chloride ions penetration area in the WMS mortar is larger than that in the MS mortar at the different immersion times. The external chloride ions penetration depths of WMS mortar on 3, 7, 28, and 56 d were 9, 9, 16, and 20 mm, respectively, and the external chloride ions penetration depths of MS mortar on 3, 7, 28, and 56 d were 6, 6, 14, and 16 mm, respectively. Moreover, the peak value of total chloride content of the WMS mortar is slightly higher than that of the MS mortar. The above phenomenon indicates that, compared with MS mortar, more external chloride ions can penetrate and diffuse deeper into the WMS mortar. When comparing with WMS mortar, more internal chloride ions introduced by fine aggregates in the MS mortar lead to higher chloride concentration in pore solution, and decreases the chloride concentration difference between inside and outside of mortar. Furthermore, the presence of chloride-binding products could refine pore structures (Sun et al., 2021). Both the high chloride concentration in pore solution and more refined pore structures in MS mortar can slow down the chloride diffusion. Therefore, the external chloride migration resistance of the MS mortar is higher than that of the WMS mortar. Although MS mortar has higher external chloride migration resistance, the increased risk of steel corrosion by large amount of internal chloride ions cannot be neglected.
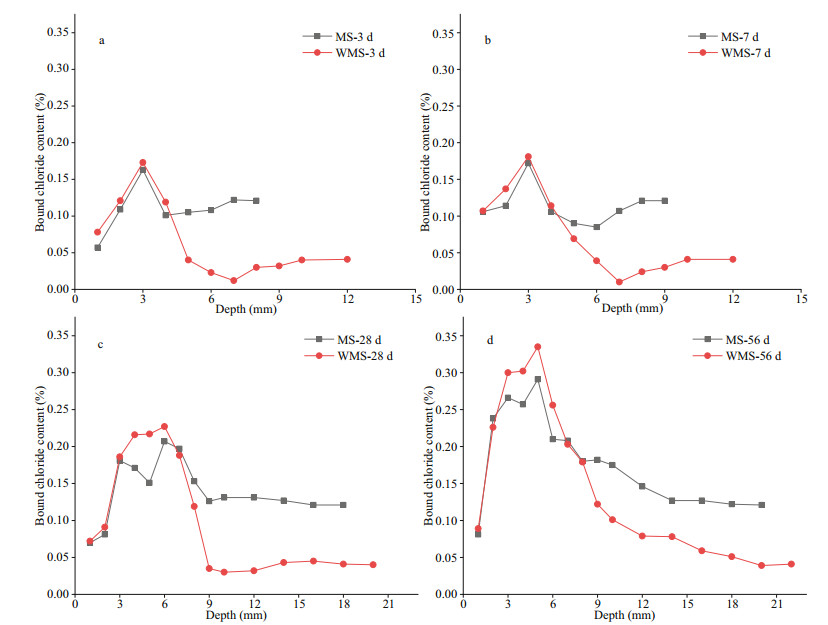
3.4 Distribution of bound chloride content at different immersion agesBound chloride content can be obtained by subtracting free chloride content from total chloride content. Figure 3 shows the distribution curves of bound chloride content at the different immersion ages. As shown in Fig. 3a–3b, the bound chloride content of the WMS mortar firstly rises and then drops within the range of 1–5 mm, and a peak appears at 3 mm, which is highly consistent with the distribution of total chloride content at the immersion ages of 3 and 7 d. The chloride in this research was divided into two types, namely, internal chloride introduced by MS and external chloride introduced by the salt solution after cement hardening. Our research scheme indicates that the hydration products have developed a bound-part internal chloride before the penetration of external chloride. Thus, the bound chloride content can be calculated as the sum of the internally bound chloride content and the externally bound chloride content. When external chloride penetrates the mortars, some external chloride ions will replace the OH− ions in the interlayer of AFm to form Friedel's salt, while some of them will be physically adsorbed by C-S-H gel (Yuan et al., 2009; Sui et al., 2019); both parts constitute the externally bound chloride content. As illustrated in Fig. 1b, the EPA of the WMS mortar appears in the range of 1–5 mm. The penetration of external chloride has dramatically increased the bound chloride content, and the externally bound chloride content is dominated in a range of 1–5 mm.
|
| Fig.3 Distribution curves of bound chloride content versus depth in the mortars a. 3 d; b. 7 d; c. 28 d; d. 56 d. |
Figure 3a–b also show the stable bound chloride content of the WMS mortar in the EUA, except in border of EPA-EUA (i.e., in the range of 6–10 mm), at the immersion ages of 3 and 7 d. The bound chloride content at the EPA-EUA border is significantly lower than those within the EPA or the EUA. Before external chloride penetration, some internal chloride ions will react with the cement clinker C3A and the hydration products Ca(OH)2 to form Friedel's salt via chemical binding, whilst some of them will be adsorbed in the C-S-H gel via physically binding (Yuan et al., 2009; Xu et al., 2019). However, chloride binding is a dynamic equilibrium process between the bound chloride by the hydration process and the free chloride in pore solutions (Qiao et al., 2018). Furthermore, the bound chloride may become unstable, especially the chloride concentration altered. Part of Friedel's salt can decompose and release bound chloride in low chloride concentrations (Thomas et al., 2012), whilst C-S-H gels can desorb part of the bound chloride with the decrease in local chloride concentration of the pore solutions (Thomas et al., 2012; Plusquellec and Nonat, 2016). External chloride can be introduced into mortar samples by using water as a carrier; however, the transport speeds of external chloride will differ in the materials, and water runs much deeper than external chloride (Zhang et al., 2017). Thus, we can conclude that the water arrived before external chloride penetration, a phenomenon that may reduce the chloride concentration of the pore solution at the EPA-EUA border. Subsequently, some of the bound chloride would be released and converted into free chloride, hence the decrease in bound chloride content.
As shown in Fig. 3c–d, the bound chloride content of the WMS mortar at the different depths in the EPA increases gradually with external chloride penetration and diffusion, suggesting that external chloride dominates the distribution of bound chloride content in this EPA. Besides, the bound chloride content at the EPA-EUA border gradually increases with prolonged immersion time. This finding may be due to the pore structure of the mortar that has been refined by the hydration process, leading to the gradual weakening of the diluting effects of water on chloride concentration.
The changing law of distribution of bound chloride content with prolonged immersion time in the MS mortar is similar that in the WMS mortar. However, the peak value of the bound chloride content in the WMS mortar is slightly higher than that in the MS mortar, whereas the bound chloride content of the MS mortar is much higher than that of the WMS mortar in the EUA, at the different immersion ages. These trends indicate that the WMS mortar can bind more external chloride, whereas the MS mortar can bind more internal chloride.
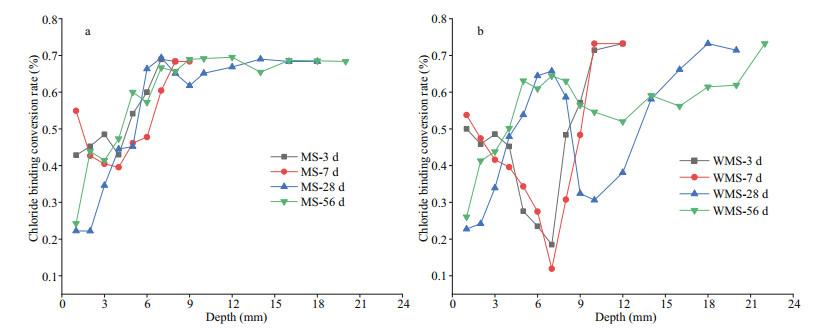
3.5 Distribution of bound chloride conversion rate at different immersion agesThe conversion rate of bound chloride can also represent the chloride-binding capacity of the mortars, and the bound chloride conversion rate can be calculated by dividing the bound chloride content by the total chloride content at the different depths (Chang, 2017). Figure 4 shows the distribution of the bound chloride conversion rate at different immersion ages. The bound chloride conversion rates of the two types of mortars in the EPA are significantly less than those in the EUA. However, the distribution of bound chloride conversion rate in the EPA varies across the different immersion ages. The bound chloride conversion rate of the WMS mortar is at the lowest point at 7 mm at the immersion ages of 3 and 7 d (i.e., similar to the lowest point of bound chloride content), and then it rises with the increase in depth in the EPA. At the immersion ages of 28 and 56 d, the bound chloride conversion rate of the WMS mortar in the EPA firstly increases, then decreases and finally increases. Notably, the turning point of bound chloride content of the WMS mortar (from low to high) in the EPA tends to move inward with longer immersion time. The changing law of bound chloride content conversion rate with immersion time in the MS mortar is similar to that in the WMS mortar. The above mentioned laws may be related to the cement hydration process, the pore structures of the mortars and the flow of chloride at different depths. However, the mechanisms need to be investigated further.
|
| Fig.4 Distribution curves of bound chloride conversion rate versus depth in the mortars a. MS; b. WMS. |
Compared with the findings about the MS mortar, the change in bound chloride conversion rate of the WMS mortar is larger in the EPA, and the turning point of bound chloride conversion rate of the WMS mortar (from low to high) is significantly lower. This finding indicates that, with respect to the MS mortar, the bound chloride conversion rate in the WMS mortar is affected greatly by external chloride penetration.
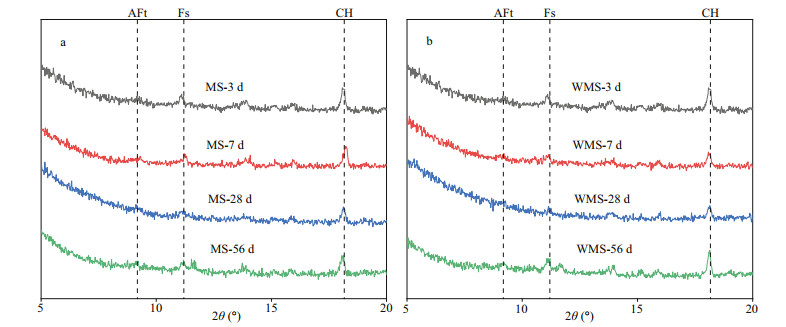
3.6 Phase assemblies of the mortars at different immersion agesAs the depth of 4 mm lies in the EPA and near the bound chloride content peak, the powder samples at 4 mm were selected for XRD analysis and TGA. Figure 5a−b present the XRD scattering patterns of the two types of mortars at different immersion ages. Both plots clearly show strong peaks of Friedel's salt (PDF# 42-0558) at the different immersion ages, indicating the occurrence of chemical binding in the EPA at each immersion age. The formation of Friedel's salt may have involved two mechanisms in this study, namely, (a) internal chloride ions reacting with C3A, i.e., C3A+CaCl2+10H2O→C3A·CaCl2·10H2O (1) Ca(OH)2+2NaCl=CaCl2+2Na++2OH− (2) and (b) the AFm-type phases transforming into Friedel's salt as the external chloride ions partially or completely substitute the original anions in the interlayer of the AFm type (Matschei et al., 2007; Yuan et al., 2009; Liu et al., 2016). Besides, it can be seen that the peaks of Ca(OH)2 (PDF# 04-0733) are slightly decrease with immersion time. This can be attributed to the formation of the Friedel's salt consumed large amount of Ca(OH)2. And AFt (ettrinigite, PDF# 41-1451) is also found MS mortar and WMS mortar at each immersion age.
|
| Fig.5 The XRD diagram of each specimen at different immersing time a. MS; b. WMS. AFt: ettrinigite; Fs: Friedel's salt; CH: calcium hydroxide. |
Figure 6a–b show the thermogravimetric (TG) and derivative thermogravimetric (DTG) curves of the two types of mortars at different immersion ages and the associated phases corresponding to the weight loss peak. The weight loss around 100 ℃ corresponds to dehydration of C-S-H and AFt (Wang et al., 2019); AFm endothermic peaks are observed for temperatures near 150 ℃ (De Weerdt et al., 2011); and the endothermic peaks between 390 ℃ and 500 ℃ are attributed to the decomposition of Ca(OH)2 (Zajac et al., 2014). The wide peak around 700 ℃ accounts for Ca(CO)3 decomposition. Peaks attributed to Friedel's salt are found in the range of 300 ℃ to 350 ℃ (Yang et al., 2020), and they are prominent in the EPA at the different immersion ages, which confirms the results of XRD analysis. The Friedel's salt content shows an increasing trend with prolonged immersion age, indicating that more chloride is bound by chemical binding with immersion time.

|
| Fig.6 The TG curves of each specimen at different immersing time a. MS; b. WMS. AFm: AFm phases; CH: calcium hydroxide; Cc: calcium carbonate; TG: thermogravimetric; DTG: derivative thermogravimetric. |
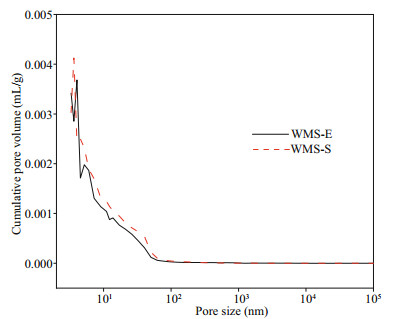
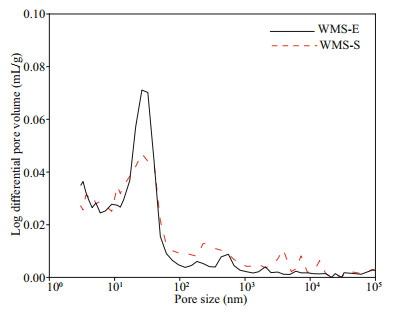
The influence of external chloride ions on the pore structure of mortars was further explored on the basis of the higher penetration of external chloride in the WMS mortar than in the MS mortar, and the pore structures of WMS-E (the specimen exposed for 56 d in the chloride salt solution) and WMS-S (the specimen cured for 28 d in a standard environment) were compared. Figure 7 shows the relationship between the pore sizes and cumulative pore volumes of the WMS-E and WMS-S samples. The cumulative pore volume decreased after immersion in the salt solution. Figure 8 shows the pore size distributions of the WMS-E and WMS-S samples. As illustrated by the curves in the figure, the amount of coarse capillary pores larger than 100 nm in the WMS-S specimen is much higher than that in the WMS-E specimen. By contrast, the amount of fine capillary pores smaller than 100 nm in the WMS-E specimen is higher than that in WMS-S specimen, which indicating the introduced external chloride increase the amount of fine capillary pores.
|
| Fig.7 Relationship between pore size and cumulative pore volume WMS-E: the specimen exposed for 56 d in the chloride salt solution; WMS-S: the specimen cured for 28 d in a standard environment. |
|
| Fig.8 Differential curves of pore size distributions |
The EPA of the WMS mortar is significantly larger than that of the MS mortar at the different immersion ages, and the peak value of total chloride content in the WMS mortar is slightly higher than that in the MS mortar. The external chloride diffuses deeper into the WMS mortar than in the MS mortar, and more external chloride penetrates the WMS mortar. These findings indicate that the external chloride migration resistance of the WMS mortar is lower than that of the MS mortar.
The bound chloride contents of the two types of mortars firstly increase and then decrease with depth in the EPA, whereas the bound chloride contents are stable in the EUA at the different immersion ages. The bound chloride content at the different depths in the EPA increases with the length of immersion time. However, a significantly decreased area of the bound chloride content exist at the EPA-EUA border during the early immersion ages of 3 and 7 d, which may be due to the diluting effects of water on chloride concentration. This decreased area disappears gradually along with the weakening diluting effects of water on chloride concentration, which is caused by the refinement of the pore structures by the hydration process. The peak value of the bound chloride content in the WMS mortar is slightly higher than that in the MS mortar, whilst the internally bound chloride content in EUA of the MS mortar is much higher than that of the WMS mortar. These findings indicate that the WMS mortar binds more external chloride, whereas the MS mortar binds more internal chloride.
The bound chloride conversion rates of the two types of mortars firstly decrease and then increase with depth in the EPA at the immersion ages of 3 and 7 d, whereas they firstly increase, then decrease and finally increase in the EPA at the immersion ages of 28 and 56 d. The turning points of the bound chloride content rates of the two types of mortars (from low to high) move inward with prolonged time in the EPA. The changing extent of the bound chloride conversion rate of the WMS mortar in the EPA is more than that of the MS mortar, suggesting that the bound chloride conversion rate in the WMS mortar is affected more greatly by external chloride penetration than in the MS mortar.
Friedel's salt exists at different immersion ages, and the amounts of Friedel's salt tend to increase with prolonged immersion time. The penetration of external chloride penetration can increase the amount of fine capillary pores smaller than 100 nm in WMS-E specimen.
5 DATA AVAILABILITY STATEMENTThe datasets generated during the current study are available from the corresponding author on reasonable request.
American Society of Testing Materials. 1999. Standard Test Method for Water-Soluble Chloride in Mortar and Concrete (ASTM C1218/C1218M-99). America.
|
American Society of Testing Materials. 2004. Standard Test Method for Acid-Soluble Chloride in Mortar and Concrete (ASTM C1152/C1152M-04).
|
American Society of Testing Materials. 2013. Stand Practice for the Preparation of Substitute Ocean Water (ASTM D1141-98(2013)).
|
Cao Y Z, Guo L P, Chen B, Wu J D. 2020. Thermodynamic modelling and experimental investigation on chloride binding in cement exposed to chloride and chloridesulfate solution. Construction and Building Materials, 246: 118398.
DOI:10.1016/j.conbuildmat.2020.118398 |
Chang H L. 2017. Chloride binding capacity of pastes influenced by carbonation under three conditions. Cement and Concrete Composites, 84: 1-9.
DOI:10.1016/j.cemconcomp.2017.08.011 |
De Weerdt K, Kjellsen K O, Sellevold E, Justnes H. 2011. Synergy between fly ash and limestone powder in ternary cements. Cement and Concrete Composites, 33(1): 30-38.
DOI:10.1016/j.cemconcomp.2010.09.006 |
Du X L, Jin L, Zhang R B. 2015. Chloride diffusivity in saturated cement paste subjected to external mechanical loadings. Ocean Engineering, 95: 1-10.
DOI:10.1016/j.oceaneng.2014.11.028 |
Fu C Q, Ye H L, Zhu K Q, Fang D M, Zhou J B. 2020. Alkali cation effects on chloride binding of alkali-activated fly ash and metakaolin geopolymers. Cement and Concrete Composites, 114: 103721.
DOI:10.1016/j.cemconcomp.2020.103721 |
Geng J, Easterbrook D, Li L Y, Mo L W. 2015. The stability of bound chlorides in cement paste with sulfate attack. Cement and Concrete Research, 68: 211-222.
DOI:10.1016/j.cemconres.2014.11.010 |
Jiang W Q, Shen X H, Hong S X, Wu Z Y, Liu Q F. 2019. Binding capacity and diffusivity of concrete subjected to freeze-thaw and chloride attack: a numerical study. Ocean Engineering, 186: 106093.
DOI:10.1016/j.oceaneng.2019.05.075 |
Li H X, Zhang H, Zhao P Q, Dong B Q, Wang P M, Sobolev K, Cheng X. 2020. Insights into the properties and chloride binding capacity of β-hemihydrate in the presence of slag powder and white calcium aluminate cement. Construction and Building Materials, 259: 119798.
DOI:10.1016/j.conbuildmat.2020.119798 |
Li J P, Shao W. 2014. The effect of chloride binding on the predicted service life of RC pipe piles exposed to marine environments. Ocean Engineering, 88: 55-62.
DOI:10.1016/j.oceaneng.2014.06.021 |
Liu W, Cui H Z, Dong Z J, Xing F, Zhang H C, Lo T Y. 2016. Carbonation of concrete made with dredged marine sand and its effect on chloride binding. Construction and Building Materials, 120: 1-9.
DOI:10.1016/j.conbuildmat.2016.05.011 |
Liu X H, Ma B G, Tan H B, Li H N, Mei J P, Zhang T, Chen P, Gu B Q. 2019. Chloride immobilization of cement-based material containing nano-Al2O3. Construction and Building Materials, 220: 43-52.
DOI:10.1016/j.conbuildmat.2019.05.148 |
Loser R, Lothenbach B, Leemann A, Tuchschmid M. 2010. Chloride resistance of concrete and its binding capacity—Comparison between experimental results and thermodynamic modeling. Cement and Concrete Composites, 32(1): 34-42.
DOI:10.1016/j.cemconcomp.2009.08.001 |
Matschei T, Lothenbach B, Glasser F P. 2007. The AFm phase in Portland cement. Cement and Concrete Research, 37(2): 118-130.
DOI:10.1016/j.cemconres.2006.10.010 |
Ministry of Construction, the State Administration of Quality Supervision Inspection and Quarantine People's Republic of China. 1999. Test Method for Cement Mortar Strength (GB/T1761-1999). China.
|
Nagataki S, Otsuki N, Wee T H, Nakashita K. 1993. Condensation of chloride ion in hardened cement matrix materials and on embedded steel bars. Materials Journal, 90(4): 323-332.
|
Plusquellec G, Nonat A. 2016. Interactions between calcium silicate hydrate (C-S-H) and calcium chloride, bromide and nitrate. Cement and Concrete Research, 90: 89-96.
DOI:10.1016/j.cemconres.2016.08.002 |
Qiao C Y, Suraneni P, Ying T N W, Choudhary A, Weiss J. 2018. Chloride binding of cement pastes with fly ash exposed to CaCl2 solutions at 5 and 23℃. Cement and Concrete Composites, 97: 43-53.
|
Qu Z Y, Yu Q L, Brouwers H J H. 2018. Relationship between the particle size and dosage of LDHs and concrete resistance against chloride ingress. Cement and Concrete Research, 105: 81-90.
DOI:10.1016/j.cemconres.2018.01.005 |
Shen X H, Liu Q F, Hu Z, Jiang W Q, Lin X S, Hou D S, Hao P. 2019. Combine ingress of chloride and carbonation in marine-exposed concrete under unsaturated environment: a numerical study. Ocean Engineering, 189: 106350.
DOI:10.1016/j.oceaneng.2019.106350 |
Sui S Y, Wilson W, Georget F, Maraghechi H, Kazemi-Kamyab H, Sun W, Scrivener K. 2019. Quantification methods for chloride binding in Portland cement and limestone systems. Cement and Concrete Research, 125: 105864.
DOI:10.1016/j.cemconres.2019.105864 |
Sun C T, Sun M, Tao T, Qu F, Wang G X, Zhang P, Li Y T, Duan J Z. 2021. Chloride binding capacity and its effect on the microstructure of mortar made with marine sand. Sustainability, 13: 4169.
DOI:10.3390/su13084169 |
Thomas M D A, Hooton R D, Scott A, Zibara H. 2012. The effect of supplementary cementitious materials on chloride binding in hardened cement paste. Cement and Concrete Research, 42(1): 1-7.
DOI:10.1016/j.cemconres.2011.01.001 |
Wang Y Y, Shui Z H, Gao X, Huang Y, Yu R, Xiao X G. 2019. Modification on the chloride binding capacity of cementitious materials by aluminum compound addition. Construction and Building Materials, 222: 15-25.
DOI:10.1016/j.conbuildmat.2019.06.137 |
Wang Y Z, Liu C X, Tan Y, Wang Y C, Li Q M. 2020. Chloride binding capacity of green concrete mixed with fly ash or coal gangue in the marine environment. Construction and Building Materials, 242: 118006.
DOI:10.1016/j.conbuildmat.2020.118006 |
Xu Q, Ji T, Yang Z X, Ye Y L. 2019. Preliminary investigation of artificial reef concrete with sulphoaluminate cement, marine sand and sea water. Construction and Building Materials, 211: 837-846.
DOI:10.1016/j.conbuildmat.2019.03.272 |
Yang Z Q, Gao Y, Mu S, Chang H L, Sun W, Jiang J Y. 2019. Improving the chloride binding capacity of cement paste by adding nano-Al2O3. Construction and Building Materials, 195: 415-422.
DOI:10.1016/j.conbuildmat.2018.11.012 |
Yang Z Q, Sui S Y, Wang L G, Feng T T, Gao Y, Mu S, Tang L P, Jiang J. 2020. Improving the chloride binding capacity of cement paste by adding nano-Al2O3: the cases of blended cement pastes. Construction and Building Materials, 232: 117219.
DOI:10.1016/j.conbuildmat.2019.117219 |
Yuan Q, Shi C J, De Schutter G, Audenaert K, Deng D H. 2009. Chloride binding of cement-based materials subjected to external chloride environment—a review. Construction and Building Materials, 23(1): 1-13.
DOI:10.1016/j.conbuildmat.2008.02.004 |
Zajac M, Rossberg A, Le Saout G, Lothenbach B. 2014. Influence of limestone and anhydrite on the hydration of Portland cements. Cement and Concrete Composites, 46: 99-108.
|
Zhang J, Shi C J, Zhang Z H. 2019. Chloride binding of alkali-activated slag/fly ash cements. Construction and Building Materials, 226: 21-31.
|
Zhang P, Hou D S, Liu Q, Liu Z L, Yu J. 2017. Water and chloride ions migration in porous cementitious materials: an experimental and molecular dynamics investigation. Cement and Concrete Research, 102: 161-174.
|
Zhao K Y, Qiao Y, Zhang P, Bao J W, Tian Y P. 2020. Experimental and numerical study on chloride transport in cement mortar during drying process. Construction and Building Materials, 258: 119655.
|
 2022, Vol. 40


