 2022, Vol. 40
Institute of Oceanology, Chinese Academy of Sciences
Article Information
- ZHENG Shuwei, CHENG Heqin, TANG Ming, XU Wei, LIU Enfeng, GAO Shu, BEST Jim, JIANG Yuehua, ZHOU Quanping
- Sand mining impact on Poyang Lake: a case study based on high-resolution bathymetry and sub-bottom data
- Journal of Oceanology and Limnology, 40(4): 1404-1416
- http://dx.doi.org/10.1007/s00343-021-1137-3
Article History
- Received Apr. 28, 2021
- accepted in principle Jul. 13, 2021
- accepted for publication Aug. 25, 2021


2 State Key Lab of Estuarine & Coastal Research, East China Normal University, Shanghai 200062, China;
3 Departments of Geology, Geography and GIS, Mechanical Science and Engineering and Ven Te Chow Hydrosystems Laboratory, University of Illinois at Urbana-Champaign, Urbana IL 61801, USA;
4 Nanjing Geological Survey Center, China Geological Survey, Nanjing 210016, China
Lake systems, including ponds and impoundments, cover approximately 3% (4.6 million km2) of the world's non-oceanic surface and form vitally important ecosystems and water resources in local and global scales (Yang and Lu, 2014; Wang et al., 2017a; Yu et al., 2018; Yuan et al., 2021). However, many of these freshwater lake systems have been subjected to drastic changes in sediment accumulation or erosion, lakebed deformation, or severe water shortages in recent decades. For example, 30.4% of European lakes have experienced high sediment accumulation rates since AD 1850 (Rose et al., 2011), and in Canada, sedimentation rates in many lakes have also steadily increased during the late 20th century (Alighalehbabakhani et al., 2017).
Human activity, as one of the factors influencing the evolution of lakebed topography, has attracted much attention (Xu and Milliman, 2009). For example, the Three Gorges Dam (TGD), the world's largest hydropower dam, has led to rapid erosion in the middle reaches and subaqueous delta of the Changjiang (Yangtze) River since 2003 (Wu et al., 2020a; Zheng et al., 2020). The change in topography of many large rivers and deltas around the world, e.g., the Mississippi, Nile, Huanghe (Yellow), and Mekong rivers, has also been attributed to human activities, together with land subsidence and sea-level rise (Wang et al., 2010, 2017b; Best, 2019). Anthropogenic activity has also affected the evolution of river-lake systems (Mei et al., 2015; Zhang et al., 2016), and topographic change in large freshwater lakes, in terms of its great importance to regional development and ecosystems, has caused global concern (Xie et al., 2017). Sand mining exerts an increasingly detrimental effect within many rivers, lakes and nearshore regions across the globe (Bendixen et al., 2019; Wu et al., 2020b), with the management and amelioration of its effects demanding monitoring and quantification of sediment flux (Bendixen et al., 2019).
In 2000, Chinese government established a policy prohibiting illegal sand mining in the main channel of the Changjiang River (Wang et al., 2019). Since then, most sand mining activities shifted to the Poyang Lake (PL), a tributary of the Changjiang River (Fig. 1), and drastic changes in lakebed topography in the PL outlet channel occurred (Yu et al., 2012; Lai et al., 2014; Mei et al., 2015; Zhang et al., 2016). Li et al. (2014) pointed out that high intensity of illegal dredging changed the PL sedimentation system to sediment-exporting. De Leeuw et al. (2010) estimated that the PL supplies 9% of the total Chinese demand of sand. Mei et al. (2018) argued that the PL losing 782×104 t/a sediment during 2000–2012 and the PL outlet channel underwent slight erosion since 2003 (Mei et al., 2015). At the same location, Wu et al. (2015) compared 1980, 1988, and 2010 bathymetric data of the PL. They found that a high erosion rate of 30.75 cm/a, and that a total erosion depth of 3.69 m had occurred in the PL outlet between 1998 and 2010. Lai et al. (2014) pointing out that the discharge of the PL outlet channel has increased by a factor of up to 1.5–2 because intensive sand mining has widened and deepened the channel. Yao et al. (2018) found that the northern outlet channel underwent an average of 3 m of bed erosion from 1998 to 2010. Previous studies have analyzed the influence of sand mining on lakebed evolution of PL, but a lack of high-resolution topographic measurements has limited detailed study of the characteristics of the outlet channel, and its response to intensive sand mining.

|
| Fig.1 Location and morphological characteristics of the study area a. map of the middle and lower reaches of the Changjiang River, China; b. the study area at Poyang Lake outlet channel and survey lines (the length of the surveyed channel is approximately 40 km). Red circles and blue ellipses show sandpit locations in (b). Red stars show sampling locations in (b–e); c–e. cross-sections and the bed sediment sampling locations in detail. |
In the present study, we examine the bed and sub-bottom characteristics along the 40 km-long PL outlet navigation channel using a RESON SeaBat 7125 multi-beam echo sounder and an EdgeTech sub-bottom profiler. The objectives were to: 1) obtain high-resolution topographic data in order to quantify the geometry of sandpits and sand mining areas, including their depth, length and volume, 2) identify the influence of sand mining to sediment transport and bed topography evolution of the Poyang Lake. This contribution represents a case study on the large freshwater lakes that are disturbed by intensive sand mining around the world.
2 STUDY AREAThe Poyang Lake (PL) basin lies on the south bank of the Changjiang River (28°24′N–29°46′N, 115°49′E–116°46′E), and is the largest freshwater wetland in China, with a basin area of 162 000 km2 (Yao et al., 2017). It has a length of 170 km from north to south and a width of 74 km from east to west (Mei et al., 2015). The PL belongs to the subtropical monsoon climate with annual rainfall of 1 654 mm and average annual temperature of 17.6 ℃ (Zhang et al., 2014). The lake receives water and sediment from five tributaries (the Ganjiang, Fuhe, Xinjiang, Xiushui, and Raohe rivers) and flows into the Changjiang River through a narrow outlet channel to the north (Wu et al., 2007). These five tributaries contribute 85.4% of the total runoff and 87.2% of the suspended sediment load running into the PL (Mei et al., 2015).
Poyang Lake is approximately 4 000 km2 in area during the flood season, 3 to 4 times its size in the dry season, due to discharge interactions between the Changjiang River and PL (Wu et al., 2007). The runoff of the PL catchment ranged from 1 400 m3/s to 12 000 m3/s during 1953–2010. More than 9 500 dams and reservoirs were built in the PL basin before 2007 (Ye et al., 2013), with PL supplying 17% and 2% of total discharge and suspended sediment load of the Changjiang River, respectively (Mei et al., 2015).
The width of the 40-km outlet channel varies from 2.8–7.0 km in flood season, with flow being strongly influenced by the interactions of the Changjiang River and PL (Hu et al., 2007). Sand mining in the middle and lower Changjiang River seriously threatened the riverbed and embankment stability and therefore, it was banned in the main channel in 2000 (Jiang et al., 2015). As a result, sand mining was conducted in the main channel of the PL outlet and part of the Ganjiang River after 2007 (Jiang et al., 2015). Since then, ecological, environmental, hydrological and geomorphological changes within PL have raised significant concerns because PL is the largest floodplain system, bird reserve, and an important habitat for the Yangtze finless porpoise in China (Zhang et al., 2014; Li et al., 2018). At the same time, study of human activities and their effects on evolution of PL have prompted much research (Jiang et al., 2015). In the present study, a 40-km length of the outlet channel connecting to PL has been studied to analyze its morphology and evolution of the river and lake bed (Fig. 1).
3 MATERIAL AND METHOD 3.1 Multibeam data and analysisFor the main outlet channel of Poyang Lake, from Hukou to Ganjiang River, where sand mining activity is concentered (Wu et al., 2007), a total of ~79 km-long survey lines of multibeam and sub-bottom profiler data were obtained along the 40 km-long navigation channel (Fig. 1).
The subaqueous topography of the outlet channel was quantified using a Teledyne RESON Seabat 7125 multibeam echo sounder (MBES) with a working frequency of 400 kHz, central beam angle of 0.5° and ping rate of 20 Hz. The MBES has 512 beams and a theoretical depth resolution of 6-10 mm (Zheng et al., 2018). A Trimble real-time differential global positioning system (DGPS) was used to record position at a decimeter level of accuracy during the surveys. All MBES point cloud data was processed in PDS 2000 software, including: (1) sound speed correction, (2) calibrations for roll, pitch and yaw, and (3) error beam deletion. The speed of surveying vessel was controlled as constantly as possible at 2.5 m/s and minimum ping rate is 8–10 Hz. Therefore, longitudinally, the resolution between two points can reach up to 0.4 m. The coverage width of track-lines is 5–6 times of the water depth. The water depth in the study area is less than 40 m. Thus, laterally, the resolution between two points can reach up to 0.5 m. The final point cloud data was gridded to a resolution of 1 m×1 m. We used the real-time water level as the water depth during MBES surveying. Because the water discharge and level during the survey were 3 860-3 950 m3/s and 10.90-10.99 m respectively at Hukou station on September 22, 2016 (http://www.hubeiwater.gov.cn/). Thus, the depth error of the sonar data caused by the water level change is less than 0.09 m.
3.2 Sub-bottom profile data and analysisHigh-resolution imagery of the sub-bottom sedimentary structure along the PL outlet channel was collected using an EdgeTech 3100 sub-bottom profiler (Fig. 1), with a SB-216S tow-fish working at a frequency of 2–16 kHz. This system has a theoretical depth resolution of 6–10 mm at measurement depths < 300 m (Zhang et al., 2018). The tow-fish was deployed from a survey vessel using a 35 m-long tow cable, and the sub-bottom sonar data were collected using EdgeTech DISCOVER software. During the survey, the speed of the vessel was controlled as constant as possible at 1.5–3 m/s.
3.3 Lakebed sediment data and analysisSix bed surface sediment samples were collected at the three cross-sections (Fig. 1) using a "cap" type sampler, which collects the upper 0.03–0.10 m of the sediment (Zheng et al., 2018). Organic matter and CaCO3 concretions were removed by using 10% H2O2 and 10% HCL, and an appropriate amount of (Na2PO3)6 was used to disperse the sample. Grain-size analysis was subsequently performed using a Beckman Coulter Model LS13 320 Laser-diffraction Particle Size Analyzer. Parameters of median size, clay content, silt content, and sand content were analyzed.
3.4 Statistics of the sand mining parametersAs sandpits are usually present as single or multiple pits on the river/lakebed (Mei et al., 2015), we regarded the oval pits as concave with an abrupt edge and regular planar form (Fig. 2). The length (L), depth (H), and volume (V) of the sandpits were calculated in PDS 2000 software. First, a 1-m×1-m digital elevation model was generated from the processed MBES point cloud data. Secondly, L and H of the sandpits were measured manually three times, with an average value providing the final estimate. Lastly, the parameters of both sandpits and sand mining areas were computed as follows:

|
| Fig.2 MBES maps of the sand mining area/sandpit and parameters of sandpit a. 2D MBES map shows the sand mining area/sandpit topography in the Poyang lake outlet channel; b–c. 3D plot of a single sandpit showing its oval shape and cross-sectional profile; d: cross-section d1–d2 showing abrupt edge to the sandpit and its depth (H) and diameter (L). |
The area of a single grid cell (Si; m2):
 (1)
(1)where li and hi are the cell size.
The total area (ST) of sandpits or sand mining areas (m2) is thus:
 (2)
(2)where n is the number of the grid cells in the calculated area.
The total volume (VT) of sandpits or sand mining areas (m3) is thus:
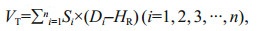 (3)
(3)where Di is the measured elevation of the bed (m), and HR is a reference level equal to the average depth of the surrounding bed outside the sandpit.
The lowest point depth in a sandpit or sand mining area (DLP) is then:
 (4)
(4)The maximum difference between these two values (DV) is thus:
 (5)
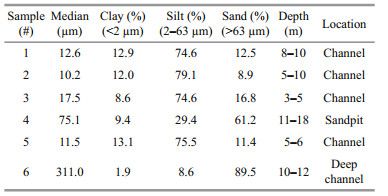
(5)The grain size of the bed sediment samples shows a median size between 10.2 and 311.0 μm as the sampling depth varying from 3 to 8 m (Table 1; Fig. 3). These samples can be divided into two categories according to their grain-size components. (Ⅰ): Median grain size of fine silt (10.2–17.5 μm), where the silt content is 74.6% to 79.1%, the clay content accounts for 10.2% to 17.5% and the sand content is 8.9% to 16.8% (Table 1). These samples (1#, 2#, 3#, and 5#) were collected at water depths of 3–10 m. (Ⅱ): Median grain size of sand (75.1–311.0 μm). The sand content here accounts for 61.2%–89.5%, while the silt content was 8.6%–29.4% and clay content was 1.9%–9.4% (Table 1). These samples (4# and 6#) were collected at water depths of 10–18 m.
|

|
| Fig.3 Grain size distributions curves of lakebed sediment in the PL outlet |
Among the six samples, 4# was taken from the sand mining area while samples 1#, 2#, 3#, and 5# were in shallow water (water depth < 10 m) and 6# was sampled in the main waterway (water depth > 10 m; Fig. 1 & Table 1). The grain-size distribution of 4# from the sand mining area is the only sample to show a clear bimodality, with peaks in the sand (> 63 μm) and fine silt (2–16 μm) size classes (Fig. 3). All the other samples possess one primary peak or small secondary peaks.
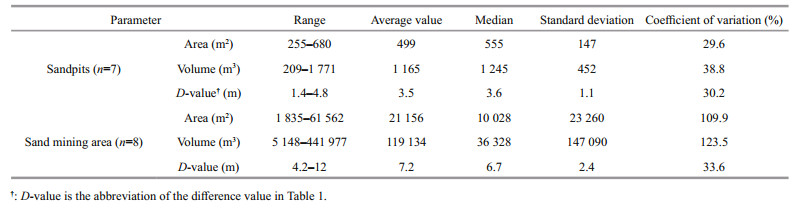
4.2 Bed morphology and sub-bottom sedimentary structureThe 79-km length of MBES data along the main channel (Fig. 1) shows that approximately 45% (~35.5 km) of the observed area comprised irregular sandpits or sand mining topography that often exhibits sharp edges with steep gradients (Fig. 2). These irregular sandpits were 1.4–4.8 m deeper than the surrounding bed surface (Table 2), and some single sandpits displayed an elliptical shape with a length of 20–130 m. However, the length of sand mining areas reached up to 1.0 km (Fig. 4d). The morphological characters of seven sandpits were estimated, which shows a volume between 209 and 1 771 m3, an area between 255 and 680 m2, with the average depth of the sandpits being 0.8–3.1 m (Fig. 1). However, the maximum sand mining depth can be up to 4.2–12 m deeper than the adjacent bed (Table 2).
|

|
| Fig.4 MBES maps of sand mining areas (a, c), with corresponding sub-bottom profiles (b, d) The red solid lines in (a) and (c) show the location of sub-bottom profiles. The yellow solid lines and white solid lines in (b) and (d) show the location of surface lakebed and internal layers. Sandpits and the corresponding sub-bottom profile, with internal layers, and depth of 1–8 m and 12 m are shown in (b) and (d) respectively. Thus, white and yellow solid lines in (b) and (d) show internal stratification and thickness of infill. Two white solid lines in (b) indicate multi-internal stratification. |
Dunes were mainly observed in the southern part of the study area (~4 km-long; Fig. 5a) near Xingzi Station, with straight to curved crest lines, a wavelength of 7–14 m and height of 0.3–0.6 m. In some reaches of the channel, it is hard to distinguish sand mining areas from flat bed and natural erosional topography solely from the MBES data. However, comparing the MBES data with sub-bottom profile data, it becomes possible to distinguish sand mining areas that have been subsequently infilled and are now regions of flatbed (Fig. 4a) from natural flatbed without previous sand mining (Fig. 4). Single sandpit may also indicate larger areas of sand mining that have undergone partial infill (Fig. 5b). Natural erosional topography is usually displayed as a strip of lower terrain, and whose subsurface structure is more homogenous than that of sand mining areas, and appears to be incised into underlying more cohesive materials that can sustain a steep margin (Fig. 5c). Most importantly, this erosional topography is generally without internal layering (Fig. 5c), whereas the sand mining areas display one to two layers (Fig. 4). In total, the sand mining areas, natural erosional topography, flat bed and dunes account for 44.9%, 21.4%, 28.6%, and 5.1% of the surveyed bed area, respectively.

|
| Fig.5 Types of lakebed morphology, Poyang Lake outlet channel a. dunes; b. sandpits; c. natural erosional topography; d. flat bed. |
Sub-bottom profile data show that approximately 65.8% (~27.0 km) of the PL outlet length developed internal layering at a sediment depth > 0.5 m (Fig. 4). These layering developed mainly in the areas of sand mining topography and part of the flat bed area (sand mining areas that have subsequent been infilled). The thickness of this internal layering varied from 0.5 to 8 m in the sand mining areas, while no internal layering appears beneath the natural erosional topography.
5 DISCUSSION 5.1 Estimation of sand mining volumeJiang et al. (2015) estimated that approximately 2 124 Mt (1.29×10⁶ m3) of sand was excavated from PL during 2000–2010. The authors also highlighted that sand mining activities in PL have affected an area of 260.4 km2 with an average depth of dredging of 4.95 m. Declines in sediment load may result in erosion of PL above the low water level at an average rate of 0.144 m/a from 2000 to 2010 (Zhang et al., 2016) and ~2.3 m of erosion from 2000 to 2016 at this same erosion rate assumingly. The above studies thus provided average values between 2.3 m and 4.95 m for bed erosion caused by sand mining. However, considering the uneven spatial distribution of sand mining, it is necessary to investigate the impact of sand mining activities on local bed topography.
In the present study, we examined the PL outlet channel and found that sand mining has an extensive and significant effect on local bed topography, with approximately 44.9% of the length of the PL outlet channel having sandpits/sand mining areas. As a result, the longitudinal profile of the PL outlet channel comprises sandpits/sand mining areas, natural erosional topography, flatbed and dunes (Figs. 4 & 5). The present high-resolution topographic data collected by MBES and sub-bottom profiler show the depth of sandpits can reach up to 1.4–12 m (Table 1), which are substantially larger than the results from Jiang et al. (2015) and Zhang et al. (2016). In addition, the maximum depth of sandpits and the relative depth of the navigation channel are of the same order of magnitude (Fig. 4).
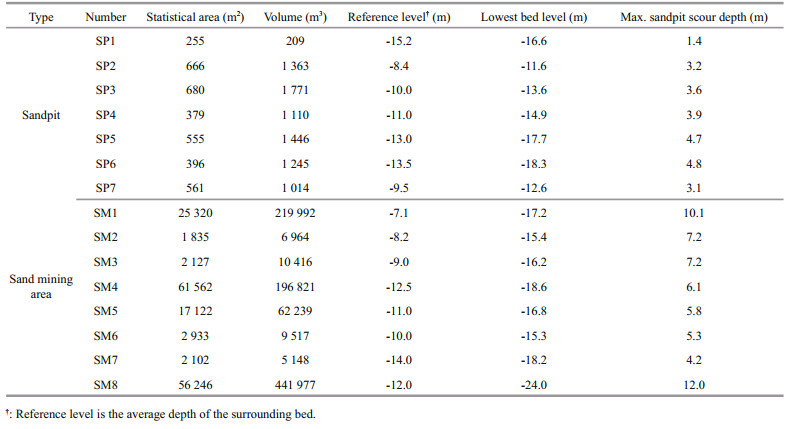
Three cross-sections with a length of 550 m to 1 km were measured as representative of the navigation channel cross-section (Fig. 1). The MBES data show that the depth of the navigation channel is 10–25 m relative to the elevation of the bed in the wet season (Fig. 1). Thus, the maximum depth of sandpits reaches up to 1.4–12 m, which accounts for 14%–48% of the relative channel depth (Figs. 1 & 4). This observation indicates that sand mining has changed the boundary conditions of the PL outlet channel. Furthermore, statistical data from seven sandpits show coefficients of variation (CV) of area, volume, and bed elevation difference of 29.6%, 38.8%, and 30.2%, respectively, whereas the CV values from the eight sand mining areas, for area, volume and bed elevation difference, are 109.9%, 123.5%, and 33.6%, respectively (Table 3). The morphological parameters with high discreteness of sandpits/sand mining areas indicate that severe channel deformation on local bed topography has occurred due to sand mining activities. This result may lead to radical changes in hydrodynamic conditions in the PL outlet channel (Yuan et al., 2021).
|
Seven sandpits and eight sand mining areas data were calculated and the results show that they have a total volume of 7.63×10⁵ m3 with an area of 1.73×10⁵ m2 (Table 2). This result indicates that an average depth of 4.41 m was increased in the sand mining areas due to sand mining. Even though the spatial distribution of sand mining activities are highly dispersed in the PL outlet, the influence of sand mining activities cannot be ignored (accounts for 44.9% of the observation area). Furthermore, because of the large-scale and ongoing high intensity of sand mining activities in the outlet section, their morphological effects should be considered.
5.2 Effect of sand mining on sediment transport and bed evolution in Poyang LakeRegarding the sand mining activities in recent years (De Leeuw et al., 2010; Lai et al., 2014; Yao et al., 2018), it has been estimated that the total quantity of sand excavated from the Poyang Lake was at least 2 124 Mt (1.29×10⁶ m3) during the period 2001–2010, assuming a bulk density of 1.65 t/m3 for the bed material (Jiang et al., 2015). The total sediment input between 1956 and 2000 was 820.29×10⁶ Mt, with the total sediment output from Hukou being 475.67×10⁶ t, yielding an average value of 18.23×10⁶ t/a and 10.57×10⁶ t/a for sediment input and output, respectively (Li et al., 2015). Thus, the total sediment deposit in the PL between 1956 and 2000 was 404.29×10⁶ t, on average rate of 8.98×10⁶ t/a. This sediment budget changed after 2000 (Fig. 6). Dam construction, combined with soil and water conservation in the five tributary catchments, reduced annual sediment input load to 7.14×10⁶ t/a in 2001–2011 (Li et al., 2015) which is only 39.2% of its 1956–2000 value. However, the annual sediment output increased to 12.35×10⁶ t/a during 2001–2018, yielding a net erosion of sediment during this period of 5.68×10⁶ t/a (Fig. 6). Overall, sediment delivering into the PL declined after 2000, whereas sediment extraction and export from the lake increased. This has dramatically changed system from net deposition to net erosion. It is worth noting that before 2000, the changing trend of sediment load curves (input and output) are synchronous with the curves of annual flow discharge of the PL (Fig. 6). For instance, for several low values of sediment output in 1964 and 1991, the sediment input and annual flow discharge (input and output) also show low values (Fig. 6). However, this phenomenon altered after 2000. The annual flow discharge input and output only slightly varied from 1960–2018 (Mei et al., 2015), while the sediment input decreased and the output increased (Fig. 6). This evidence also indicates the sedimentary environment had changed from deposition to erosion in the PL after 2000.

|
| Fig.6 Annual sediment (a) and discharge (b) of the Poyang Lake from 1956 to 2018 (modified from Li et al., 2015) |
Previous study found that sandpits recover to their original state after sand mining if provided sufficient sediment fill in the excavated depressions (Gonçalves et al., 2014). When grain size of deposited sediment in sandpits is different from the original values, internal layering may appear which can be imaged by the sub-bottom profiler (Grant and Schreiber, 1990).
In the present study, we found most of the internal layering was concentrated in the reaches that have undergone sand mining (Fig. 7). This result indicates most of the sandpits have infilled by external sediment supply. Therefore, MBES imaging combined with sub-bottom profile data can quantify the large-scale negative topography and sand budget caused by sand mining (Figs. 4 & 5). The MBES imaging combined with sub-bottom profile data show infill of older sand mining areas to a state where the bed surface is now flatbed while the new sand mining areas are concave terrain (Fig. 4). This difference may be attributed to the presence of relatively new sandpits or sand mining areas. Continuous sand mining activities lead to the sandpits not been fully infilled with sediment. The study of Wang et al. (2019) supports this hypothesis. They found that the number of sand dredgers has continued to increase after 2010 (more and more illegal sand dredgers emerged because of the huge economic profits). Additionally, the sub-bottom profiler data also reveal that two- and multiple-internal layers may be present in the sand mining areas (Fig. 4), demonstrating successive periods of infill. Thus, the sand mining activities also changed the sediment transport and re-deposition in the Poyang Lake.

|
| Fig.7 The spatial distribution of natural erosional topography, sandpits, flat bed and dunes based on MBES data (a) and internal layering based on sub-bottom profile data (b) |
Sand mining activities are rising exponentially over the past several decades. The main reason is to meet the rapid industrialization and urbanization developments all over the world (Sreebha and Padmalal, 2011). This human activity has been reported to exert an increasingly detrimental effect within many rivers, lakes, and shoreline regions (Bendixen et al., 2019), which has led to bedform deformation, water shortages and sediment transport change, and series of ecological and environmental problems (Alighalehbabakhani et al., 2017).
Many studies have pointed out that sand mining can increase PL discharge ability by widening and deepening outlet channel (Lai et al., 2014). However, very few studies forced on high-resolution subaqueous topographic characteristics and its response mechanism. Our study shows detail lakebed and sub-bottom topography characteristics after sand mining. Lai et al. (2014) thought that the discharge ability of the PL outlet channel is related to the channel morphology, i.e., a wider and deeper channel is conducive to the lake draining quickly into the Changjiang River and leading to a low water level. Our data from MEBS and sub-bottom profiler show that the sand mining has led to the PL outlet channel deeper (~4.41 m at the sand mining area) and winder than before (Figs. 4b, c, & 5c). Thus, the widening and deepening of the PL outlet channel accelerated the runoff from PL flowing into the Changjiang River.
In order to alleviate the impact of sand mining on lakebed of the PL, it is necessary to 1) evaluate the stability of the PL lake-bed and find out the unstable area by using high-resolution bathymetric data, 2) evaluate exploitable sediment amount of the PL according to sediment input from five rivers and the topography characteristics of the lake-bed, 3) reestablish lake-bed balance and reduce water carrying capacity of the PL outlet channel by using sediment gradually fill rule, 4) monitor mining area and ensure the exploitation of river sand in a standardized and orderly way. These findings are conducive to our understanding of bed deformation trends for the other large lake systems with no or limited bathymetry data.
Although the present study could not discriminate contributions of sand mining and other impact factors, such as precipitation variation and Three Gorges Dam, to the Poyang Lake recession, our findings indicate that the sand mining in the lake outlet can increase the width and depth of the channel. The observed lake channel widening in the PL outlet suggests that large scale sand mining activities could cause lake erosion. This conclusion can be utilized in lake management and ecological planning for other lake system.
6 CONCLUSIONThe Poyang Lake is increasingly experiencing serious crises in its ecology, hydrology and subaqueous topography, caused by anthropogenic factors including sand mining, dam and reservoir construction, and water and soil conservation practices. The present study focuses on the influence of sand mining activities on bed evolution of a 40-km long outlet navigation channel from the Poyang Lake to the Changjiang River using high-resolution multibeam data and sub-bottom sedimentary data. The results reveal that:
The Poyang Lake outlet channel comprises four types of bed morphology: sand mining pits or areas (44.9% in areal coverage), natural erosional topography (21.4%), flat bed (28.6%) and subaqueous dunes (5.1%).
In addition to the revealed sand mining topography above, there is approximately another 65.8% of the subsurface sedimentary structure indicating evidence of previous sediment mining but now covered by a > 0.5-m thick sediment layer.
The area, volume, depth, and coefficient of variation of single sandpits range from 255–680 m2, 209–1 771 m3, 1.4–4.8 m, and 29.6%–38.8%, respectively. The associated sand mining areas are 1 853–61 562 m2, 5 148–441 977 m3, 4.2–12 m, 33.6%–123.5%, respectively.
An average depth of 4.41 m was increased in the sand mining areas in the PL outlet channel. The influence of sand mining activities includes widening and deepening of the PL outlet channel.
7 DATA AVAILABILITY STATEMENTAll data generated and/or analyzed during this study are from the corresponding author, Heqin CHENG. Due to the nature of this research, fund supporters of this study did not agree for their data to be shared publicly, so supporting data is not available.
Alighalehbabakhani F, Miller C J, Selegean J P, Barkach J, Abkenar S M S, Dahl T, Baskaran M. 2017. Estimates of sediment trapping rates for two reservoirs in the Lake Erie watershed: past and present scenarios. Journal of Hydrology, 544: 147-155.
DOI:10.1016/j.jhydrol.2016.11.032 |
Bendixen M, Best J, Hackney C, Iversen L L. 2019. Time is running out for sand. Nature, 571(7763): 29-31.
DOI:10.1038/d41586-019-02042-4 |
Best J. 2019. Anthropogenic stresses on the world's big rivers. Nature Geoscience, 12(1): 7-21.
DOI:10.1038/s41561-018-0262-x |
De Leeuw J, Shankman D, Wu G F, De Boer W F, Burnham J, He Q, Yesou H, Xiao J. 2010. Strategic assessment of the magnitude and impacts of sand mining in Poyang Lake, China. Regional Environmental Change, 10(2): 95-102.
DOI:10.1007/s10113-009-0096-6 |
Gonçalves D S, Pinheiro L M, Silva P A, Rosa J, Rebêlo L, Bertin X, Teixeira S B, Esteves R. 2014. Morphodynamic evolution of a sand extraction excavation offshore Vale do Lobo, Algarve, Portugal. Coastal Engineering, 88: 75-87.
DOI:10.1016/j.coastaleng.2014.02.001 |
Grant J A, Schreiber R. 1990. Modern swathe sounding and sub-bottom profiling technology for research applications: the atlas hydrosweep and parasound systems. Marine Geophysical Researches, 12(1-2): 9-19.
DOI:10.1007/BF00310559 |
Hu Q, Feng S, Guo H, Chen G Y, Jiang T. 2007. Interactions of the Yangtze River flow and hydrologic processes of the Poyang Lake, China. Journal of Hydrology, 347(1-2): 90-100.
DOI:10.1016/j.jhydrol.2007.09.005 |
Jiang F, Qi S H, Liao F Q, Zhang X X, Wang D, Zhu J X, Xiong M Y. 2015. Hydrological and sediment effects from sand mining in Poyang Lake during 2001-2010. Acta Geographica Sinica, 70(5): 837-845.
(in Chinese with English abstract) DOI:10.11821/dlxb201505014 |
Lai X J, Shankman D, Huber C, Yesou H, Huang Q, Jiang J H. 2014. Sand mining and increasing Poyang Lake's discharge ability: a reassessment of causes for Lake Decline in China. Journal of Hydrology, 519: 1698-1706.
DOI:10.1016/j.jhydrol.2014.09.058 |
Li B, Yang G S, Wan R R, Li H P. 2018. Hydrodynamic and water quality modeling of a large floodplain lake (Poyang Lake) in China. Environmental Science and Pollution Research, 25(35): 35084-35098.
DOI:10.1007/s11356-018-3387-y |
Li J, Tian L Q, Chen X L, Li X, Huang J, Lu J Z, Feng L. 2014. Remote-sensing monitoring for spatio-temporal dynamics of sand dredging activities at Poyang Lake in China. International Journal of Remote Sensing, 35(16): 6004-6022.
DOI:10.1080/01431161.2014.939783 |
Li W, Li C Y, Wu D Y, Chen D D. 2015. Characteristics of runoff-sediment into and out of the Poyang Lake from 1956 to 2011. Resources and Environment in the Yangtze Basin, 24(5): 832-838.
(in Chinese with English abstract) |
Mei X F, Dai Z J, Du J Z, Chen J Y. 2015. Linkage between three gorges dam impacts and the dramatic recessions in China's largest freshwater lake, Poyang Lake. Scientific Reports, 5: 18197.
DOI:10.1038/srep18197 |
Mei X F, Du J, Dai Z J, Du J Z, Gao J J, Wang J. 2018. Decadal sedimentation in China's largest freshwater lake, Poyang Lake. Geochemistry, Geophysics, Geosystems, 19(8): 2384-2396.
DOI:10.1029/2018GC007439 |
Rose N L, Morley D, Appleby P G, Battarbee R W, Alliksaar T, Guilizzoni P, Jeppesen E, Korhola A, Punning J M. 2011. Sediment accumulation rates in European lakes since AD 1850: trends, reference conditions and exceedence. Journal of Paleolimnology, 45(4): 447-468.
DOI:10.1007/s10933-010-9424-6 |
Sreebha S, Padmalal D. 2011. Environmental impact assessment of sand mining from the small catchment rivers in the southwestern coast of India: a case study. Environmental Management, 47(1): 130-140.
DOI:10.1007/s00267-010-9571-6 |
Wang C L, Zhao Y F, Zou X Q, Xu X W H, Ge C. 2017b. Recent changing patterns of the Changjiang (Yangtze River) Estuary caused by human activities. Acta Oceanologica Sinica, 36(4): 87-96.
DOI:10.1007/s13131-017-1017-z |
Wang H J, Bi N S, Saito Y, Wang Y, Sun X X, Zhang J, Yang Z S. 2010. Recent changes in sediment delivery by the Huanghe (Yellow River) to the sea: causes and environmental implications in its estuary. Journal of Hydrology, 391(3-4): 302-313.
DOI:10.1016/j.jhydrol.2010.07.030 |
Wang J D, Sheng Y W, Wada Y. 2017a. Little impact of the Three Gorges Dam on recent decadal lake decline across China's Yangtze Plain. Water Resources Research, 53(5): 3854-3877.
DOI:10.1002/2016WR019817 |
Wang P, Zhang X X, Qi S H. 2019. Was the trend of the net sediment flux in Poyang Lake, China, altered by the Three Gorges Dam or by sand mining?. Environmental Earth Sciences, 78(3): 64.
DOI:10.1007/s12665-019-8063-0 |
Wu F R, Tong C F, Torkelson M, Wang Y. 2020a. Evolution of shoals and vegetation of Jiuduansha in the Changjiang River Estuary of China in the last 30 years. Acta Oceanologica Sinica, 39(8): 71-78.
DOI:10.1007/s13131-020-1636-7 |
Wu G F, De Leeuw J, Skidmore A K, Prins H H T, Liu Y L. 2007. Concurrent monitoring of vessels and water turbidity enhances the strength of evidence in remotely sensed dredging impact assessment. Water Research, 41(15): 3271-3280.
DOI:10.1016/j.watres.2007.05.018 |
Wu G P, Liu Y B, Fan X W. 2015. Bottom topography change patterns of the Lake Poyang and their influence mechanisms in recent 30 years. Journal of Lake Sciences, 27(6): 1168-1176.
(in Chinese with English abstract) DOI:10.18307/2015.0623 |
Wu Z Y, Zhao D N, Syvitski J P M, Saito Y, Zhou J Q, Wang M W. 2020b. Anthropogenic impacts on the decreasing sediment loads of nine major rivers in China, 1954-2015. Science of the Total Environment, 739: 139653.
DOI:10.1016/j.scitotenv.2020.139653 |
Xie C, Huang X, Mu H Q, Yin W. 2017. Impacts of land-use changes on the lakes across the Yangtze floodplain in China. Environmental Science & Technology, 51(7): 3669-3677.
DOI:10.1021/acs.est.6b04260 |
Xu K H, Milliman J D. 2009. Seasonal variations of sediment discharge from the Yangtze River before and after impoundment of the Three Gorges Dam. Geomorphology, 104(3-4): 276-283.
DOI:10.1016/j.geomorph.2008.09.004 |
Yang X K, Lu X X. 2014. Drastic change in China's lakes and reservoirs over the past decades. Scientific Reports, 4: 6041.
DOI:10.1038/srep06041 |
Yao J, Li Y L, Li M F, Zhang Q. 2017. The influence of bathymetry changes on low water level of Lake Poyang. Journal of Lake Sciences, 29(4): 955-964.
(in Chinese with English abstract) DOI:10.18307/2017.0419 |
Yao J, Zhang Q, Ye X C, Zhang D, Bai P. 2018. Quantifying the impact of bathymetric changes on the hydrological regimes in a large floodplain lake: Poyang Lake. Journal of Hydrology, 561: 711-723.
DOI:10.1016/j.jhydrol.2018.04.035 |
Ye X C, Zhang Q, Liu J, Li X H, Xu C Y. 2013. Distinguishing the relative impacts of climate change and human activities on variation of streamflow in the Poyang Lake catchment, China. Journal of Hydrology, 494: 83-95.
DOI:10.1016/j.jhydrol.2013.04.036 |
Yu X P, Guo Y F, Deng T L. 2018. Antimony speciation at the sediment-water interface of the Poyang Lake: response to seasonal variation. Journal of Oceanology and Limnology, 36(6): 1941-1949.
DOI:10.1007/s00343-018-7314-3 |
Yu Z F, Chen X L, Zhou B, Tian L Q, Yuan X H, Feng L. 2012. Assessment of total suspended sediment concentrations in Poyang Lake using HJ-1A/1B CCD imagery. Chinese Journal of Oceanology and Limnology, 30(2): 295-304.
DOI:10.1007/s00343-012-1094-y |
Yuan S Y, Tang H W, Li K, Xu L, Xiao Y, Gualtieri C, Rennie C, Melville B. 2021. Hydrodynamics, sediment transport and morphological features at the confluence between the Yangtze River and the Poyang Lake. Water Resources Research, 57(3): e2020WR028284.
DOI:10.1029/2020WR028284 |
Zhang J H, Zhou F N, Cheng H Q, Shi S Y, Zhou Q P, Jiang Y H. 2018. Stability analysis on arc collapsing channel slope in the lower reaches of the Yangtze River based on multimodal sensor system. Journal of Natural Disasters, 27(1): 155-162.
(in Chinese with English abstract) |
Zhang Q, Ye X C, Werner A D, Li Y L, Yao J, Li X H, Xu C Y. 2014. An investigation of enhanced recessions in Poyang Lake: comparison of Yangtze River and local catchment impacts. Journal of Hydrology, 517(2): 425-434.
DOI:10.1016/j.jhydrol.2014.05.051 |
Zhang S Y, Liu Y X, Yang Y H, Sun C, Li F X. 2016. Erosion and deposition within Poyang Lake: evidence from a decade of satellite data. Journal of Great Lakes Research, 42(2): 364-374.
DOI:10.1016/j.jglr.2015.12.012 |
Zheng S W, Cheng H Q, Lv J S, Li Z J, Zhou L. 2020. Morphological evolution of estuarine channels influenced by multiple anthropogenic stresses: a case study of the North Channel, Yangtze estuary, China. Estuarine, Coastal and Shelf Science, 249: 107075.
DOI:10.1016/j.ecss.2020.107075 |
Zheng S W, Xu Y J, Cheng H Q, Wang B, Xu W, Wu S H. 2018. Riverbed erosion of the final 565 kilometers of the Yangtze River (Changjiang) following construction of the Three Gorges Dam. Scientific Reports, 8(1): 11917.
DOI:10.1038/s41598-018-30441-6 |