 2022, Vol. 40
Institute of Oceanology, Chinese Academy of Sciences
Article Information
- ZHANG Wenjing, WANG Weiqiang, XING Huibin
- Decadal variation and trend of the upper layer salinity in the South China Sea from 1960 to 2010
- Journal of Oceanology and Limnology, 40(4): 1333-1348
- http://dx.doi.org/10.1007/s00343-021-1161-3
Article History
- Received May 14, 2021
- accepted in principle Jun. 7, 2021
- accepted for publication Jul. 21, 2021


2 University of Chinese Academy of Sciences, Beijing 100049, China;
3 Southern Marine Science and Engineering Guangdong Laboratory(Guangzhou), Guangzhou 511458, China;
4 South China Sea Information Center, State Oceanic Administration, Guangzhou 510301, China;
5 South China Sea Marine Prediction Center, State Oceanic Administration, Guangzhou 510310, China
Ocean salinity is one of the most important physical characteristics of seawater, determining seawater density and ocean circulation together with temperature and pressure (Delcroix et al., 1996; Lagerloef et al., 2010). Salinity affects mixing processes in water masses through its impacts on density and through double diffusion, and plays a vital role in ocean dynamics and thermodynamics (Maes et al., 2002; Rao and Sivakumar, 2003; Grunseich et al., 2011; Ren et al., 2011; Zhang et al., 2012, 2016; Katsura et al., 2013; Zhu et al., 2014, 2020). As an indicator of the marine hydrological cycle, ocean salinity also plays a crucial role in global climate variability (Lagerloef, 2002; Williams et al., 2007; Schmitt, 2008; Durack et al., 2012; Skliris et al., 2016; Yu et al., 2017). In recent years, salinity changes have attracted extensive attention and have been investigated on different spatial and temporal scales. Based on the repeat hydrographic section along 137°E, a significant increase in the late 1970s in the salinity and thickness of the North Pacific Tropical Water (NPTW) was revealed, which was related to the mid-1970s regime shift (Suga et al., 2000). Durack and Wijffels (2010) described the three-dimensional pattern of the long-term trends of global ocean salinity variations from 1950 to 2008, and proposed that the subsurface salinity variations were influenced not only by the surface salinity variations, but also by surface and subsurface temperature variations. Delcroix et al. (2007) emphasized the important role of Pacific Decadal Oscillation (PDO)-like signals in the surface salinity variation of the tropical Pacific, and found surface freshening before the mid-1970s and after the mid-1990s, and salinification between these two periods. In addition, a significant freshening trend of the surface and subsurface water in the North Pacific Subtropical Gyre (NPSG) was also demonstrated using long-term observations (Yan et al., 2012, 2013; Nan et al., 2015).
The South China Sea (SCS) is the largest semi-enclosed marginal sea between the Pacific Ocean and Indian Ocean, encompassing an area from 5°N to 25°N and from 105°E to 121°E. It is connected with the East China Sea to the northeast, the Pacific Ocean and Sulu Sea to the east, and the Indian Ocean to the west. The Luzon Strait (LS) is the main channel of water exchange between the SCS and the Western Pacific (WP). Because of the special geographical location of the SCS, the water masses in the SCS show both open-ocean and regional properties (Zeng et al., 2016b).
In the past decades, most studies of the SCS have focused on the temperature variability, ocean circulation, sea surface height, and Kuroshio intrusion (Shaw and Chao, 1994; Fang et al., 2002; Xue et al., 2004; Zhuang et al., 2010; Nan et al., 2013). However, salinity variability in the SCS, especially its low-frequency variation, is rarely studied. As measurements become more extensive, large data sets of historical and modern observations have been widely used to investigate global ocean salinity changes. Previous studies revealed that the surface and mixed layer salinity in the Indo-Pacific Ocean had pronounced decadal and long-term variations (Durack et al., 2012; Du et al., 2015). As part of the Indo-Pacific warm pool, the characteristics of water masses in the SCS also show remarkable decadal changes (Zeng et al., 2016b, 2021). Using the South China Sea Physical Oceanographic Dataset 14 (SCSPOD14, Zeng et al., 2016a), Zeng et al. (2016b) found a decadal variation of the subsurface (at depths between approximately 80 m and 250 m) salinity maximum (at depths of about 150 m) in the northern SCS (NSCS) from 1960 to 2012 and proposed that the subsurface waters started to freshen from 1960, salinified during 1975– 1993, and freshened again from 1993. Recent studies have shown that the upper ocean in the NSCS significantly freshened over the past decade (Nan et al., 2013, 2016; Zeng et al., 2014).
Nevertheless, more details about the salinity trends of the upper ocean in the SCS, especially, the horizontal and vertical distribution of the upper layer salinity variability on decadal time scales, remain unclear. Does the upper layer salinity have a similar decadal change as the subsurface salinity in the NSCS (Zeng et al., 2016b)? The purpose of this study is to identify and analyze the decadal variations of the upper layer salinity in the SCS from 1960 to 2010, and to demonstrate the horizontal and vertical structure of salinity trends in detail. To better understand the reasons for the salinity variations, a budget analysis is adopted to clarify the possible contributors to the decadal salinity variations. Furthermore, the impact of the decadal climate variability affecting the salinity changes in the SCS is discussed.
The rest of the paper is organized as follows. The data and methodology used in this study are briefly described in Section 2. In Section 3, the decadal variations and trends of the upper layer salinity in the SCS are described, and the possible factors responsible for such salinity changes are explored. Finally, Section 4 summarizes our main results.
2 DATA AND METHODOLOGY 2.1 DataThere are several datasets used in this study. The first data set utilized in this study is the Simple Ocean Data Assimilation (SODA) v2.2.4 reanalysis, covering the period of 1871 to 2010 (Carton and Giese, 2008). We use the monthly-mean salinity, zonal (u), meridional (v), and vertical (w) velocities fields from SODA. The SODA output is monthly data, with 0.5°×0.5° grid with 40 vertical levels down to 5 375-m depth. The SODA products have been widely and successfully applied in the SCS to the analysis of the salinity budget (Zeng et al., 2016b), the temperature and heat content changes (Song et al., 2014; Thompson et al., 2017; Xiao et al., 2018), the ocean circulation variation (Yang and Wu, 2012; Lan et al., 2015), and so on (Wang et al., 2006b). Since SODA assimilates observational data and the T/S profile observations in the SCS prior to the 1960s are scarce (Zeng et al., 2016b), we only discuss the salinity variations after 1960 in view of the inaccuracy of SODA before 1960s.
For validation, three other datasets are also used: 1) The EN.4.2.1 objective analysis product from the UK Met Office Hadley Centre (Good et al., 2013; https://www.metoffice.gov.uk/hadobs/en4). The EN4 data are monthly mean gridded data, with a horizontal resolution of 1°×1° and 42 vertical levels down to 5 350-m depth; 2) The climatological mean gridded SCSPOD14 (Zeng et al., 2016a; https://dx.doi.org/10.6084/m9.figshare.c.1513842); 3) IPRC Argo products: 1°×1° gridded monthly mean on standard levels from 2005 to 2016 (http://apdrc.soest.hawaii.edu/projects/argo/).
Last, the monthly precipitation on a 0.5° grid from 1960 to 2010 from the National Centers for Environmental Prediction's Climate Prediction Center (CPC) is adopted in this study (Chen et al., 2002). The evaporation data are taken from the Objectively Analyzed air-sea Fluxes (OAFlux), which can be downloaded from ftp://ftp.whoi.edu/pub/science/oaflux/data_v3/monthly/evaporation (Yu and Weller, 2007). For validation, we use another three different precipitation data sets. The monthly precipitation on 2.5° grid from 1979 to 2010 is obtained from the Global Precipitation Climatology Project (GPCP) (Adler et al., 2003). Monthly mean precipitation from the Tropical Rainfall Measuring Mission (TRMM) 3B43-V7 product (Huffman et al., 2007) and the European Centre for Medium-Range Weather Forecasts (ECMWF) reanalysis Interim (ERA-Interim) monthly precipitation and evaporation data with a horizontal resolution of 0.75°×0.75° are also used.
The PDO index used in this study is defined as the leading empirical orthogonal function (EOF) of monthly sea surface temperature anomalies poleward of 20°N in the Pacific Ocean (Mantua et al., 1997; http://jisao.washington.edu/pdo/PDO.latest.).
2.2 Salinity budget in the upper 100 m of the SCSTo understand the salinity changes of the upper layer in the SCS, the underlying processes that modulate the upper layer salinity variations are investigated. Following Hu et al. (2019), the salinity budget is formulated as
 (1)
(1)where
 (2)
(2) (3)
(3)and
 (4)
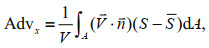
(4)Here S is salinity; t is the time; V is the volume of the SCS (105°E–121°E, 5°N–25°N); A is the surface area of the domain; E is the evaporation; P is the precipitation; Fs is surface freshwater forcing. Also, Advx is the salinity advection across the boundaries x: the x boundaries include four horizontal boundaries of the control volume at 105°E (Advw, western boundary), 121°E (Adve, eastern boundary), 25°N (Adv n, northern boundary), 5°N (Advs, southern boundary), and the bottom boundary of the control volume at the depth of 100 m (Advv, vertical advection). The horizontal advection Advh refers to the sum of Adv, Adv, Adv, and Adv. The expression 
The climatological distribution of salinity in the SCS is first presented in different depths before examining its variations (Fig. 1). Here, the climatology is defined as the average over 1981–2010. The most interesting and recognizable water masses in the SCS are the subsurface waters and intermediate waters, characterized as the maximum and minimum salinity, which are located at approximately 150- and 500-m depth, respectively (Qu et al., 2000; Zeng et al., 2016b). The spatial patterns of the surface, subsurface, and intermediate salinity in the SCS derived from SODA and SCSPOD14 datasets are in good agreement. The surface and the subsurface salinity in the SCS are lower than in the northwestern Pacific, whereas the salinity in the SCS is higher for the intermediate water, which is consistent with previous conclusions (Qu et al., 2000; Zeng et al., 2016b).

|
| Fig.1 Climatological distribution of SCS salinity at 5-, 150-, and 500-m depth derived from SODA (left panel) and SCSPOD14 data (right panel) |
Furthermore, a comparison between EN4, SODA, and Argo data are presented for the validation of SODA in representing SCS salinity variability. Time series of interannual salinity anomalies of the upper 100 m (the depth focused on in this study) averaged over the northern SCS (105°E–121°E, 17°N–25°N) derived from EN4, SODA, and Argo data are shown in Fig. 2. Though there are subtle discrepancies among different products, three datasets basically reach consensus. Despite strong interannual fluctuations, the decadal variations stand out as a significant feature for the period of 1960–2010. The model performance of the velocity/transport simulations based on SODA has been verified in many studies (e.g., Li et al., 2016, 2018; Zhu et al., 2016). To evaluate the discrepancies between the various evaporation and precipitation products, the long-term time series of annual-mean freshwater flux averaged over the SCS derived from CPC, GPCP, and TRMM precipitation data, and OAFlux evaporation data and ERA-Interim precipitation and evaporation data are compared (Fig. 3). As shown in Fig. 3, they reach consensus. For the salinity budget analysis in our study, the CPC precipitation data and OAFlux evaporation data are adopted. In the following, decadal variations and trends of the upper layer salinity will be discussed in detail based on SODA data.

|
| Fig.2 Time series of yearly salinity anomalies of the upper 100 m averaged over the northern SCS (105°E–121°E, 17°N–25°N) derived from EN4 (blue curve), SODA (black curve), and Argo (red curve) data The yearly anomaly is the mean of monthly anomaly of the year, which is defined as the monthly mean salinity minus the climatological annual cycle. |

|
| Fig.3 Long-term time series from 1960 to 2010 for basin-averaged annual-mean net freshwater flux (mm/d) derived from CPC (black curve), GPCP (blue curve), TRMM (red curve) precipitation data and OAFlux evaporation flux and ERA-Interim precipitation and evaporation data (magenta curve) |
To reveal the evolution of the salinity, the vertical structures of salinity anomalies averaged over the SCS (105°E–121°E, 5°N–25°N) are examined using time–depth plots from SODA data (Fig. 4). The salinity anomalies (Fig. 4a) exhibit a pronounced variation in the upper layer, especially above 100 m. The variations gradually weaken with increasing depth. To highlight long-term changes, the salinity anomalies smoothed by a 7-year low-pass filter are shown in Fig. 4b. Here, the Butterworth low-pass filter is adopted, and linear continuation method is used for boundary processing. It can be seen that the salinity anomalies show significant decadal variations, especially above 100 m. The upper ocean freshened from the 1960s to the mid-1970s, salinified from the mid-1970s to the mid-1990s, then freshened again after the mid-1990s. The freshening trend of the upper-ocean water after the mid-1990s is consistent with previous studies (Nan et al., 2016). Nan et al. (2016) revealed that the upper layer salinity decreased significantly after 1993. We also should note that the variations are still significant in deeper layer during some period, such as 1970s and 2010s.

|
| Fig.4 Time-depth maps of the salinity anomalies averaged over the SCS (105°E–121°E, 5°N–25°N) from 1960 to 2010 based on SODA data (a); (b) as in (a), but for the salinity anomalies smoothed by a 7-year low-pass filter (Butterworth filter) to highlight low-frequency variability Linear continuation method is used for boundary processing. |
Since the SCS circulation variability is driven by monsoonal wind variability (Fang et al., 2002), it is necessary to identify the role of monsoon reversed ocean status in interannual to decadal variation of salinity. Therefore, evolution of summer/winter salinity variations and its vertical structures during 1960 through 2010 are shown in Fig. 5. It shows that the seasonal difference is very slight, suggesting that the low-frequency variations of salinity in the upper ocean of the SCS are independent of season, although the freshening signal in the mid-1970s is stronger in summer than in winter. Overall, the salinity anomalies tend to be stronger in the upper 100 m, and therefore in the following, only the salinity changes of the upper 100 m in the SCS are focused on.

|
| Fig.5 As in Fig. 4, but for winter (a and b) and summer (c and d) |
To better understand the salinity changes and illustrate how the upper ocean salinity variation distributed horizontally, EOFs are calculated on the yearly salinity anomalies averaged from surface to 100 m based on SODA data. Since the decadal changes of the salinity are focused on, yearly salinity anomalies are first smoothed using a 7-year low-pass filter (Butterworth filter and linear continuation method) in order to remove the high-frequency signal before the EOF analysis. Here, linear continuation method is used for boundary processing. The first EOF mode of salinity anomalies and its corresponding principal component are shown in Fig. 6. As the result, the first EOF mode, which explains 58.999% of the variance, presents a spatially consistent pattern with positive values over the whole SCS. The strongest signal occurs west of Luzon Island and southwestern SCS. The time coefficient of EOF1, shown in Fig. 6b, further confirms a decreasing tendency from 1960 to 1975, an increasing tendency during 1976–1995 and a decreasing tendency from 1996 to 2010.

|
| Fig.6 The first EOF mode of the upper ocean salinity anomalies based on SODA data (a); the time coefficient of EOF1 (b) |
The analysis above shows that the upper ocean salinity in the SCS exhibits substantial decadal variability over the study period (Figs. 4–6). In addition to the decadal variability, the upper ocean salinity also shows significant trends during different periods. According to the above results, we divide the time series into three periods: 1960–1975, 1976–1995, and 1996–2010 to identify respective salinity trends. Figure 7 shows the average yearly salinity anomalies and their linear trends during these three periods. There is a freshening in the periods of before 1975 and after 1995, with salinification in the intervening years, which is basically consistent with the decadal variations of the subsurface salinity in the northern SCS (Zeng et al., 2016b). A low-frequency curve derived using a 7-year low-pass filter is overlaid to highlight decadal variations. To quantify the salinity changes of the upper layer, the linear trends for these three periods are calculated. Respectively, salinity decreased (~0.24) with a freshening trend of -0.16/decade from 1960 to 1975. From 1995 to 2010, the freshening trend is lower, about -0.06/decade, with the salinity falling by about 0.10. Between the two freshening periods, the salinity increased by about 0.16 with a salinification trend of 0.08/decade. Compared with the salinity trends of the subsurface water (about 150 m), the freshening trend of the upper 100 m is stronger, whereas its salinification trend is weaker during these respective periods (Zeng et al., 2016b). All the calculated trends above based on yearly average time series are statistically significant at the 95% confidence level according to a MannKendall test.

|
| Fig.7 Time series of the salinity anomalies of the upper 100 m averaged over the SCS (105°E–121°E, 5°N–25°N) based on SODA (red) Red circles with pink shading indicate error bar. The black dashed line represents the linear least squares fit of yearly values for the three periods. The low-frequency curve (blue) represents the 7-year filtered values based on SODA data. |
To further explore the regional difference of the salinity variations, the SCS is divided into three regions: the northern SCS (NSCS, 108°E–121°E, 16°N–23°N), the central SCS (CSCS, 108°E–121°E, 10°N–16°N) and the southern SCS (SSCS, 105°E–118°E, 5°N–10°N) (Fig. 8a). Interannual salinity anomalies of the upper 100 m averaged over the three regions of the SCS, the entire SCS, and WP (121°E–125°E, 15°N–25°N) are shown in Fig. 8b. It can been seen that regional difference of salinity variations in the SCS is relatively small (also shown in Fig. 6a), and they all show a decreasing trend before 1975 and after 1995 and an increasing trend during 1976–1995. It is noteworthy that the salinity trend in the WP is slightly smaller than that in the NSCS during these three periods.

|
| Fig.8 Division of regions (a); time series of the salinity anomalies of the upper 100 m averaged over the five regions from 1960 to 2010 (b) The northern SCS (NSCS, 108°E–121°E, 16°N–23°N) in red; the central SCS (CSCS, 108°E–121°E, 10°N–16°N) in blue; the southern SCS (SSCS, 105°E–118°E, 5°N–10°N) in green; SCS (105°E–121°E, 5°N–25°N) in black; WP (121°E–125°E, 15°N–25°N) in gray. |
To get a full view of the salinity trends, the spatial distribution of the linear trends of the upper ocean salinity for the three periods based on SODA data are shown in Fig. 9. From 1960 to 1975, there are negative trends in most areas. The maximum negative salinity trend of -0.3/decade occurs in the northeastern SCS west of the LS. Another strong negative signal (about -0.25/decade) appears in southern SCS. From 1976 to 1995, except for some regions in the southeastern SCS, the salinity has a positive trend in most areas with the maximum centers (about 0.25/decade) appearing in the NSCS. Figure 9c shows that from 1996 to 2010 there are negative trend in most areas except for some regions in the southeastern SCS, and salinity has a negative trend with the largest amplitude of -0.28 in the northwestern SCS. Another strong negative signal (about -0.15/decade) appears in the northeastern SCS west of the LS. Compared with Fig. 9a, the negative signal is weaker and mainly occurs north of 12°N during the second freshening period (Fig. 9c).

|
| Fig.9 Salinity trends (units: /decade) averaged above 100 m from 1960 to 1975 (a), from 1976 to 1995 (b), and from 1996 to 2010 (c) based on SODA data The black dots represent where the trend is statistically significant at the 95% confidence interval according to a Mann-Kendall test. |
To better reveal the vertical distribution of the salinity trends during these three periods, the salinity trends averaged in the four regions (Fig. 8) are examined (Fig. 10). The upper ocean salinity from surface to 300 m in the four regions all shows a negative trend during 1960–1975 and a positive trend from 1976 to 1995, and the upper ocean in all regions except for SSCS all shows a freshening trend except for the SSCS during 1996–2010, consistent with Fig. 9. As mentioned above, the salinity anomalies tend to be stronger in the upper 100 m and become weaker with increasing depth, which is also shown in Fig. 10. It should be noted that the freshening and salinification signals penetrate at least to 300-m depth in different periods, such as the freshening trend from 1960 to 1975 and the salinification trend from 1976 to 1995, while it is confined within a shallower depth in the second freshening period. The salinity in the four regions all has a freshening trend, and the salinity trend is the largest in the NSCS and CSCS from 1960 to 1975. During 1976–1995, they all show a positive trend in the upper 100 m and the largest salinity trend occurs in the NSCS. During 1996–2010, they all show a negative trend except for the SSCS, the larger freshening trend occurs in the NSCS in the upper 100 m.

|
| Fig.10 Vertical distribution of the mean salinity trends (units: /decade) in the different regions from 1960 to 1975 (a), from 1976 to 1995 (b), and from 1996 to 2010 (c) based on SODA data |
Based on SODA data, the above analysis reveals the upper ocean salinity trends in different periods in the SCS, which are a freshening trend before 1975 and after 1995 and a salinification trend from 1976 to 1995. In the following, quantitative analysis for mechanisms leading to salinity variations will be performed using SODA data.
3.3 Possible factors controlling long-term salinity changesIn order to evaluate relative contributions of different factors to long-term variations of the upper layer salinity in the SCS, a salinity budget analysis is used in this section to help identify the physical mechanisms. The surface layer salinity is controlled by surface freshwater forcing, and horizontal and vertical processes. According to Eq.1, the upper layer salinity changes are affected by advection (including horizontal advection and vertical advection) and surface freshwater forcing. For the salinity budget analysis, a control volume is selected, which is defined by the horizontal boundaries of 105°E–121°E, 5°N–25°N, and from the sea surface to the 100-m depth. A diagnosis of the box-averaged salinity budget terms in the SCS is presented in Fig. 11. It shows that the sum of yearly integrated advection (including horizontal advection and vertical advection) and surface freshwater forcing terms (∫Fsdt+∫Advhdt∫Advvdt) matches the salinity variation term well. The salinity advection and the surface freshwater forcing dominate the salinity variability simultaneously. To understand the relative importance of surface freshwater forcing, horizontal advection, and vertical advection on the salinity variations, salinity budget terms and subitems averaged over these three periods are shown in Fig. 12.

|
| Fig.11 Anomalous salinity averaged over upper 100-m area of the SCS and time-integration salinity budget terms The integrations were performed over an integration interval of one year. a. surface freshwater forcing term (∫Fsdt); b. horizontal advection term (∫Adv hdt); c. vertical advection term (∫Advv dt); d. the salinity anomaly (blue line), and the sum of all three terms from SODA (red line). |

|
| Fig.12 Salinity budget terms and subitems (10-2/a) averaged over various periods: 1960–1975 (a, b), 1976-1995 (c, d), and 1996–2010 (e, f) |
During the first freshening period horizontal advection, vertical advection, and surface freshwater forcing are all contributors to the negative salinity variability, and the relative contribution of horizontal advection is larger than the surface freshwater forcing and vertical advection. During the salinification period, the surface freshwater forcing and horizontal advection have comparable contributions to the significant positive salinity anomaly, and the vertical advection term with a smaller relative contribution plays a secondary role. During the second freshening period, the horizontal advection especially zonal advection, is the leading factor controlling the freshening, and the surface freshwater forcing has a negative contribution to the salinity anomaly. Moreover, the relative contribution of the horizontal advection is larger than that in the first freshening period. The vertical advection is relatively smaller than the horizontal advection term except for the first period. Furthermore, during these three periods, the relative contribution of zonal advection to salinity change is greater than that of meridional advection. Note that the advection across the west boundary appeared to be important, it is probably mainly affected by the west boundary current (Fang et al., 2012) and associated with the decadal modulation of zonal currents across 105°E around 1976/77 (Liu et al., 2007). More detailed mechanism discussion will be carried out in the future work.
According to Qu et al. (2005) and Nan et al. (2016), the freshwater exports across the outflow straits (Taiwan Strait, Mindoro Strait, and Karimata Strait) do not contribute much to the interannual SCS salinity budget. Nan et al. (2016) also suggested that the freshening trend of the upper layer ocean after 1993 was mainly controlled by the weakened Kuroshio intrusion. It is worth mentioning that the horizontal advection is associated with the salinity difference between the WP and the SCS and the advection transport. To estimate the contributions of the LS transport (hereafter in terms of T) changes and salinity changes, we compared the changes of three terms (anomalous T and ΔS, anomalous T and climatological ΔS, and climatological T and anomalous S) (Fig. 13). T changes is the dominant factor and the effect of salinity difference changes is limited. From Figs. 8 and 9, it can be seen that the salinity trend is smaller in the Kuroshio east of the LS than that in the NSCS. This indicates that the contribution of horizontal advection is mainly in zonal direction controlled by Kuroshio intrusion, and the effect of the salinity difference changes is limited.

|
| Fig.13 Times series of advection term during the period 1960-2010 These three terms are calculated to estimate the contributions of the T changes and salinity changes using the anomalous T and ∆S (black), anomalous T and climatological ∆S (blue), and climatological T and anomalous ∆S (red). |
According to previous studies, the SCS and tropical Pacific Ocean are influenced by the large-scale climate patterns in the El Niño-Southern Oscillation (ENSO) and PDO (Qu et al., 2004; Wang et al., 2006a; Singh and Delcroix, 2011; Deng et al., 2013; Yu and Qu, 2013; Skliris et al., 2014; Du et al., 2015; Zeng et al., 2018). Skliris et al. (2014) revealed that ENSO multi-decadal variability had a significant effect on the spatial patterns of evaporation minus precipitation and sea surface salinity (SSS) linear trends in the tropical Pacific Ocean over 1979–2010. Yu and Qu (2013) indicated that decadal variation of the upper-layer (0–745 m) Luzon Strait transport (LST) was closely related to the PDO. Du et al. (2015) revealed that the Pacific decadal climate change affects the decadal variability of SSS in the tropical western Pacific Ocean by changing the Walker circulation and ocean dynamic processes. Zeng et al. (2018) found that the change of SSS in the SCS is more closely associated with the PDO than with ENSO. Figure 14 shows the time series of the salinity averaged above 100 m in the SCS and PDO index. It can be seen that the salinity changes appear to have a PDO-like signal, with freshening during the negative PDO phase and salinification during the positive PDO phase, which suggests that the salinity changes of the upper 100 m in the SCS are closely related to the PDO.

|
| Fig.14 Time series of the upper layer (0–100 m) salinity in the SCS (red) and PDO index (blue) The thin dotted lines represent yearly salinity and PDO index, the heavy solid line represent the 7-year filtered values used to highlight long-term changes, black circles represent the strong (1967, 1986, 1995, and 2004) and weak (1963, 1972, 1991, and 2000) PDO years. |
To better understand the upper-layer circulation and local freshwater flux during the positive phase of the PDO, a composite event representing the differences between the strong (1967, 1986, 1995, and 2004) and weak (1963, 1972, 1991, and 2000) PDO years (Fig. 15) is analyzed. In the mean, intrusion of the Kuroshio across the LS is conspicuous (Fig. 15a). An anomalous westward current on the northern side of the North Equatorial Current (NEC) develops in the composite event (Fig. 15b), indicative a weak Kuroshio Current and a stronger Kuroshio intrusion (Qiu and Lukas, 1996; Yu and Qu, 2013; Zeng et al., 2016b), leading to more high-salinity water entering the SCS in the strong PDO years than in the weak PDO years. Furthermore, relative to the much wetter conditions in the weak PDO years, the SCS becomes drier in the strong PDO years (Fig. 15b). The decrease of the net freshwater flux and the increase of horizontal salt advection together provide favorable conditions for salinification during the positive PDO years, and vice versa. These results suggest that on decadal time scale the PDO has a significant influence on ocean current and the local net freshwater flux, and further affects the upper-layer salinity changes in the SCS.

|
| Fig.15 Long-term mean (1960–2010) SODA vertically mean (0–100 m) circulation (vectors, m/s) and freshwater flux (evaporation minus precipitation, shading, mm/d) (a) and the difference between the strong (1967, 1986, 1995, and 2004) and weak (1963, 1972, 1991, and 2000) PDO years (b) |
Furthermore, on the interannual time scale, Qiu and Chen (2010) have indicated that the bifurcation latitude of the NEC moves northward during El Niño years and the situation reverses during La Niña years. Northward shift of the NEC bifurcation (NECB) during El Niño weakens the Kuroshio off Luzon and is associated with increased throughflow within Luzon Strait (LS) into the SCS (Yang et al., 2013). Yu and Qu (2013) also found that the upper-layer LST showed a high correlation with the NECB latitude. Qiu and Lukas (1996) revealed that the interannual change of the NECB latitude is due to the positive wind stress curl anomaly over the North Pacific tropical gyre prior to the El Niño years that works to shift the NECB northward through the interior ocean's baroclinic adjustment. Gordon et al. (2014) revealed that distinct Kuroshio develops within Lamon Bay and the Lamon Bay T/S stratification displays abrupt shift in December 2011, which is induced by shift in NEC bifurcation. Xu et al. (2006) showed that the surface wind speed associated with the East Asian monsoon has significantly weakened in both winter and summer from 1969 to 2000. Jiang et al. (2021) recently revealed that the SCS experienced a significant reduction in warming rate during 1999–2010 following an accelerated and unprecedented warming in the last three decades (1970–1998), and further indicated the enhanced winter monsoon was the atmospheric driver that slowed down the SCS basin-scale warming, while the largest reduction of the warming rate occurred in the NSCS that can be attributed to the oceanic throughflow via the LS. According to previous conclusions, we wonder if there is a relationship between upper layer salinity trends, the NECB latitude changes and SSS trends, and if there is an air-sea factor that links heat and freshwater fluxes. Considering that the focus of this paper is the upper layer salinity variations and trends in the SCS, it will be investigated in our future work.
4 DISCUSSION AND SUMMARYThis study focused on the decadal variations and trends of the upper ocean salinity in the SCS from 1960 to 2010 and their possible mechanisms. The results indicate that the upper ocean salinity showed substantial decadal changes, i.e., decreased from 1960 to 1975 and after 1995 and increased from 1976 to 1995. Correspondingly, the salinity trends of the upper ocean are -1.60, 0.08, and -0.05/decade, respectively.
To get a comprehensive view of the salinity variability, horizontal and vertical structure of salinity trends are also examined during these three periods. Respectively, from 1960 to 1975 the upper ocean salinity shows a negative trend with the maximum value in the northeastern SCS west of the LS and the sub-maximum value in southern SCS; from 1976 to 1995 the upper salinity has a positive trend with the salty center in the NSCS; from 1996 to 2010 the upper salinity also has a negative trend with the most significant trend in the northwestern SCS. The vertical structure of the salinity trends in the different regions have a negative trend during 1960–1975 and 1996– 2010 and a positive trend from 1976 to 1995. Furthermore, the salinification signals penetrate at least to 300-m depth from 1976 to 1995, while it is confined within a shallower depth in the second freshening period. During 1960–1975, the salinity in the four regions all has a freshening trend, and the salinity trend is the largest in the NSCS and CSCS. They all show a positive trend in the upper 100 m and the largest salinity trend occurs in the NSCS from 1976–1995. During 1996–2010, they all show a negative trend except for the SSCS, the larger freshening trend occurs in the NSCS in the upper 100 m.
A salinity budget analysis is carried out to explain the contribution of primary factors. During the first freshening period horizontal advection, vertical advection, and surface freshwater forcing are all contributors to salinity freshening, and horizontal advection is relatively larger. For the salinification period, the contribution of horizontal advection and surface freshwater forcing to the positive salinity anomaly is comparable, while the vertical advection is a minor factor. The horizontal advection, especially zonal advection, is the dominant factor controlling the salinity anomaly during the second freshening period, and the horizontal advection plays a comparatively more important role than that in the first freshening period. Furthermore, the vertical advection term is relatively smaller than the horizontal advection term except for the first period. The contribution of zonal advection to salinity change is greater than that of meridional advection. In addition, the horizontal advection is controlled mainly by Kuroshio intrusion. Furthermore, the upper layer salinity changes appear to have a PDO-like signal, with freshening during the negative PDO phase and salinification during the positive PDO phase. PDO mainly influences the upper-layer salinity changes through both atmospheric bridge (surface freshwater forcing) and oceanic bridge (Kuroshio intrusion).
It is worth to note that we did not consider river runoff in the salinity budget analysis in this study, which might result in an underestimate of the contribution of the surface freshwater forcing. Also, lack of diffusion terms and variations our analysis cannot resolve (e.g., mesoscale eddies) in salinity budget analysis will bring some error. In addition, discussion on the relationship of the salinity changes and PDO is relatively preliminary, the details require further investigation in future. The results of this paper are based on SODA data. We must be conservative with our conclusions because of the uncertainty of reanalysis products, particularly in the SSCS, which has been plagued by sparse observations until recent decades. Regardless, the decadal variations and trends of the upper layer salinity in the SCS, which represents our best attempt to interpret the available data, is likely true for consistent results of the subsurface salinity in the NSCS and the mixed-layer salinity in the SCS (Zeng et al., 2016b, 2021). Furthermore, Zeng et al. (2021) investigated the long-term variability of the mixed layer salinity in the SCS using an in-situ observational dataset (SCSPOD15), which are relatively scattered. This study focuses on the decadal variations and trends of the upper ocean salinity (0–100 m) in the SCS using SODA data, which provides more comprehensive information on salinity changes. In addition, the horizontal and vertical structure of salinity trends are also examined during these three periods, which shows detailed characteristics of salinity changes in different regions of the SCS during these three periods. We also compared the horizontal patterns of salinity trends obtained from independent datasets including Ishii, EN4, and SODA data (figure not shown). The results show that they all have a good consistency in the horizontal distribution of salinity trends over the three periods. Sustained ocean observations and sensitivity experiments from a high-resolution, coupled atmosphere-ocean model is needed for further discussion of the salinity changes.
5 DATA AVAILABILITY STATEMENTThe SODA dataset that support the findings of this study are available in http://apdrc.soest.hawaii.edu/data/data.php. The EN4 dataset that support the findings of this study are available from the UK Met Office Hadley Centre (https://www.metoffice.gov.uk/hadobs/en4/). The SCSPOD14 dataset that support the findings of this study are available in https://doi.org/10.6084/m9.figshare.c.1513842. The evaporation data that support the findings of this study are available from the Objectively Analyzed air-sea Fluxes(OAFlux) (ftp://ftp.whoi.edu/pub/science/oaflux/data_v3/monthly/evaporation).The precipitation data that support the findings of this study are available from the National Centers for Environmental Prediction's Climate Prediction Center (CPC) (http://apdrc.soest.hawaii.edu/data/data.php).
6 ACKNOWLEDGMENTWe thank the UK Met Office Hadley Centre, Asia-Pacific Data-Research Center (APDRC) of the International Pacific research Center, and National Centers for Environmental Prediction's Climate Prediction Center for providing valuable data for this study. We are grateful to the anonymous reviewers and Dr. Yang CHEN from Journal of Oceanology and Limnology for their insightful comments and suggestions. We are grateful to Dr. Lili ZENG from South China Sea Institute of Oceanology, Chinese Academy of Sciences for her insightful suggestions.
Adler R F, Huffman G, Chang A, Ferraro R, Xie P P, Janowiak J, Rudolf B, Schneider U, Curtis S, Bolvin D, Gruber A, Susskind J, Arkin P, Nelkin E. 2003. The version-2 global precipitation climatology project (GPCP) monthly precipitation analysis (1979-present). Journal of Hydrometeorology, 4(6): 1147-1167.
DOI:10.1175/1525-7541(2003)004<1147:TVGPCP>2.0.CO;2 |
Carton J A, Giese B S. 2008. A reanalysis of ocean climate using simple ocean data assimilation (SODA). Monthly Weather Review, 136(8): 2999-3017.
DOI:10.1175/2007MWR1978.1 |
Chen M Y, Xie P P, Janowiak J E, Arkin P A. 2002. Global land precipitation: A 50-yr monthly analysis based on gauge observations. Journal of Hydrometeorology, 3(3): 249-266.
DOI:10.1175/1525-7541(2002)003<0249:GLPAYM>2.0.CO;2 |
Delcroix T, Cravatte S, McPhaden M J. 2007. Decadal variations and trends in tropical Pacific sea surface salinity since 1970. Journal of Geophysical Research: Oceans, 112: C03012.
DOI:10.1029/2006JC003801 |
Delcroix T, Henin C, Porte V, Arkin P. 1996. Precipitation and sea-surface salinity in the tropical Pacific Ocean. Deep Sea Research Part I: Oceanographic Research Papers, 43(7): 1123-1141.
DOI:10.1016/0967-0637(96)00048-9 |
Deng W F, Wei G J, Xie L H, Ke T, Wang Z B, Zeng T, Liu Y. 2013. Variations in the Pacific Decadal Oscillation since 1853 in a coral record from the northern South China Sea. Journal of Geophysical Research: Oceans, 118(5): 2358-2366.
DOI:10.1002/jgrc.20180 |
Du Y, Zhang Y H, Feng M, Wang T Y, Zhang N N, Wijffels S. 2015. Decadal trends of the upper ocean salinity in the tropical Indo-Pacific since mid-1990s. Scientific Reports, 5: 16050.
DOI:10.1038/srep16050 |
Durack P J, Wijffels S E, Matear R J. 2012. Ocean salinities reveal strong global water cycle intensification during 1950 to 2000. Science, 336(6080): 455-458.
DOI:10.1126/science.1212222 |
Durack P J, Wijffels S E. 2010. Fifty-year trends in global ocean salinities and their relationship to broad-scale warming. Journal of Climate, 23(16): 4342-4362.
DOI:10.1175/2010JCLI3377.1 |
Fang G H, Wang G, Fang Y, Fang W D. 2012. A review on the South China Sea western boundary current. Acta Oceanologica Sinica, 31(5): 1-10.
DOI:10.1007/s13131-012-0231-y |
Fang W D, Fang G H, Shi P, Huang Q Z, Xie Q. 2002. Seasonal structures of upper layer circulation in the southern South China Sea from in situ observations. Journal of Geophysical Research: Oceans, 107(C11): 3202.
DOI:10.1029/2002JC001343 |
Feng M, Biastoch A, Böning C, Caputi N, Meyers G. 2008. Seasonal and interannual variations of upper ocean heat balance off the west coast of Australia. Journal of Geophysical Research: Oceans, 113(C12): C12025.
DOI:10.1029/2008JC004908 |
Good S A, Martin M J, Rayner N A. 2013. EN4: quality controlled ocean temperature and salinity profiles and monthly objective analyses with uncertainty estimates. Journal of Geophysical Research: Oceans, 118(12): 6704-6716.
DOI:10.1002/2013JC009067 |
Gordon A L, Flament P, Villanoy C, Centurioni L. 2014. The nascent Kuroshio of Lamon Bay. Journal of Geophysical Research: Oceans, 119(7): 4251-4263.
DOI:10.1002/2014JC009882 |
Grunseich G, Subrahmanyam B, Murty V S N, Giese B S. 2011. Sea surface salinity variability during the Indian Ocean Dipole and ENSO events in the tropical Indian Ocean. Journal of Geophysical Research: Oceans, 116(C11): C11013.
DOI:10.1029/2011JC007456 |
Hu S J, Zhang Y, Feng M, Du Y, Sprintall J, Wang F, Hu D X, Xie Q, Chai F. 2019. Interannual to decadal variability of upper-ocean salinity in the southern Indian Ocean and the role of the Indonesian Throughflow. Journal of Climate, 32(19): 6403-6421.
DOI:10.1175/JCLI-D-19-0056.1 |
Huffman G J, Bolvin D T, Nelkin E J, Wolff D B, Adler R F, Gu G J, Hong Y, Bowman K P, Stocker E F. 2007. The TRMM multisatellite precipitation analysis: quasi-global, multiyear, combined-sensor precipitation estimates at fine scale. Journal of Hydrometeorology, 8(1): 38-55.
DOI:10.1175/JHM560.1 |
Jiang G Q, Jin Q J, Wei J, Malanotte-Rizzoli P, Gordon A L, Li M T. 2021. A reduction in the sea surface warming rate in the South China Sea during 1999-2010. Climate Dynamics, 57: 2093-2108.
DOI:10.1007/s00382-021-05796-8 |
Katsura S, Oka E, Qiu B, Schneider N. 2013. Formation and subduction of North Pacific tropical water and their interannual variability. Journal of Physical Oceanography, 43(11): 2400-2415.
DOI:10.1175/JPO-D-13-031.1 |
Lagerloef G S E. 2002. Introduction to the special section: the role of surface salinity on upper ocean dynamics, air-sea interaction and climate. Journal of Geophysical Research, 107(C12): 8000.
DOI:10.1029/2002JC001669 |
Lagerloef G, Schmitt R, Schanze J, Kao H Y. 2010. The ocean and the global water cycle. Oceanography, 23(4): 82-93.
DOI:10.5670/oceanog.2010.07 |
Lan J, Wang Y, Cui F J, Zhang N N. 2015. Seasonal variation in the South China Sea deep circulation. Journal of Geophysical Research: Oceans, 120(3): 1682-1690.
DOI:10.1002/2014JC010413 |
Lee T, Fukumori I, Tang B Y. 2004. Temperature advection: internal versus external processes. Journal of Physical Oceanography, 34(8): 1936-1944.
DOI:10.1175/1520-0485(2004)034<1936:TAIVEP>2.0.CO;2 |
Li J D, Liang C J, Tang Y M, Dong C M, Chen D, Liu X H, Jin W F. 2016. A new dipole index of the salinity anomalies of the tropical Indian Ocean. Scientific Reports, 6: 24260.
DOI:10.1038/srep24260 |
Li J D, Liang C J, Tang Y M, Liu X H, Lian T, Shen Z Q, Li X J. 2018. Impacts of the IOD-associated temperature and salinity anomalies on the intermittent equatorial undercurrent anomalies. Climate Dynamics, 51(4): 1391-1409.
DOI:10.1007/s00382-017-3961-x |
Liu Q Y, Wang D X, Xie Q, Huang Q Z. 2007. Decadal variability of Indonesian throughflow and South China Sea throughflow and its mechanism. Journal of Tropical Oceanography, 26(6): 1-6.
(in Chinese with English abstract) DOI:10.3969/j.issn.1009-5470.2007.06.001 |
Maes C, Picaut J, Belamari S. 2002. Salinity barrier layer and onset of El Niño in a Pacific coupled model. Geophysical Research Letters, 29(24): 2206.
DOI:10.1029/2002GL016029 |
Mantua N J, Hare S R, Zhang Y, Wallace J M, Francis R C. 1997. A Pacific interdecadal climate oscillation with impacts on salmon production. Bulletin of the American Meteorological Society, 78(6): 1069-1079.
DOI:10.1175/1520-0477(1997)078<1069:APICOW>2.0.CO;2 |
Nan F, Xue H J, Chai F, Wang D X, Yu F, Shi M C, Guo P F, Xiu P. 2013. Weakening of the Kuroshio intrusion into the South China Sea over the past two decades. Journal of Climate, 26(20): 8097-8110.
DOI:10.1175/JCLI-D-12-00315.1 |
Nan F, Yu F, Xue H J, Wang R, Si G C. 2015. Ocean salinity changes in the northwest Pacific subtropical gyre: the quasi-decadal oscillation and the freshening trend. Journal of Geophysical Research: Oceans, 120(3): 2179-2192.
DOI:10.1002/2014JC010536 |
Nan F, Yu F, Xue H J, Zeng L L, Wang D X, Yang S L, Nguyen K C. 2016. Freshening of the upper ocean in the South China Sea since the early 1990s. Deep Sea Research Part I: Oceanographic Research Papers, 118: 20-29.
DOI:10.1016/j.dsr.2016.10.010 |
Qiu B, Chen S M. 2010. Interannual-to-decadal variability in the bifurcation of the North Equatorial Current off the Philippines. Journal of Physical Oceanography, 40(11): 2525-2538.
DOI:10.1175/2010JPO4462.1 |
Qiu B, Lukas R. 1996. Seasonal and interannual variability of the North Equatorial Current, the Mindanao Current, and the Kuroshio along the Pacific western boundary. Journal of Geophysical Research: Oceans, 101(C5): 12315-12330.
DOI:10.1029/95JC03204 |
Qu T D, Du Y, Meyers G, Ishida A, Wang D X. 2005. Connecting the tropical Pacific with Indian Ocean through South China Sea. Geophysical Research Letters, 32(24): L24609.
DOI:10.1029/2005GL024698 |
Qu T D, Kim Y Y, Yaremchuk M, Tozuka T, Ishida A, Yamagata T. 2004. Can Luzon Strait transport play a role in conveying the impact of ENSO to the South China Sea?. Journal of Climate, 17(18): 3644-3657.
DOI:10.1175/1520-0442(2004)017<3644:CLSTPA>2.0.CO;2 |
Qu T D, Mitsudera H, Yamagata T. 2000. Intrusion of the North Pacific waters into the South China Sea. Journal of Geophysical Research: Oceans, 105(C3): 6415-6424.
DOI:10.1029/1999JC900323 |
Rao R R, Sivakumar R. 2003. Seasonal variability of sea surface salinity and salt budget of the mixed layer of the north Indian Ocean. Journal of Geophysical Research: Oceans, 108(C1): 3009.
DOI:10.1029/2001JC000907 |
Ren L, Speer K, Chassignet E P. 2011. The mixed layer salinity budget and sea ice in the Southern Ocean. Journal of Geophysical Research: Oceans, 116(C8): C08031.
DOI:10.1029/2010JC006634 |
Schmitt R W. 2008. Salinity and the global water cycle. Oceanography, 21(1): 12-19.
DOI:10.5670/oceanog.2008.63 |
Shaw P T, Chao S Y. 1994. Surface circulation in the South China Sea. Deep Sea Research Part I: Oceanographic Research Papers, 41(11-12): 1663-1683.
DOI:10.1016/0967-0637(94)90067-1 |
Singh A, Delcroix T. 2011. Estimating the effects of ENSO upon the observed freshening trends of the western tropical Pacific Ocean. Geophysical Research Letters, 38(21): L21607.
DOI:10.1029/2011GL049636 |
Skliris N, Marsh R, Josey S A, Good S A, Liu C L, Allan R P. 2014. Salinity changes in the World Ocean since 1950 in relation to changing surface freshwater fluxes. Climate Dynamics, 43(3-4): 709-736.
DOI:10.1007/s00382-014-2131-7 |
Skliris N, Zika J D, Nurser G, Josey S A, Marsh R. 2016. Global water cycle amplifying at less than the Clausius-Clapeyron rate. Scientific Reports, 6: 38752.
DOI:10.1038/srep38752 |
Song W, Lan J, Liu Q Y, Sui D D, Zeng L L, Wang D X. 2014. Decadal variability of heat content in the South China Sea inferred from observation data and an ocean data assimilation product. Ocean Science, 10(1): 135-139.
DOI:10.5194/os-10-135-2014 |
Suga T, Kato A, Hanawa K. 2000. North Pacific Tropical Water: its climatology and temporal changes associated with the climate regime shift in the 1970s. Progress in Oceanography, 47(2-4): 223-256.
DOI:10.1016/S0079-6611(00)00037-9 |
Thompson B, Tkalich P, Malanotte-Rizzoli P. 2017. Regime shift of the South China Sea SST in the late 1990s. Climate Dynamics, 48(5-6): 1873-1882.
DOI:10.1007/s00382-016-3178-4 |
Wang C Z, Wang W Q, Wang D X, Wang Q. 2006a. Interannual variability of the South China Sea associated with El Niño. Journal of Geophysical Research: Oceans, 111(C3): C03023.
DOI:10.1029/2005JC003333 |
Wang D X, Liu Q Y, Huang R X, Du Y, Qu T D. 2006b. Interannual variability of the South China Sea throughflow inferred from wind data and an ocean data assimilation product. Geophysical Research Letters, 33(14): L14605.
DOI:10.1029/2006GL026316 |
Williams P D, Guilyardi E, Sutton R T, Gregory J M, Madec G. 2007. A new feedback on climate change from the hydrological cycle. Geophysical Research Letters, 34(8): L08706.
DOI:10.1029/2007GL029275 |
Xiao F A, Zeng L L, Liu Q Y, Zhou W, Wang D X. 2018. Extreme subsurface warm events in the South China Sea during 1998/99 and 2006/07: observations and mechanisms. Climate Dynamics, 50(1-2): 115-128.
DOI:10.1007/s00382-017-3588-y |
Xu M, Chang C P, Fu C B, Qi Y, Robock A, Robinson D, Zhang H M. 2006. Steady decline of East Asian monsoon winds, 1969-2000: evidence from direct ground measurements of wind speed. Journal of Geophysical Research: Atmospheres, 111(D24): D24111.
DOI:10.1029/2006JD007337 |
Xue H J, Chai F, Pettigrew N, Xu D Y, Shi M C, Xu J P. 2004. Kuroshio intrusion and the circulation in the South China Sea. Journal of Geophysical Research: Oceans, 109(C2): C02017-10.1029/2002JC001724.
DOI:10.1029/2002JC001724 |
Yan Y F, Chassignet E P, Qi Y Q, Dewar W K. 2013. Freshening of subsurface waters in the northwest Pacific subtropical gyre: observations and dynamics. Journal of Physical Oceanography, 43(12): 2733-2751.
DOI:10.1175/JPO-D-13-03.1 |
Yan Y F, Xu D Z, Qi Y Q, Gan Z J. 2012. Observations of freshening in the northwest Pacific subtropical gyre near Luzon Strait. Atmosphere-Ocean, 50(sup 1): 92-102.
DOI:10.1080/07055900.2012.715078 |
Yang H Y, Wu L X. 2012. Trends of upper-layer circulation in the South China Sea during 1959-2008. Journal of Geophysical Research: Oceans, 117(C8): C08037.
DOI:10.1029/2012JC008068 |
Yang J Y, Lin X P, Wu D X. 2013. On the dynamics of the seasonal variation in the South China Sea throughflow transport. Journal of Geophysical Research: Oceans, 118(12): 6854-6866.
DOI:10.1002/2013JC009367 |
Yu K, Qu T D. 2013. Imprint of the Pacific Decadal Oscillation on the South China Sea throughflow variability. Journal of Climate, 26(24): 9797-9805.
DOI:10.1175/JCLI-D-12-00785.1 |
Yu L S, Jin X Z, Josey S A, Lee T, Kumar A, Wen C H, Xue Y. 2017. The global ocean water cycle in atmospheric reanalysis, satellite, and ocean salinity. Journal of Climate, 30(10): 3829-3852.
DOI:10.1175/JCLI-D-16-0479.1 |
Yu L S, Weller R A. 2007. Objectively analyzed air-sea heat fluxes for the global ice-free ocean (1981-2005). Bulletin of the American Meteorological Society, 88(4): 527-540.
DOI:10.1175/BAMS-88-4-527 |
Zeng L L, Chassignet E P, Schmitt R W, Xu X B, Wang D X. 2018. Salinification in the South China Sea since late 2012: a reversal of the freshening since the 1990s. Geophysical Research Letters, 45(6): 2744-2751.
DOI:10.1002/2017GL076574 |
Zeng L L, Chassignet E P, Xu X B, Wang D X. 2021. Multi-decadal changes in the South China Sea mixed layer salinity. Climate Dynamics, 57(1): 435-449.
DOI:10.1007/s00382-021-05711-1 |
Zeng L L, Liu W T, Xue H J, Xiu P, Wang D X. 2014. Freshening in the South China Sea during 2012 revealed by Aquarius and in situ data. Journal of Geophysical Research: Oceans, 119(12): 8296-8314.
DOI:10.1002/2014JC010108 |
Zeng L L, Wang D X, Chen J, Wang W Q, Chen R Y. 2016a. SCSPOD14, a South China Sea physical oceanographic dataset derived from in situ measurements during 1919-2014. Scientific Data, 3(1): 160029.
DOI:10.1038/sdata.2016.29 |
Zeng L L, Wang D X, Xiu P, Shu Y Q, Wang Q, Chen J. 2016b. Decadal variation and trends in subsurface salinity from 1960 to 2012 in the northern South China Sea. Geophysical Research Letters, 43(23): 12181-12189.
DOI:10.1002/2016GL071439 |
Zhang N N, Feng M, Du Y, Lan J, Wijffels S E. 2016. Seasonal and interannual variations of mixed layer salinity in the southeast tropical Indian Ocean. Journal of Geophysical Research: Oceans, 121(7): 4716-4731.
DOI:10.1002/2016JC011854 |
Zhang R H, Zheng F, Zhu J S, Pei Y H, Zheng Q A, Wang Z G. 2012. Modulation of El Niño-Southern Oscillation by freshwater flux and salinity variability in the tropical Pacific. Advances in Atmospheric Sciences, 29(4): 647-660.
DOI:10.1007/s00376-012-1235-4 |
Zhang Y, Feng M, Du Y, Phillips H E, Bindoff N L, McPhaden M J. 2018. Strengthened Indonesian Throughflow drives decadal warming in the southern Indian Ocean. Geophysical Research Letters, 45(12): 6167-6175.
DOI:10.1029/2018GL078265 |
Zhu J S, Huang B H, Zhang R H, Hu Z Z, Kumar A, Balmaseda M A, Marx L, Kinter J L III. 2014. Salinity anomaly as a trigger for ENSO events. Scientific Reports, 4: 6821.
DOI:10.1038/srep06821 |
Zhu J S, Kumar A, Wang W Q. 2020. Intraseasonal surface salinity variability and the MJO in a climate model. Geophysical Research Letters, 47(17): e2020GL088997-10.1029/2020GL088997.
DOI:10.1029/2020GL088997 |
Zhu Y H, Fang G H, Wei Z X, Wang Y G, Teng F, Qu T D. 2016. Seasonal variability of the meridional overturning circulation in the South China Sea and its connection with inter-ocean transport based on SODA2.2.4. Journal of Geophysical Research: Oceans, 121(5): 3090-3105.
DOI:10.1002/2015JC011443 |
Zhuang W, Xie S P, Wang D X, Taguchi B, Aiki H, Sasaki H. 2010. Intraseasonal variability in sea surface height over the South China Sea. Journal of Geophysical Research: Oceans, 115: C04010.
DOI:10.1029/2009JC005647 |