 2022, Vol. 40
Institute of Oceanology, Chinese Academy of Sciences
Article Information
- LI Zhao, LI Shuiqing, HOU Yijun, MO Dongxue, LI Jian, YIN Baoshu
- Typhoon-induced wind waves in the northern East China Sea during two typhoon events: the impact of wind field and wave-current interaction
- Journal of Oceanology and Limnology, 40(3): 934-949
- http://dx.doi.org/10.1007/s00343-021-1089-7
Article History
- Received Mar. 18, 2021
- accepted in principle Jun. 20, 2021
- accepted for publication Aug. 16, 2021


2 Laboratory for Ocean and Climate Dynamics, Pilot National Laboratory for Marine Science and Technology (Qingdao), Qingdao 266237, China;
3 University of Chinese Academy of Sciences, Beijing 100049, China;
4 Center for Ocean Mega-Science, Chinese Academy of Sciences, Qingdao 266071, China;
5 North China Sea Marine Forecasting Center of State Oceanic Administration, Qingdao 266061, China
Typhoon-induced surface waves are severe marine phenomena that can devastate sea dikes and farmland, destroy coastal fishing vessels and buildings, and injure and even kill human beings (Wang et al., 2019a; Xu et al., 2020). Therefore, it is necessary to accurately simulate and study typhoon waves for the early warning and prevention of marine disasters. At present, studies on typhoon waves rely mainly on numerical simulations, common models for which include mainly the Simulating Waves Nearshore (SWAN) model (Booij et al., 1999), the Wave Model (WAM) (The WAMDI Group, 1988), and the WAVEWATCH-Ⅲ (WW3) model (Tolman, 2009). In addition, the importance of the wave-current interaction (WCI) has recently been widely realized, and thus, some coupled models, including the Regional Ocean Model System (ROMS)+SWAN model (Kumar et al., 2015), Proudman Oceanographic Laboratory Coastal Ocean Modeling System (POLCOMS)+WAM model (Brown, 2010), and SWAN+Advanced Circulation (ADCIRC) model (Dietrich et al., 2011), have been developed to account for the WCI effect.
Wind is the dominant forcing for wind waves under typhoon conditions; thus, the accuracy of the wind field is a key factor in the numerical simulation of typhoon-induced surface waves. The European Centre for Medium-Range Weather Forecasts (ECMWF) and National Centers for Environmental Prediction (NCEP) provide the two most commonly used global wind datasets in wave simulations. For example, Hong et al. (2018) studied the simulation of typhoon waves with NCEP Climate Forecast System Reanalysis (CFSR) wind data under the typhoon conditions of Typhoon Bolaven in 2012. More recently, Xu et al. (2020) used Cross-Calibrated Multi-Platform (CCMP) wind product to reproduce the waves during Typhoon Chan-hom in 2015. Chen et al. (2019a) evaluated the typhoon wave simulation effect using ECMWF Interim Reanalysis (ERA-Interim), CFSR and CrossCalibrated Multi-Platform Version 2 (CCMPv2) wind resources and found that the simulated significant wave height (SWH) of CFSR was higher than those of ERA-Interim and CCMPv2. Hsiao et al. (2019) examined three typhoon processes in 2016 using the fifth-generation ECMWF Reanalysis (ERA5), Climate Forecast System Version 2 (CFSv2), and ERA-Interim wind fields, and found that both ERA5 and CFSv2 reliably reproduced the wave heights during Typhoon Malakas and Typhoon Megi, while ERA5 underestimated and CFSv2 overestimated the SWH during Typhoon Meranti. In addition, ERA-Interim exhibited a substantially worse simulation effect of the SWH during the three typhoons than did ERA5 and CFSv2. In a general wave simulation, van Vledder and Akpınar (2015) simulated waves by implementing six wind fields, namely, Japanese 25-year Reanalysis (JRA-25), CFSR, ECMWF 40-year reanalysis (ERA40), ERA-Interim, ECMWF operational data, and National Aeronautics and Space Administration (NASA) Modern-Era Retrospective Analysis for Research and Applications (MERRA), and found that the CFSR wind field was better than the other wind fields in the Black Sea. Furthermore, Wu et al. (2020a) showed a comparison among the NCEP Final Operational Global Analysis Data (FNL), NCEP Department of Energy Reanalysis Version 2 (NCEP2), CCMPv2, MERRA Version 2 (MERRA-2), ERAInterim, and Japanese 55-year Reanalysis (JRA-55) wind resources, and demonstrated that ERA5 wind data showed the best performance for simulating waves in coastal areas.
The wave-current interaction (WCI) and its influence on waves under typhoon conditions have attracted considerable interest in recent years (Hong et al., 2018; Chen et al., 2019b; Prakash and Pant, 2020). The SWH of typhoon waves is significantly affected by variations in both the water level and the surface current (Yu et al., 2017; Chen et al., 2019b). An increase (decrease) in the water level (water depth) results in an increase (decrease) in the wave height in shallow waters by reducing (enhancing) bottom dissipation (Liu and Xie, 2009). Moreover, variations in the propagation directions between the current and waves can affect wave growth and lead to changes in the SWH (Fan et al., 2009; Warner et al., 2010; Benetazzo et al., 2013; Liu et al., 2016; Wu et al., 2020b; Yang et al; 2020). Overall, the influence of the current on the wave field depends on the Doppler shift, the shoaling effect, wave refraction, wave breaking, wave advection, and the relative wind effect induced by the current (Fan et al., 2009; Ardhuin et al., 2012; Wang and Sheng, 2016; Hegermiller et al., 2019).
The northern East China Sea (NECS), comprising the Bohai Sea and Yellow Sea, is a marginal sea located in the northwestern Pacific Ocean. Because coastal areas are often affected by typhoon waves and suffer devastating losses, in this study, we examined the influences of the wind field and WCI on typhooninduced wind waves in the NECS based on a comparison of two wind reanalysis datasets (ERA5 and CFSv2) and by performing a coupling analysis using the SWAN+ADCIRC model, in which the classic paths of two typhoons, namely, Typhoon Lekima and Typhoon Muifa, were considered. The framework of this paper is as follows. The numerical models are introduced in Section 2. Section 3 describes the data, research area, and model configuration. Section 4 assesses the wind products and SWH simulation results. Section 5 is accompanied by a discussion, and the conclusion is given in Section 6.
2 NUMERICAL MODEL 2.1 SWAN modelThe SWAN model is a third-generation wave numerical model developed by Delft University of Technology in the Netherlands (Booij et al., 1999; The SWAN Team, 2020a). The main governing equation is
 (1)
(1)where t denotes time; (x, y) represent the Cartesian coordinates; (cx, cy) and (cσ, cθ) represent the propagation velocity of the dynamic spectrum energy density N in the spaces of (x, y) and (σ, θ), respectively; θ is the direction of propagation; and σ is the relative frequency. S on the right side of the equation represents the wave energy source and sink term, which can be written as
 (2)
(2)where Sin represents the energy input by wind; Sds represents wave energy dissipation, which is composed of the whitecapping effect Sds, w, bottom friction Sds, b, and depth-induced breaking Sds, br; and Snl signifies the nonlinear wave-wave interaction, which includes the nonlinear quadruplet wave-wave interactions (Snl4) and the nonlinear triad wave-wave interactions (Snl3). Snl4 dominates the development of the wave spectrum in deep water, which can transfer the wave energy from the peak frequency to the lower frequency or the higher frequency; Snl3 plays an important role in shallow water and transfers the wave energy from the low frequency to the high frequency (the SWAN Team, 2020b).
2.2 ADCIRC modelLuettich and Westerink jointly developed the ADCIRC hydrodynamic model (Luettich and Westerink, 2016). The main formulas of the model are as follows:
 (3)
(3) (4)
(4) (5)
(5)where (x, y) represent the Cartesian coordinates, t denotes time, H=h+ξ represents the total water level, h is the water depth, ξ is the water level calculated from the average sea level, (U, V) represent the current velocities, f represents the Coriolis parameter, g is the acceleration due to gravity, Ps is the free-surface atmospheric pressure, ρ0 is the water reference density, α is the effective earth elasticity factor, η represents the Newtonian equilibrium tidal potential, (Mx, My) denote the lateral stress gradients, (Dx, Dy) are the dispersion terms of the momentum, (Bx, By) are the vertically integrated baroclinic pressure gradients, (τsx, τsy) are the externally forced surface stresses, and (τbx, τby) are the bottom stresses (Westerink et al., 2008; Park and Suh, 2012; Wang et al., 2020).
2.3 SWAN+ADCIRC modelThe coupled SWAN+ADCIRC model is widely used to study typhoon waves (Yu et al., 2017; Wang et al., 2019b; Yin et al., 2020). SWAN and ADCIRC perform operations in series by sharing the same unstructured grids, and they rely on information produced by themselves to drive each other. The main physical mechanism responsible for the coupled calculation between ADCIRC and SWAN is as follows: at the vertices of the grids, ADCIRC provides the calculated currents, calculated wind speeds and calculated water levels to SWAN, while SWAN keeps the radiation stress gradients as the external forces transmitted to ADCIRC. All processes are performed until the coupled calculation is complete (Dietrich et al., 2011; Bhaskaran et al., 2013; Wang et al., 2020).
3 MATERIAL AND METHOD 3.1 Typhoon informationThe typhoon tracks in the NECS can be classified into two types, as indicated in Li et al. (2020). Here, we selected Typhoon Lekima and Typhoon Muifa, which are representative of these two types of typhoon tracks (Li et al., 2021). The specific typhoon track information can be obtained from Fig. 1a. According to the China Meteorological Administration (CMA, http://www.cma.gov.cn), Typhoon Lekima made landfall before it entered the NECS in Wenling (Zhejiang Province, China) with a maximum wind speed of 52 m/s at 1:45 (UTC+8) on August 10, 2019, and then it moved along the coast toward the north. In contrast, Typhoon Muifa was generated in the northwestern Pacific, and it passed through the NECS before finally making landfall on the coast of North Korea with a maximum wind speed of 23 m/s at 18:30 (UTC+8) on August 8, 2011. The typhoon waves, floods, and storm surges caused by the two typhoons caused serious disasters and losses along the coast of the NECS.

|
| Fig.1 Storm tracks and the study area (a), mesh of the computational domain (b), and spatial distribution of the water depth and its isopleth in most coastal areas of the NECS (c) In (a), black dots represent buoy stations. Red curve is the track of Typhoon Lekima, and blue curve is the track of Typhoon Muifa. Red and blue dots show the locations of the typhoon centers (every 1 day). |
ERA5 is the fifth generation reanalysis product of the global climate provided by ECMWF with a temporal coverage from 1979 to the present. From among the ERA5 products, we select the hourly horizontal wind at a height of 10 m above the sea surface and the hourly SWH with a spatial resolution of 0.25° (https://cds.climate.copernicus.eu/cdsapp#!/home; see Hersbach et al., 2018).
CFSv2 originates from the Climate Forecast System Version 2 created by the NCEP. CFSv2 possesses hourly wind data from 2011 to the present. We choose the horizontal wind at a height of 10 m above the sea surface with a temporal resolution of 1 h and a spatial resolution of 0.20° (https://rda.ucar.edu/datasets/ds094.1/; Saha et al., 2011).
3.3 Simulation area and model configurationFigure 1a shows the buoy locations, water depth in the computational domain, and the central tracks of Typhoon Lekima and Typhoon Muifa. Figure 1c gives the water depth isopleth in most coastal areas of the NECS. The bathymetry data are obtained from the General Bathymetric Chart of the Oceans (GEBCO, https://www.gebco.net/) with a resolution of 15 arcseconds. The central track data are derived from the CMA typhoon database (http://tcdata.typhoon.org.cn/; Ying et al., 2014; Lu et al., 2021). The simulation of the Lekima typhoon wave ranges from 0:00 (UTC) on August 9 to 00:00 (UTC) on August 14, 2019, and the simulation of the Muifa typhoon wave ranges from 0:00 (UTC) on August 5 to 00:00 (UTC) on August 10, 2011. The computational domain of the mesh ranges from 26.5°N–41.5°N, 117.5°E–129.5°E, and the coastlines are provided by U.S. National Oceanic and Atmospheric Administration (NOAA, https://www.ngdc.noaa.gov/). The unstructured triangular mesh is generated by Surface Water Modeling System (SMS) software possessing 123 899 triangular elements and 64 307 nodes. The resolution of the mesh ranges from 100 m in the nearshore region to 20 km at the open boundary (Fig. 1b).
For the parameters of the SWAN model, the frequency range of spectrum space is set from 0.03 Hz to 1.0 Hz, and the directional resolution of the spectral space varying from 0° to 360° is 10°. The time steps of the calculated time and the output result are both set to 60 min. The computation uses the backward space backward time (BSBT) scheme. The mode activates the wind input, the whitecapping effect, the depth-induced wave breaking, the bottom friction dissipation, the triad wave-wave interactions, and the quadrant wave-wave interactions. As for the ADCIRC model, the mode uses the cold-start technique; the initial water level and current velocity at all grid points are set to 0, and the corresponding time step is 1 s. At the open boundary of the ADCIRC model, eight tide constituents (O1, Q1, S2, K2, M2, K1, N2, and P1) obtained from Oregon State University Tidal Prediction Software (OTPS) are applied (Egbert et al., 1994). The data exchange time between the ADCIRC model and the SWAN model and the output step of simulation results are both 60 min.
3.4 Error metricsTo assess the simulation quality, five error metrics were used when matching the wind speed or SWH data with buoy data. These parameters, including the root mean square error (RMSE), scatter index (SI), correlation coefficient (CC), mean absolute error (MAE), and maximum error (MAXE), are as follows:
 (6)
(6) (7)
(7) (8)
(8)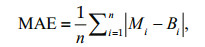 (9)
(9) (10)
(10)where B represents the buoy observation data and M represents the wind data or the results of the model output.
For the wind direction should be evaluated by the direction error indexes RMSEθ and MAEθ (van Vledder and Akpınar, 2015).
 (11)
(11) (12)
(12) (13)
(13)where θ1 represents the wind direction data of ERA5 or CFSv2, θ2 represents the wind direction data from buoy observation, and Δ is the shortest directional distance.
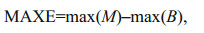
4 RESULT 4.1 Test on the wind dataComparisons of the wind speed are shown in Fig. 2 and Table 1. The wind speeds of ERA5 and CFSv2 were generally consistent with the measured data from the three buoy stations. Overall, ERA5 agreed better than CFSv2 with the buoy measurements, with smaller values of the MAE, RMSE, and SI at most buoys. Moreover, the peak wind speed of ERA5 was generally lower than that of CFSv2.

|
| Fig.2 Comparisons of the wind speed at buoy stations QF101 (a, d), QF104 (b, e), and QF114 (c, f) during Typhoons Lekima and Muifa The buoy measurement data is defined as Obs. |
Figure 3 shows comparisons of the wind directions. ERA5 and CFSv2 both effectively reproduced the variations in the buoy-observed wind directions. The error analysis of the wind directions (Table 2) does not support the superiority of any wind field because the metrics (MAEθ and RMSEθ) of the two wind fields differ only slightly.

|
| Fig.3 Comparisons of the wind direction at buoy stations QF101 (a, d), QF104 (b, e) and QF114 (c, f) during Typhoons Lekima and Muifa The buoy measurement data is defined as Obs, and the QF114 buoy lacks wind direction observation data for Typhoon Lekima. |

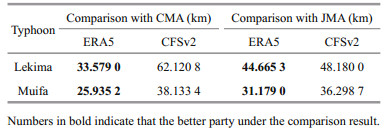
Storm tracks are known to have a significant effect on the spatial distribution of wind waves (Du et al., 2020; Hu et al., 2020). Figure 4 shows the simulated tracks of the two typhoons using the ERA5 and CFSv2 wind products in the NECS, and Table 3 shows the mean distance deviation of the central tracks compared to the best track data from the CMA and Japan Meteorological Agency (JMA, http://www.jma.go.jp). The time period of Typhoon Lekima was from 0:00 (UTC) on August 10 to 00:00 (UTC) on August 13, 2019, and that of Typhoon Muifa was from 00:00 (UTC) on August 6 to 00:00 (UTC) on August 9, 2011. All the data were used with a 6-h interval. The comparisons indicate that both ERA5 and CFSv2 agreed well with the best track data, while ERA5 performed better with a smaller mean distance deviation.

|
| Fig.4 Comparisons of the central tracks of Typhoon Lekima (a) and Typhoon Muifa (b) |
|
In summary, both ERA5 and CFSv2 effectively reproduced the typhoon wind fields, and ERA5 performed better than CFSv2 in the simulation of the wind speeds and typhoon tracks.
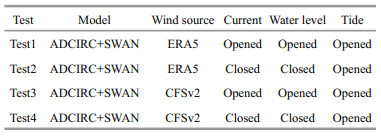
4.2 Analysis of the wave simulation 4.2.1 Comparison with buoy measurementsTo examine the influences of wind fields and the WCI on the wave simulation, four sensitivity tests were performed, as shown in Table 4. At the same time, the accuracy of the SWH data directly provided by the official ERA5 website (ERA5P) was also tested. The results of the comparison between the SWH during Typhoon Lekima and Typhoon Muifa at the three buoy stations are shown in Fig. 5 and Table 5.

|
| Fig.5 Comparisons of the SWH at buoy stations QF101 (a, d), QF104 (b, e), and QF114 (c, f) during Typhoons Lekima and Muifa The buoy measurement data is defined as Obs. |
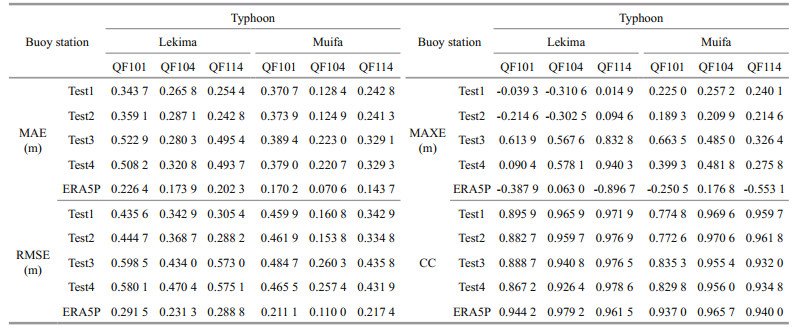
The differences in the SWH between the two wind fields are obvious. For the two typhoons, comparing Test1 (Test2) with Test3 (Test4) at most buoy stations considering the MAE, RMSE, MAXE, and CC, the simulated SWH using ERA5 was closer to the buoy observations than the simulated SWH using CFSv2, and the peak simulated SWH using CFSv2 was significantly overestimated. The comparison results are quite similar to those of the wind speed, which is expected because the error in the wind model can be transferred to the simulated SWH (Teixeira et al., 1995; van Vledder and Akpınar, 2015).
The effect of the WCI tended to increase the peak SWH but was not significant except when CFSv2 was applied at QF101 during the two typhoons. This disparity is attributed to the fact that the WCI effect in nearshore areas results mainly from water level variations, and the water depth at buoy QF101 (water depth: 9.089 2 m) was less than that at buoy QF104 (water depth: 17.848 5 m) and at buoy QF114 (water depth: 27.980 7 m). In general, the influences generated by different wind fields on the peak SWH was much larger than the influence of the WCI on the peak SWH.
ERA5 also contained SWH data, which were simulated using WAM without considering the WCI effect (ECMWF, 2020; Fairley et al., 2020). The results indicate that the SWH data directly provided by the official ERA5 website (ERA5P) agreed well with the buoy data at QF104 but tended to significantly underestimate the peak SWH at QF101 and QF114. In general, the peak values of ERA5P are lower than the coupled model results, but the coupling effect is too small to account for the smaller values in ERA5P. Nevertheless, the WAM configuration can result in lower SWH peaks in the NECS than the SWAN configuration, as demonstrated by Wang et al. (2019a), and this difference is very likely to account for the lower peak values in ERA5P.
4.2.2 Spatial differences of the wave fieldsFigure 6 shows the spatial variations in the maximum SWH from different wind fields. For Typhoon Lekima and Typhoon Muifa, the waves were higher on the right side of the typhoon track (Fig. 6a–b, d–e) due to the asymmetry of the typhoon wind fields and the extended fetch phenomenon (Moon et al., 2003; Chen et al., 2010; Collins et al., 2018; Hegermiller et al., 2019). The influences of the different wind fields on waves were remarkable; for instance, compared with the ERA5 simulated waves, the CFSv2 simulated waves were generally stronger (Fig. 6c & f). Moreover, the maximum positive difference in the maximum SWH between CFSv2 and ERA5 reached 5.882 5 m during Typhoon Lekima and 4.244 6 m during Typhoon Muifa.

|
| Fig.6 Spatial distributions of the maximum SWH (unit: m) in Test1 (a, d) and Test3 (b, e) and their difference (the maximum SWH of Test3 minus the maximum SWH of Test1) (c, f) during Typhoons Lekima and Muifa The red curve represents the CMA track of Typhoon Lekima, and the blue curve represents the CMA track of Typhoon Muifa. |
The effects of the WCI during the two typhoon events are illustrated in Fig. 7. Similar results were obtained when the two wind fields were used. Along the coastal regions of the NECS, the SWH increased in the coupled model results, mainly due to the variation in the water depth induced by the tide (Song et al., 2020). In deep and offshore waters, the SWH on the right side of the Typhoon Muifa track was suppressed by the WCI effect (Fig. 7c–d), which is consistent with the findings of previous studies (Wang and Sheng, 2016; Hong et al., 2018), because the WCI effect was strengthened in offshore deep water with a strong sea state and the current dominated the SWH modulation (Song et al., 2020). The negative and positive differences in the maximum SWH caused by the WCI effect ranged from -1.215 3 m to 1.616 4 m during the two typhoons. Moreover, the difference in the wave height was negligible in the sea area far from the typhoon track, indicating that the influence of the WCI on the SWH was weak at these distances.

|
| Fig.7 Spatial differences in the maximum SWH (unit: m) between Test1 and Test2 (the maximum SWH of Test1 minus the maximum SWH of Test2) (a, c), and between Test3 and Test4 (the maximum SWH of Test3 minus the maximum SWH of Test4) (b, d) during Typhoons Lekima and Muifa The red curve represents the CMA track of Typhoon Lekima, and the blue curve represents the CMA track of Typhoon Muifa. |
We compared the spatial distributions of the wave direction and the current direction with the SWH differences between Test1 and Test2 in Fig. 8. We found that, in most offshore areas where the WCI was prominent, the SWH decreased if the wave direction was consistent with the current direction or their included angle was an acute angle; in contrast, the SWH increased if the waves and current propagated in opposite directions or if their included angle was an obtuse angle; finally, the change in the SWH seemed to be negligible if the wave direction was perpendicular to the current direction. This phenomenon can be explained by the conservation of wave action. Namely, current flowing in the opposite (same) direction resulted in an increase (decrease) in wave spectral energy or a decrease (increase) in wavelength, which was followed by an increase (decrease) in SWH (Wolf and Prandle, 1999; Benetazzo et al., 2013; Hong et al., 2018; Song et al., 2020; Yang et al., 2020). This result has been supported by many researchers (Fan et al., 2009; Warner et al., 2010; Liu et al., 2016; Wu et al., 2020b).

|
| Fig.8 Spatial distributions of the differences in the SWH (unit: m) between Test1 and Test2 (the SWH of Test1 minus the SWH of Test2) on different days and time a. 20:00 UTC, August 10, 2019; b. 08:00 UTC, August 11, 2019; c. 20:00 UTC, August 11, 2019 during Typhoon Lekima (upper panel); d. 00:00 UTC, August 7, 2011; e. 12:00 UTC, August 7, 2011; f. 00:00 UTC August 8, 2011 during Typhoon Muifa (lower panel). Red arrows: the wave direction; black arrows: the current direction; red curve: the track of Typhoon Lekima determined by ERA5; blue curve: the track of Typhoon Muifa determined by ERA5; green pentagram: the typhoons center at the moment. |
The wind reanalysis datasets have been frequently used as the wind-driven source in the modeling study of typhoon waves. The differences in the spatial distributions of the wind fields between ERA5 and CFSv2 are not negligible because they are based on different reanalysis techniques and ensemble forecast models. In the study area, the two wind reanalysis datasets have quite similar spatial distributions, which result in similar spatial distributions of wave height, while the CFSv2 wind field predicts a stronger typhoon wind intensity than that of the ERA5 wind field (Fig. 9), and the simulated maximum wave heights from the CFSv2 wind field can be 3–6 m larger than those from the ERA5 wind field (Fig. 6). The high sensitivity highlights the importance of the wind field in the hindcast of typhoon waves. It is also noted that the differences in wave heights induced by the wind fields are almost negligible in nearshore regions (water depths shallower than 20 m), which is attributed to the facts that the topography effect dominates in nearshore regions and that the winds play a secondary role (Figs. 1c & 6).

|
| Fig.9 Spatial distributions of the maximum wind speed (unit: m/s) in Test1 (a, d) and Test3 (b, e) and their difference (the maximum wind speed of Test3 minus the maximum wind speed of Test1) (c, f) during Typhoons Lekima and Muifa Red curve: the CMA track of Typhoon Lekima; blue curve: the CMA track of Typhoon Muifa. |
Despite the significant difference in SWH induced by the two wind fields, the spatial distributions of the WCI are quite similar between the two wind reanalysis datasets (Figs. 7 & 9), indicating that the sensitivity of the WCI effect to the wind data is much weaker than that of the wave height simulation results to the wind data. Moreover, despite the different tracks, the WCI effects in nearshore regions are prominently positive, and this is attributed to the increased water depth or level induced by the storm tide, which reduces the depth-induced wave dissipation, while the current advection effect plays only a secondary role. In the far deep offshore regions where the water depth effect disappears, the current advection effect tends to suppress the wave heights on the right hand side of the typhoon tracks.
6 CONCLUSIONThe SWAN+ADCIRC model was used to evaluate both the influence of the wind field on typhoon waves by applying two widely used wind products and the influence of the WCI on typhoon waves using designed coupled experiments in the NECS during Typhoons Lekima and Muifa. The main conclusions are as follows:
Both wind products can reliably model the two typhoon wave processes. However, the CFSv2 wind speed and its simulated SWH are generally overestimated, while the ERA5 wind speed and its simulated typhoon track with SWH are superior to those of the CFSv2 dataset, although the wave data provided by ERA5 generally underestimate the peak SWH in comparison with the in-situ buoy observations. In addition, when considering the spatial variations in the wave fields of the two typhoons, the CFSv2 simulated waves are usually stronger than the ERA5 simulated waves.
The WCI effects are similar when the two wind fields are applied. The difference in WCI caused by the two wind fields is detected mainly near the typhoon track. The influence of the coupled current and water level causes the maximum SWH to vary between -1.215 3 m and 1.616 4 m during the two typhoon events. The WCI effect enhances the SWH during the two typhoons in the coastal areas of the NECS, which is a consequence of the dominance of the water depth (level) on the nearshore SWH. On the right side of the Typhoon Muifa track, the WCI effect significantly reduces the SWH in the offshore deep areas.
7 DATA AVAILABILITY STATEMENTThe datasets generated and/or analyzed during the current study are available from the corresponding author on reasonable request.
8 ACKNOWLEDGMENTThis study gained supported from the Oceanographic Data Center, Institute of Oceanography, Chinese Academy of Sciences (IOCAS). The authors are grateful to the contributions from the ADCIRC+SWAN model developed by the ADCIRC development team. Many thanks are given to the High Performance Computing Center, IOCAS, for providing technical support, and the Oceanographic Data Center, Chinese Academy of Sciences (CASODC) (http://msdc.qdio.ac.cn), for the data service. Moreover, the data materials from ECMWF ERA5, NCEP CFSv2, GEBCO, CMA, and JMA are also very much appreciated.
Ardhuin F, Roland A, Dumas F, Bennis A C, Sentchev A, Forget P, Wolf J, Girard F, Osuna P, Benoit M. 2012. Numerical wave modeling in conditions with strong currents: dissipation, refraction, and relative wind. Journal of Physical Oceanography, 42(12): 2101-2120.
DOI:10.1175/JPO-D-11-0220.1 |
Benetazzo A, Carniel S, Sclavo M, Bergamasco A. 2013. Wave-current interaction: effect on the wave field in a semi-enclosed basin. Ocean Modelling, 70: 152-165.
DOI:10.1016/j.ocemod.2012.12.009 |
Bhaskaran P K, Nayak S, Bonthu S R, Murty P L N, Sen D. 2013. Performance and validation of a coupled parallel ADCIRC-SWAN model for THANE cyclone in the Bay of Bengal. Environmental Fluid Mechanics, 13(6): 601-623.
DOI:10.1007/s10652-013-9284-5 |
Booij N, Ris R C, Holthuijsen L H. 1999. A third-generation wave model for coastal regions: 1. Model description and validation. Journal of Geophysical Research: Oceans, 104(C4): 7649-7666.
DOI:10.1029/98JC02622 |
Brown J M. 2010. A case study of combined wave and water levels under storm conditions using WAM and SWAN in a shallow water application. Ocean Modelling, 35(3): 215-229.
DOI:10.1016/j.ocemod.2010.07.009 |
Chen Q, Hu K L, Kennedy A. 2010. Numerical modeling of observed hurricane waves in deep and shallow waters. In: Proceedings of the 32nd International Conference on Coastal Engineering. ASCE, Shanghai, China.
|
Chen W B, Chen H, Hsiao S C, Chang C H, Lin L Y. 2019a. Wind forcing effect on hindcasting of typhoon-driven extreme waves. Ocean Engineering, 188: 106260.
DOI:10.1016/j.oceaneng.2019.106260 |
Chen Y R, Chen L H, Zhang H, Gong W P. 2019b. Effects of wave-current interaction on the Pearl River Estuary during Typhoon Hato. Estuarine, Coastal and Shelf Science, 228: 106364.
DOI:10.1016/j.ecss.2019.106364 |
Collins C O, Potter H, Lund B, Tamura H, Graber H C. 2018. Directional wave spectra observed during intense tropical cyclones. Journal of Geophysical Research: Oceans, 123(2): 773-793.
DOI:10.1002/2017JC012943 |
Dietrich J C, Zijlema M, Westerink J J, Holthuijsen L H, Dawson C, Luettich R A Jr, Jensen R E, Smith J M, Stelling G S, Stone G W. 2011. Modeling hurricane waves and storm surge using integrally-coupled, scalable computations. Coastal Engineering, 58(1): 45-65.
DOI:10.1016/j.coastaleng.2010.08.001 |
Du M, Hou Y J, Qi P, Wang K. 2020. The impact of different historical typhoon tracks on storm surge: a case study of Zhejiang, China. Journal of Marine Systems, 206: 103318.
DOI:10.1016/j.jmarsys.2020.103318 |
ECMWF. 2020. IFS Documentation Cy47r1 - Part Ⅶ: ECMWF Wave Model. ECMWF. https://www.ecmwf.int/node/19751.
|
Egbert G D, Bennett A F, Foreman M G G. 1994. TOPEX/ POSEIDON tides estimated using a global inverse model. Journal of Geophysical Research: Oceans, 99(C12): 24821-24852.
DOI:10.1029/94JC01894 |
Fairley I, Lewis M, Robertson B, Hemer M, Masters I, Horrillo-Caraballo J, Karunarathna H, Reeve D E. 2020. A classification system for global wave energy resources based on multivariate clustering. Applied Energy, 262: 114515.
DOI:10.1016/j.apenergy.2020.114515 |
Fan Y L, Ginis I, Hara T. 2009. The effect of wind-wave-current interaction on air-sea momentum fluxes and ocean response in tropical cyclones. Journal of Physical Oceanography, 39(4): 1019-1034.
DOI:10.1175/2008JPO4066.1 |
Hegermiller C A, Warner J C, Olabarrieta M, Sherwood C R. 2019. Wave-current interaction between hurricane Matthew wave fields and the Gulf Stream. Journal of Physical Oceanography, 49(11): 2883-2900.
DOI:10.1175/JPO-D-19-0124.1 |
Hersbach H, Bell B, Berrisford P, Biavati G, Horányi A, Muñoz Sabater J, Nicolas J, Peubey C, Radu R, Rozum I, Schepers D, Simmons A, Soci C, Dee D, Thépaut J N. 2018. ERA5 hourly data on single levels from 1979 to present. Copernicus Climate Change Service (C3S) Climate Data Store (CDS), https://doi.org/10.24381/cds.adbb2d47. Accessed on November 9, 2020.
|
Hong J S, Moon J H, Kim T, Lee J H. 2018. Impact of ocean-wave coupling on typhoon-induced waves and surge levels around the Korean Peninsula: a case study of Typhoon Bolaven. Ocean Dynamics, 68(11): 1543-1557.
DOI:10.1007/s10236-018-1218-9 |
Hsiao S C, Chen H, Chen W B, Chang C H, Lin L Y. 2019. Quantifying the contribution of nonlinear interactions to storm tide simulations during a super typhoon event. Ocean Engineering, 194: 106661.
DOI:10.1016/j.oceaneng.2019.106661 |
Hu Y Y, Shao W Z, Wei Y L, Zuo J C. 2020. Analysis of typhoon-induced waves along typhoon tracks in the western North Pacific Ocean, 1998-2017. Journal of Marine Science and Engineering, 8(7): 521.
DOI:10.3390/jmse8070521 |
Kumar N, Feddersen F, Uchiyama Y, McWilliams J, O'Reilly W. 2015. Midshelf to surfzone coupled ROMS-SWAN model data comparison of waves, currents, and temperature: diagnosis of subtidal forcings and response. Journal of Physical Oceanography, 45(6): 1464-1490.
DOI:10.1175/JPO-D-14-0151.1 |
Li S Q, Jiang H Y, Hou Y J, Wang N, Lu J Y. 2020. Increasing historical tropical cyclone-induced extreme wave heights in the northern East China Sea during 1979 to 2018. Remote Sensing, 12(15): 2464.
DOI:10.3390/rs12152464 |
Li Z, Hou Y J, Li S Q, Li J. 2021. Characteristics of wave field in the Yellow Sea and the Bohai Sea under the influence of two typical typhoons. Oceanologia et Limnologia Sinica, 52(1): 51-65.
(in Chinese with English abstract) |
Liu H Q, Xie L. 2009. A numerical study on the effects of wave-current-surge interactions on the height and propagation of sea surface waves in Charleston Harbor during Hurricane Hugo 1989. Continental Shelf Research, 29(11-12): 1454-1463.
DOI:10.1016/j.csr.2009.03.013 |
Liu N, Li B X, Wang H, Lv H G. 2016. A study of the influence of wave-current interaction on significant wave height in the Northwestern Pacific. Haiyang Xuebao, 38(9): 21-31.
(in Chinese with English abstract) |
Lu X Q, Yu H, Ying M, Zhao B K, Zhang S, Lin L M, Bai L N, Wan R J. 2021. Western north pacific tropical cyclone database created by the china meteorological administration. Advances in Atmospheric Sciences, 38(4): 690-699.
DOI:10.1007/s00376-020-0211-7 |
Luettich R, Westerink J. 2016. A (parallel) advanced circulation model for oceanic, coastal and estuarine waters. Technical Report. https://adcirc.org/home/documentation/users-manual-v52/.
|
Moon I J, Ginis I, Hara T, Tolman H L, Wright C W, Walsh E J. 2003. Numerical simulation of sea surface directional wave spectra under hurricane wind forcing. Journal of Physical Oceanography, 33(8): 1680-1706.
DOI:10.1175/1520-0485(2003)033<1680:NSOSSD>2.0.CO;2 |
Park Y H, Suh K D. 2012. Variations of storm surge caused by shallow water depths and extreme tidal ranges. Ocean Engineering, 55: 44-51.
DOI:10.1016/j.oceaneng.2012.07.032 |
Prakash K R, Pant V. 2020. On the wave-current interaction during the passage of a tropical cyclone in the Bay of Bengal. Deep Sea Research Part II: Topical Studies in Oceanography, 172: 104658.
DOI:10.1016/j.dsr2.2019.104658 |
Saha S, Moorthi S, Wu X, Wang J, Nadiga S, Tripp P, Behringer D, Hou Y, Chuang H, Iredell M, Ek M, Meng J, Yang R, Mendez M P, van den Dool H, Zhang Q, Wang W, Chen M, Becker E. 2011. NCEP Climate Forecast System Version 2 (CFSv2) Selected Hourly Time-Series Products. Research Data Archive at the National Center for Atmospheric Research, Computational and Information Systems Laboratory, https://doi.org/10.5065/D6N877VB. Accessed on November 11, 2020.
|
Song H L, Kuang C P, Wang X H, Ma Z. 2020. Wave-current interactions during extreme weather conditions in southwest of Bohai Bay, China. Ocean Engineering, 216: 108068.
DOI:10.1016/j.oceaneng.2020.108068 |
Teixeira J C, Abreu M P, Soares C G. 1995. Uncertainty of ocean wave hindcasts due to wind modeling. Journal of Offshore Mechanics and Arctic Engineering, 117(4): 294-297.
DOI:10.1115/1.2827237 |
The SWAN Team. 2020a. SWAN user manual, SWAN Cycle Ⅲ version 41.31A. Delft University of Technology, Technical Report. http://www.swan.tudelft.nl.
|
The SWAN Team. 2020b. SWAN scientific and technical documentation, SWAN Cycle Ⅲ version 41. 31A. Delft University of Technology, Technical Report. http://www.swan.tudelft.nl.
|
The WAMDI Group. 1988. The WAM model-A third generation ocean wave prediction model. Journal of Physical Oceanography, 18(12): 1775-1810.
DOI:10.1175/1520-0485(1988)018<1775:TWMTGO>2.0.CO;2 |
Tolman H L. 2009. User manual and system documentation of WAVEWATCH IIITM version 3.14. Technical Note, MMAB Contribution No. 276.
|
Van Vledder G P, Akpınar A. 2015. Wave model predictions in the Black Sea: sensitivity to wind fields. Applied Ocean Research, 53: 161-178.
DOI:10.1016/j.apor.2015.08.006 |
Wang K, Hou Y J, Li S Q, Du M, Li R. 2020. Numerical study of storm surge inundation in the southwestern Hangzhou Bay region during Typhoon Chan-Hom in 2015. Journal of Ocean University of China, 19(2): 263-271.
DOI:10.1007/s11802-020-4258-y |
Wang N, Hou Y J, Li S Q, Li R. 2019a. Numerical simulation and preliminary analysis of typhoon waves during three typhoons in the Yellow Sea and East China Sea. Journal of Oceanology and Limnology, 37(6): 1805-1816.
DOI:10.1007/s00343-019-8260-4 |
Wang P C, Sheng J Y. 2016. A comparative study of wave-current interactions over the eastern Canadian shelf under severe weather conditions using a coupled wave-circulation model. Journal of Geophysical Research: Oceans, 121(7): 5252-5281.
DOI:10.1002/2016JC011758 |
Wang Y P, Liu Y L, Mao X Y, Chi Y T, Jiang W S. 2019b. Long-term variation of storm surge-associated waves in the Bohai Sea. Journal of Oceanology and Limnology, 37(6): 1868-1878.
DOI:10.1007/s00343-019-8257-z |
Warner J C, Armstrong B, He R Y, Zambon J B. 2010. Development of a coupled ocean-atmosphere-wave-sediment transport (COAWST) modeling system. Ocean Modelling, 35(3): 230-244.
DOI:10.1016/j.ocemod.2010.07.010 |
Westerink J J, Luettich R A, Feyen J C, Atkinson J H, Dawson C, Roberts H J, Powell M D, Dunion J P, Kubatko E J, Pourtaheri H. 2008. A basin-to channel-scale unstructured grid hurricane storm surge model applied to southern Louisiana. Monthly Weather Review, 136(3): 833-864.
DOI:10.1175/2007MWR1946.1 |
Wolf J, Prandle D. 1999. Some observations of wave-current interaction. Coastal Engineering, 37(3-4): 471-485.
DOI:10.1016/S0378-3839(99)00039-3 |
Wu W F, Li P L, Zhai F G, Gu Y Z, Liu Z Z. 2020a. Evaluation of different wind resources in simulating wave height for the Bohai, Yellow, and East China Seas (BYES) with SWAN model. Continental Shelf Research, 207: 104217.
DOI:10.1016/j.csr.2020.104217 |
Wu Z Y, Chen J, Jiang C B, Liu X J, Deng B, Qu K, He Z Y, Xie Z D. 2020b. Numerical investigation of Typhoon Kai-tak (1213) using a mesoscale coupled WRF-ROMS model—Part Ⅱ: Wave effects. Ocean Engineering, 196: 106805.
DOI:10.1016/j.oceaneng.2019.106805 |
Xu Y, Zhang J C, Xu Y, Ying W M, Wang Y P, Che Z M, Zhu Y. 2020. Analysis of the spatial and temporal sensitivities of key parameters in the SWAN model: an example using Chan-hom typhoon waves. Estuarine, Coastal and Shelf Science, 232: 106489.
DOI:10.1016/j.ecss.2019.106489 |
Yang J L, Jiang S C, Wu J S, Xie L L, Zhang S W, Bai P. 2020. Effects of wave-current interaction on the waves, cold-water mass and transport of diluted water in the Beibu Gulf. Acta Oceanologica Sinica, 39(1): 25-40.
DOI:10.1007/s13131-019-1529-9 |
Yin C, Huang H J, Wang D R, Liu Y X, Guo Z Y. 2020. The characteristics of storm wave behavior and its effect on cage culture using the ADCIRC+SWAN model in Houshui Bay, China. Journal of Ocean University of China, 19(2): 307-319.
DOI:10.1007/s11802-020-3941-3 |
Ying M, Zhang W, Yu H, Lu X Q, Feng J X, Fan Y X, Zhu Y T, Chen D Q. 2014. An overview of the China meteorological administration tropical cyclone database. Journal of Atmospheric and Oceanic Technology, 31(2): 287-301.
DOI:10.1175/JTECH-D-12-00119.1 |
Yu X L, Pan W R, Zheng X J, Zhou S J, Tao X Q. 2017. Effects of wave-current interaction on storm surge in the Taiwan Strait: insights from Typhoon Morakot. Continental Shelf Research, 146: 47-57.
DOI:10.1016/j.csr.2017.08.009 |