 2022, Vol. 40
Institute of Oceanology, Chinese Academy of Sciences
Article Information
- WANG Jie, BAI Xuezhi, LENG Hengling
- Examination of seasonal variation of the equatorial undercurrent termination in the Eastern Pacific diagnosed by ECCO2
- Journal of Oceanology and Limnology, 40(3): 870-890
- http://dx.doi.org/10.1007/s00343-021-0308-6
Article History
- Received Aug. 10, 2020
- accepted in principle Oct. 29, 2020
- accepted for publication May. 24, 2021


2 Key Laboratory of Marine Hazards Forecasting, Ministry of Natural Resources, Hohai University, Nanjing 210098, China
Termination of the equatorial undercurrent (EUC) upon reaching the west coast of South America in the Eastern Pacific is of great importance. The upwelled EUC water in the Eastern Pacific certainly influences the sea surface temperature (SST) in the Pacific cold tongue, thus it is important in the evolution of the El Nino-Southern Oscillation (ENSO). The study of EUC termination in the eastern equatorial Pacific is key to describing the subsurface equatorial currents. It is evident that the large transport of the EUC must play a major role in the mass balance of the Eastern Pacific, and important for the understanding of the interhemispheric exchange in the Eastern Pacific (Sloyan et al., 2003; Kessler, 2006). Also, the mean state and coupled variability of the tropical Pacific are strongly influenced by the interaction between the EUC and the Galapagos Islands (~91.5°W) (Karnauskas et al., 2010).
Several studies based on geostrophic flow estimates (Wyrtki, 1966; Bryden and Brady, 1985), Eulerian measurements (Knauss, 1959–1960; Wooster and Gilmartin, 1961; Lukas, 1986) and ocean general circulation models (Blanke and Raynaud, 1997; Sloyan et al., 2003; Montes et al., 2010) have been carried out to figure out the fate of EUC in the tropical Eastern Pacific. The basic picture is that only a small fraction of EUC water reaches the coast of central America due to the obstruction of the Galapagos Islands that is located near the equator (Fig. 1), and the rest becomes parts of the equatorial upwelling or recirculates into the westward South Equatorial Current (SEC) (Wyrtki, 1963, 1966; Lukas, 1986; Blanke and Raynaud, 1997; Strub et al., 1998; Montes et al., 2010). Based on the observations, Wyrtki (1963) and Strub et al. (1998) found that a part of the upper EUC water upwells into the SEC. Lukas (1986) showed some evidence of the recirculation of EUC water into the SEC. Wyrtki (1966) drew a schematic circulation, in which about 20 Sv (57%) of EUC water feeds the SEC upon approaching the Galapagos Islands. Using the OPA model (Laboratoire d'Oceanographie Dynamique et de Climatologie ocean GCM, referred to here as OPA) with a resolution of 0.75°×0.33° at the equator, Blanke and Raynaud (1997)'s simulation suggested that upon reaching the Galapagos Islands, most of the EUC water is injected in the surface layers (North Equatorial Current and SEC) with only little continuing its way to the coast of South America. Based on a regional eddy-resolving Regional Ocean Modeling System (ROMS) model at 1/9° resolution on a domain covering the eastern equatorial and Peruvian systems, Montes et al. (2010) also showed that most of the EUC water contributes to the westward flows, including the SEC and deeper flows.

|
| Fig.1 Map of the Galapagos Islands with annual mean circulation from the ECCO2 averaged over January 1992–December 2016 on the 25.5–26.0 isopycnal (kg/m3) |
The existence of the EUC to the east of the Galapagos (hereafter referred to as EUC_E) has already been confirmed by many studies (Knauss, 1959–1960; Karnauskas et al., 2010). White(1969, 1973) further stated that the EUC_E appears to be split into two branches on either side of the equator. The southern branch of EUC flow has been shown to contribute to the Peru-Chile Undercurrent (PCUC). Based on the observation and geostrophic estimates, Wooster and Gilmartin (1961) pointed out that the EUC supplies the upwelling region along the coast of Peru with nutrient-rich waters. Toggweiler et al. (1991) showed that the upwelling off Peru is originated from the "13° Water" thermostad (11–14 ℃) of the EUC. Wyrtki(1963, 1967) found that waters upwelled off the coast of Peru originates from the lower part of the EUC. Lukas (1986) confirmed the connection between the EUC and the PCUC by calculating the dynamic height and geostrophic flow. Zuta et al. (1978) suggested that cold upwelling waters over a wide coastal band off Peru and Chile is likely to originate from the EUC. Brink et al. (1983) and Fiedler and Talley (2006) held that the EUC is probably an important source of the water carried by the PCUC. Based on the geostrophic transport estimates, Wyrtki (1966) found that about 10 Sv (28%) of the undercurrent penetrated below the upwelling area off northern Peru and supplied the upwelling. Montes et al. (2010) performed a quantitative evaluation according to the trajectories of the EUC floats in the ROMS model, concluding that only less than 10% of EUC feeds the PCUC.
The northern branch that flows northward along the coast of South America has been seldom investigated in previous studies. Wyrtki (1966) held that approximately 5 Sv (14%) of the EUC water, which turned north, is integrated into the north equatorial current (NEC). Montes et al.'s (2010) model results showed that about 15% of the EUC will flow northward along the coast, but the destination of this fraction was not mentioned in their study.
The impact of the Galapagos Islands on the EUC can be clearly seen as they considerably disrupt the EUC (Lukas, 1986; Karnauskas et al., 2007, 2008, 2010, 2015; Jakoboski et al., 2020). Lukas (1986) suggested that the Galapagos Islands significantly obstructed the EUC but cannot prevent the EUC from penetrating east of the islands and to the coast of South America. Karnauskas et al. (2010) found that the Galapagos are directly in the path of the EUC core and forms a barrier to the EUC. They concluded that some flow of the EUC deflects southeastward toward the coast of Peru and some flow circumnavigates Isabela (Fig. 1) to the north and returned equatorward into the central islands of the Galapagos. Jakoboski et al. (2020) showed that the EUC splits around the Galapagos Islands and tends to flow around the south and north side of the islands. The model results of Karnauskas et al.(2007, 2008) agree well with the above observations. Karnauskas et al. (2007) found that the existence of the Galapagos Islands leads to the obstruction of the EUC using the Gent-Cane Oceanic General Circulation Model (OGCM). Karnauskas et al. (2008) also mentioned that the Galapagos Islands are wide enough in the meridional direction to cause a significant perturbation of the EUC using the same model.
These studies revealed the impacts of the Galapagos Islands to the EUC and figured out a basic picture of the EUC pathway around the Islands. In addition to the obstruction of the Galapagos Islands, the winds in the Far Eastern Pacific are characterized by a strong southerly cross-equatorial component, unlike the nearly zonal winds of the central basin (Kessler, 2006). Furthermore, the winds in the Far Eastern Pacific exhibit a large seasonal variability associated with the seasonal migration of the Intertropical Convergence Zone (ITCZ). These factors suggest that the fundamental dynamics and seasonal variations of the EUC in the Far East may be distinct from the west, which is meaningful to be investigated. Previous studies mainly rely on limited hydrographic observations, which make it difficult to reveal the whole picture of the EUC termination in the Far Eastern Pacific and hard to do dynamic analysis. The reanalysis or modelling data can overcome those shortages. In this study, we use the Estimating the Circulation and Climate of the Ocean phase Ⅱ (ECCO2) data (Menemenlis et al., 2008) to examine the fundamental dynamics and seasonal variations of the EUC focusing on the region around and beyond the Galapagos Islands. We clarify the dynamical mechanism of the EUC_E through a diagnosis of the zonal momentum equation. The roles of winds in the seasonal cycle of the EUC in the Far Eastern Pacific are also investigated in context of the wind forced long wave theory. In addition, we perform a quantitative assessment of the termination by a mass budget analysis, which quantifies the exchanges and relationship between the EUC and other currents.
The rest of the paper is structured as follows. A brief description of the ECCO2 reanalysis is given in Section 2. Section 3 provides the main results, including the annual mean and seasonal cycle, mechanism, and fate of the EUC in the Far Eastern Pacific. Discussion and conclusion are given in Section 4.
2 ECCO2 REANALYSISECCO2 reanalysis is based on the Massachusetts Institute of Technology general circulation model (MITgcm) (Marshall et al., 1997). To provide accurate numerical estimates for ocean circulation and sea-ice distribution through high-resolution simulation, the model was forced by heat flux, wind stress, and freshwater flux data from available satellites and insitu observations by the National Centers for Environmental Prediction/National Center for Atmospheric Research (NCEP/NCAR) reanalysis project (Kalnay et al., 1996; Menemenlis et al., 2008). The model employs a cube-sphere grid projection. Each face of the cube is comprised of 510 by 510 grid cells with a mean horizontal grid spacing of 18 km. The data from model output are interpolated (and for vectors rotated) onto conventional longitude and latitude grids for analysis. The longitudinal range extends from 89.875°S to 89.875°N, and the horizontal grid spacing is 0.25°. There are 50 layers in the vertical with the grid spacing ranging from 10 m near the surface, gradually increasing to approximately 450 m at the bottom.
The ECCO2 estimates have been extensively used. Among others, Nie (2017) thoroughly studied the origin and pathway of the Pacific EUC and further validated the reliability of the ECCO2 by comparing the long-term mean zonal velocities of the ECCO2 solution and the Tropical Atmosphere and Ocean (TAO) project (McPhaden et al., 1998). Several studies have provided reasonable representations of the ocean's circulation and water mass property distributions in the tropical Pacific using the ECCO2 estimates (Ubelmann and Fu, 2011; Guo et al., 2019; Qiu et al., 2019).
We used the most recent version of the widely accepted product for accurate transport and budget computations and analysis of dynamic mechanism, including zonal and meridional current velocity, surface wind stress, and sea surface height (SSH). The data are available on https://ecco.jpl.n-asa.gov/products/all/.
3 RESULT 3.1 Annual mean EUC in the Eastern PacificThe long-term (1992–2016) annual mean vertical section of zonal velocity estimated by the ECCO2 along the equator shows the well-known jet-like structure of the EUC (Fig. 2a). The upper, core, and lower limits of the EUC are approximately marked by isopycnals σθ=23.5 kg/m3, σθ=25 kg/m3, and σθ =26.5 kg/m3, superimposed as white contour lines in the figure. The EUC is constrained to a range between ~1.5°S and ~1.5°N (Fig. 2b) with the core rising from 300-m depth at 140°E in the Western Pacific to 150 m at 100°W in the Eastern Pacific (Fig. 2a). The results are consistent with the observations showing that the EUC slopes upward from 200±100 m at 156°E to 100±100 m at 95°W (Johnson et al., 2002). The eastward flowing EUC also displaces southward from north of the equator to south of the equator, from 0.5°N at 140°E to 0.5°S at 100°W (Fig. 2b), which agrees well with the observational results by Knauss (1966), Johnson et al. (2002), and Karnauskas et al. (2010) that the EUC core shifts off the equator to ~0.5°S in the Eastern Pacific.

|
| Fig.2 Twenty-five-year average (1992–2016) longitudinal distributions of EUC velocity magnitude (m/s) in the ECCO2 data a. vertical distribution at latitudes of maximum velocity. Contour interval is 0.1 m/s. Superimposed are isopycnals (kg/m3) depicted as white contour lines; b. lateral distribution at depths of maximum velocity at each longitude, contour interval 0.1 m/s. |
In the Far Eastern Pacific, the EUC changes greatly due to the obstruction by the Galapagos Islands near 91.5°W. To the west side of the islands, the EUC at 100°W is found at depths of 50 to 300 m with core velocity of 40–50 cm/s, which is similar to those of the central basin. On the other side at 87°W, an isolated core at depths of 50 to 150 m indicates the existence of a weak eastward EUC. The long-term annual mean core velocity of 10 cm/s is weak. The observations by the TAO mooring from November 1981 to March 1982 showed the mean core velocity of 15 cm/s at 85°W (Karnauskas et al., 2010). Although the annual mean is weak, the time series of monthly zonal current at 87°W from 1992 to 2016 exhibits considerably seasonal and interannual variabilities (Fig. 3). The seasonal cycle of the EUC_E shows an evident spring intensification (Fig. 3). For example, the core velocity of the EUC at 87°W exceeds 60 cm/s during boreal spring in the years of 1992, 2011, 2014 whereas the speed at 87°W only has a maximum of ~20 cm/s in the years of 1998, 2004, 2016.

|
| Fig.3 Time series of monthly mean zonal velocity (cm/s) at 87°W from January 1992 to December 2016 The contour interval is 10 cm/s. Zonal velocities are color shaded; red indicates eastward currents and blue westward. |
Though very sparse, there are still some observations beyond the islands. Observations in June 1969 revealed an eastward velocity of 37 cm/s at 0.37°S, 84°W and 75 m (Stevenson and Taft, 1971). The meridional section taken at 87°W during September–December 1961 from 1°S to 1°N confirmed the 20 cm/s eastward velocity from 130- to 220-m depth (Knauss, 1966). There are a few years, such as 2001, 2008, 2011, when the core velocity of EUC_E in the ECCO2 is about 30 cm/s in June, which are comparable with the observations.
As the EUC generally flows along isopycnals, the mean isopycnal of 25.5–26.0 kg/m3 was chosen to demonstrate the pathways of EUC in the Eastern Pacific. The original velocity on the z-coordinate was interpolated onto several isopycnals. Figure 4 shows the 25-year annual mean subsurface circulation on σθ =25.5–26.0 kg/m3, with a schematic illustration of major equatorial subsurface currents. The ECCO2 model reproduces well three eastward equatorial subsurface currents: the EUC (located between 1°N and 1.5°S), the primary southern subsurface countercurrent (pSSCC, between 3°S and 4°S), and farther south the secondary southern subsurface countercurrent (sSSCC, between 7°S and 8°S) (Montes et al., 2010). Meanwhile, the equatorial surface currents including the westward NEC (between 8°N and 18°N), SEC(N) (between 1°N and 3°N), SEC(S) (between 1.5°S and 3°S), and the eastward north equatorial countercurrent (NECC, between 3°N and 7°N) are also displayed on the 25.5–26.0 isopycnal (kg/m3).

|
| Fig.4 Annual mean subsurface circulation scheme for the eastern tropical Pacific from ECCO2 data averaged over January 1992–December 2016 on the 25.5–26.0 isopycnal (kg/m3) The scale vector is located in South America. SEC: south equatorial current; NEC: north equatorial current; NECC: north equatorial countercurrent; EUC: equatorial undercurrent; pSSCC: primary southern subsurface countercurrent; sSSCC: secondary southern subsurface countercurrent. |
It is clearly shown that some of EUC water turns westward recirculating into lower levels of the SEC when approaching the Galapagos Islands, and the rest continues to flow eastward, bypassing the Galapagos to the coast of the American continent, where the current is divided into two poleward branches along the continental frontiers. The northern branch ultimately flows into the NEC, and the south branch eventually flows southward to feed the PCUC. Significant parts of both pSSCC and sSSCC also contribute to the PCUC (Fig. 4).
These results are in good agreement with the observations by Karnauskas et al. (2010) and simulations by Montes et al. (2010). Karnauskas et al. (2010) found that the eastward flowing EUC is obstructed by the Galapagos at 91.66°W and some of the EUC flow deflects southeastward toward the coast of Peru whereas some flow circumnavigated Isabela to the north. The ROMS solutions of Montes et al. (2010) showed that the most part of EUC water contributed to westward flows and the remainder split into two zonal eastward branches plus equatorial upwelling. The two branches flowing around the Galapagos north and south of the equator keep on the eastward propagation with a merging trend onto the equator just east of the islands. The reliability of the ECCO2 in reproducing general circulation in the eastern tropical Pacific enables us to conduct further analysis on seasonal variations of the EUC.
3.2 Seasonal variations of the EUC and its termination in the Eastern Pacific 3.2.1 Vertical sections of zonal velocityFigure 5 displays the annual cycle of the zonal currents at 170°W, 140°W, 130°W, 125°W, 120°W, 110°W, 100°W, and 85°W along the equator. The zonal subsurface current in the EUC core has significant seasonal variations at all the eight locations. The boreal spring enhancements of the EUC are evident in both central (170°W–125°W) and Eastern (125°W–eastern boundary) Pacific. In addition, a second period of enhancement in the EUC is obviously found in boreal autumn in the Eastern Pacific (Fig. 5, lower panel), which results in a prominent semiannual signal in the EUC. Therefore, unlike the central Pacific, the seasonal cycle of the EUC in the Eastern Pacific exhibits two maxima: one in boreal spring, and the other in autumn.

|
| Fig.5 Monthly mean climatologies of zonal currents (m/s) at different latitude/longitude positions a. 0°/170°W; b. 0°/140°W; c. 0°/130°W; d. 0°/125°W; e. 0°/120°W; f. 0°/110°W; g. 0°/100°W; h. 0°/85°W. Red shading indicates eastward flow and blue westward. Contour interval is 0.1 m/s and white contours indicate zeros. |
Seasonal mean vertical sections of zonal velocity at 100°W and 87°W clearly show the different features of the EUC on the two sides of the Galapagos Islands (Fig. 6). The strength and vertical extension of the EUC_E are considerably reduced due to the obstruction of the islands (right column in Fig. 6). At 100°W (left column in Fig. 6), the maximum velocity of the EUC exceeds 60 cm/s, and the current extends to approximate 300–450 m. At 87°W (right column in Fig. 6), the EUC is much weaker with maximum velocity less than 20 cm/s, and the current is confined in the upper 300 m in boreal autumn and 200 m in other seasons. Both the EUC to the west of the Galapagos (hereafter referred to as EUC_W) and EUC_E extend to the greatest depth during autumn: EUC_W to the depth of 450 m, EUC_E to the depth of 300 m. The cores of the EUC_W and EUC_E are almost at the same depth and exhibit slight vertical displacements with seasons: 80 m in boreal spring, 110 m in summer, 120 m in autumn, and 100 m in winter.

|
| Fig.6 Vertical sections of the seasonal mean zonal velocity (cm/s) at 100°W (left panel) and 87°W (right panel) showing the vertical structure of the Equatorial Current System, shown as four average seasons in the lower right corner of each panel Zonal velocities are color shaded. Density (σθ in kg/m3) is depicted as white contour lines. Contour intervals are 5 cm/s for velocity and 0.5 kg/m3 for density. The abbreviations in the lower right corner of each panel indicate different seasons: MAM: boreal spring (March to May), JJA: boreal summer (June to August), SON: boreal autumn (September to November), DJF: boreal winter (December to February) (the same as following). |
Although sparse, there are still some velocity measurements at the two sides of the islands. The observational EUC core west of the Galapagos at 93°W was ~70 cm/s at 50-m depth in September–December 1961 (Knauss, 1966). An EUC core of 60–79 cm/s at ~75-m depth centered on 0.5°S at all transects from 94°W to 92°W were observed in November 1993 (Steger et al., 1998). From velocity measurements of an equatorial TAO mooring (November 1981–March 1982), the EUC core was found between 50- and 100-m depths west of the Galapagos and the mean maximum core velocity was 123 cm/s (100 cm/s) at 110°W (95°W) (Karnauskas et al., 2010). A well-defined EUC core in excess of 60 cm/s along 95°W centered between 50- and 100-m depths was also observed in November by archived shipboard Acoustic Doppler Current Profiler (ADCP) measurements (Karnauskas et al., 2010).
The meridional section taken at 87°W during September–December 1961 from 1°S to 1°N confirmed the 20 cm/s eastward velocity from 130- to 220-m depth (Knauss, 1966). The EUC_E in boreal winter has a maximum velocity of 15 cm/s at 100-m depth, which is consistent with the mean maximum core velocity of 15 cm/s at 85°W by TAO mooring from November 1981 to March 1982 (Karnauskas et al., 2010). The EUC_E in the ECCO2 is in good agreement with the observations.
3.2.2 Pathways of the EUC in the Eastern PacificAs the EUC core toward the east of the Islands is essentially located at isopycnals of 25.0 to 26.5 kg/m3 with seasonal vertical displacements, in order to describe the circulation on isopycnals with high accuracy, according to the vertical structure shown in Fig. 6, the average circulation between 25.0 and 25.5 isopycnal (kg/m3) is chosen to represent boreal spring circulation, between 25.5 and 26.0 isopycnal (kg/m3) for boreal summer circulation, between 26.0 and 26.5 isopycnal (kg/m3) for boreal autumn circulation, and between 25.0 and 26.0 isopycnal (kg/m3) for boreal winter circulation (Fig. 7).

|
| Fig.7 Annual cycle of the subsurface circulation, shown as four average seasons in the top-hand side of each panel Zonal velocities are color shaded. Red colors indicate eastward transport and blue colors westward. The contour interval is 0.05 m/s. The scale vector for each plot is located in South America. The abbreviations in the top-hand side of each panel indicate different seasons: MAM: boreal spring (March to May), JJA: boreal summer (June to August), SON: boreal autumn (September to November), DJF: boreal winter (December to February). |
In the Eastern Pacific, EUC termination exhibits remarkable seasonal variations (Fig. 7). Different from those in the other seasons, circulation in boreal spring shows a symmetric pattern about the equator, with the north and south branches circumventing the Galapagos Islands (Fig. 7a). The two branches converge again after bypassing the Islands and keep flowing eastward to the coastal boundary of the American continent, with two poleward extensions from the equator. In the northern hemisphere, the poleward deflecting branch flows northward along the continental frontiers to the Panama Bight, and then turns westward under complex terrain constraints to eventually merge into NEC. Meanwhile, in the southern hemisphere, the other poleward deflecting branches with the convergence of both pSSCC and sSSCC flow southward along the western boundary shorelines of Peru and Chile, becoming a part of the PCUC. Observations in Karnauskas et al. (2010) also showed a pronounced influence of the Galapagos on the EUC including strong flow topographically deflects north and south from the tips of Isabela during the strong EUC season (March–July), which was in accordance with the ECCO2 estimates.
In the other seasons, the vast majority of EUC water recirculates into the westward SEC, leaving little water circumventing the Islands. Additionally, the circulation patterns become asymmetric about the equator (Fig. 7b–d). The northern branch is stronger than the southern branch during boreal winter and autumn. The weakest EUC appears in boreal summer, and the fading EUC is gradually replaced by westward currents approaching the eastern boundary. In the west to the Galapagos Islands, the SEC displays significant seasonal variations: it is quite strong in boreal winter and summer, and relatively weaker in boreal spring and autumn. From Karnauskas et al. (2010), in the weak EUC season (September–January), the EUC was observed to bifurcate between 95°W and the Galapagos: part of the flow circumnavigates Isabela to the north, whereas some of the flow turns to the south. East of Isabela, the northern branch appears to recirculate into the archipelago, whereas the southern branch turns eastward along ~3°S and southward. The observational results basically coincide with the ECCO2 output, but the currents recirculating into central islands of the Galapagos are not obvious due to the limit of model resolution (Fig. 1).
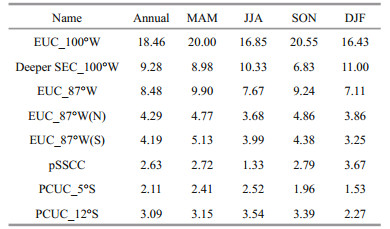
3.2.3 Volume transportsVertically integrated transports of various subsurface currents were calculated to quantitatively investigate their seasonal cycles. The transports of currents are EUC at 100°W, defined as eastward transport within 1°N–1.5°S and 0–400 m; deeper SEC branches at 100°W, westward transport within 1°N–2.5°N, 1.5°S–3.5°S and 50–400 m; north branch of the EUC at 87°W, eastward transport within 0°–2.5°N and 50–400 m; south branch of the EUC at 87°W, eastward transport within 0°–3°S and 50–400 m; PCUC(north (N)) at 5°S, southward transport within 81°W–83°W and 0–400 m; PCUC(south (S)) at 12°S, southward transport within 79°W–77°W and 0–400 m; and pSSCC at 100°W, eastward transport within 3°S–5.5°S and 50–400 m.
Annual mean volume transport (VT) of the EUC at 100°W to west of the Galapagos is approximately 18 Sv (Table 1), which is much weaker than the EUC in the central Pacific (about 40 Sv (Johnson et al. 2002)). Sloyan et al. (2003) estimated the eastward EUC transport within ±2° of the equator for 22.5 kg/m3≤ σθ ≤26.3 kg/m3 in an inverse model. The zonal transports implied by the model are 24.0±1.9 Sv at 110°W and 16.2±1.9 Sv at 95°W, respectively. The zonal transports in the ECCO2 calculated in the same density range are 17.2 Sv at 110°W and 11.2 Sv at 95°W, respectively, which are smaller than Sloyan et al.'s (2003) results. From Fig. 6, we can see that the vertical extension of the EUC in the ECCO2 is beyond the density range (> 26.5 kg/m3). The annual mean VT of the EUC at 87°W is 8.5 Sv, approximately 45% of the EUC at 100°W, and half of the eastward transport recirculates into the lower level of the westward SEC. The annual mean VTs of the north and south branches of the EUC at 87°W are almost the same in magnitude, confirming the symmetry about the equator. The annual mean total eastward VT west of the islands (the difference between EUC_100°W and SEC_100°W) is 9.18 Sv and that east of the islands (the sum of the EUC_87°W(N) and EUC_87°W(S)) is 8.48 Sv, which confirms the nearly closed annual mean volume budget in the Eastern Pacific. In the seasonal cycle, the mass budget is not completely closed (Fig. 8b), for that there is intense upwelling just west of the Galapagos Islands. The difference between EUC (100°W)–SEC (100°W) and EUC (87°W) is largest in September–November, which agrees well with the maximum upwelling in boreal autumn calculated in a box below.
|

|
| Fig.8 Mean seasonal cycle (monthly means) of volume transports (Sv) a. average transports with error bars, including EUC at 100°W (black) integrated from 1.5°N to 2°S and 0-400 m, SEC branches at 100°W (red) from 0.5°N to 3°N, 1.5°S to 4°S and 50-400 m, EUC at 87°W from 3°N to 3.5°S and 50-400 m (blue); and PCUC at 5°S from 81°W to 83°W and 0-400 m (green) in the equatorial Eastern Pacific; b. the total eastward transport to the west and east of the Galapagos, including the difference between EUC_100°W and SEC_100°W (red) and the sum of the EUC_87°W(N) and EUC_87°W(S) (blue). |
The EUCs to the west and east of the Islands exhibit similar seasonality (Fig. 8a). The seasonal cycles of the volume transport of EUC at 100°W and 87°W exhibit two maxima: one in boreal spring and the other in autumn. The minimum transport occurs during summer. During autumn, although the core velocity is smaller than winter and spring, the VT of EUC still reaches maximum due to its largest vertical extension (Fig. 8). As shown in Fig. 8, the VT of westward flows exhibits an obvious double-peak phenomenon as well, but one in boreal winter (February) and the other in summer (July), which are exactly out of phase with the EUC.
An estimate of the mean seasonal cycle of EUC volume transport at 95°W was also conducted by Johnson et al. (2002). They obtained an annual mean VT of 20.7 Sv at 95°W and a peak of ~30 Sv in boreal spring (May), which differs from our calculations with double peaks in boreal spring (May) and autumn (September) at 100°W. The maximum transport in May is well reproduced by ECCO2 but weaker than Johnson's value. Blanke and Raynaud (1997) showed a pronounced seasonal variability in the EUC zonal transport based on the OPA model, which are similar with our results. They defined the EUC to be the eastward flow in the latitude band from 3.55°S to 3.55°N and depth range from 495 m to the surface. At 100°W, the OPA model gave a maximum transport of ~20 Sv in May and September, and a minimum of ~15 Sv in February and July.
3.3 Mechanism of the seasonal variation of the EUC to the east of Galapagos 3.3.1 Diagnostic of zonal momentum equationThe zonal winds are very weak or even westerly east of the Galapagos, thus there should be no pressure gradient or EUC according to linear dynamics just as Kessler (2006) pointed out. It is expected that the nonlinear mechanism would act to produce an EUC to the east of the Galapagos even without a pressure gradient to drive it.
In this section, we examine the dynamics of seasonal variations of the EUC_E through a diagnosis of the zonal momentum equation following McPhaden and Taft (1988) and Yu and McPhaden (1999b). The zonal momentum diagnostic equation in the stratified ocean can be written as:
 (1)
(1)where u, v, and w are zonal, meridional, and vertical velocity components, respectively; p is pressure, ρ is density, f is the Coriolis parameter, A is vertical eddy viscosity and K is horizontal eddy viscosity. Subscripts denote differentiation and the operator is a horizontal gradient operator.
Figure 9 shows vertical profiles of mean zonal pressure gradient and zonal advection terms in intervals 140°W–110°W and 88°W–82°W, respectively. The profile for intervals 140°W–110°W shows similar features as Fig. 7 in Yu and McPhaden (1999b) calculated from TAO observations. To the west of the Islands (140°W–110°W), the eastward zonal mean pressure gradient force is much larger than zonal advection in the upper 100 m. Zonal advection changes its sign at the depth of the EUC core, and it is comparable to or even larger than the zonal pressure gradient below the depth of 100 m. The results suggest that the EUC_W is mainly driven by the zonal pressure gradient force. To the east of the Islands (88°W–82°W), the annual mean zonal mean pressure gradient force is westward, which will reduce the strength of the EUC_E if the EUC circumvents the Islands from the west. Although the negative annul mean zonal advection is quite weak compared to the pressure gradient, it is the main force driving the EUC_E.

|
| Fig.9 Vertical profiles of mean zonal pressure gradient (black) and zonal advection (red) with horizontal error bars Units are ×10-4 N/m3. |
Figure 10 shows the depth-time contours of seasonal variations in zonal pressure gradient, local acceleration, and zonal advection in the west and east of the Islands, respectively.

|
| Fig.10 Depth-time contours of seasonal fluctuations in zonally averaged zonal momentum terms in intervals 140°W–110°W (left panel) and 88°W–82°W (right panel) a–b. zonal pressure gradient; px; c–d. local acceleration; ρut; e–f. zonal advection; ρuux. Intervals are 0.5×10⁻⁴ N/m3 for zonal pressure gradient and 0.1×10⁻⁴ N/m3 for local acceleration and zonal advection. |
In the 140°W–110°W zonal interval, the negative pressure gradient decreases in amplitude with depth. The eastward pressure gradient is weaker in boreal spring from March to June. In the 88°W–82°W interval, the pressure gradients are negative in the upper 50 m from February to April, which are favorable for the eastward transport whereas they are positive from May to next January which are unfavorable for the eastward undercurrent. The maximum zonal velocity at 87°W in boreal spring and smaller velocities in other seasons are consistent with the force analysis.
The local acceleration has a maximum below the surface but above the EUC core that is at a depth of ~50 m in all two intervals. Significant local accelerations indicate the imbalance of ocean circulation with surface forcing on the seasonal timescales. The seasonality of local acceleration in the two sides of the islands is similar: the EUC accelerates from September to next April with maximum acceleration in March, and decelerates during boreal summer from May to August with maximum deceleration in June. The similar local acceleration suggests that the seasonal variation of the EUC_E is also controlled by the zonal winds in the central Pacific because it is an extension of the EUC from the west, although the local winds also contribute substantially.
In these two zonal intervals, zonal advection is much smaller in amplitude than pressure gradient, but it is comparable to the pressure gradient around the depth of EUC core. Especially in the 88°W–82°W interval, zonal advection plays a prominent role in maintaining the EUC east of the Islands while the positive pressure gradient is unfavorable.
3.3.2 Wind forcing waves and seasonal variations of the EUC_EAs mentioned above, the EUC_E exhibits similar seasonality as EUC_W with slight differences. Driven by the zonal advection term, the EUC_E is an extension of the EUC_W. Previous studies already emphases the roles of wind forcing Kelvin and Rossby waves in the semiannual and annual variations of the surface and subsurface currents in the Eastern Pacific (Busalacchi and O'Brien, 1980; Yu and McPhaden, 1999a; Chen et al., 2015, 2019). According to Busalacchi and O'Brien (1980), anomalous westerly (easterly) in the central Pacific generates eastwardpropagating downwelling (upwelling) Kelvin waves, affecting sea surface elevation considerably in the Eastern Pacific. Yu and McPhaden (1999a) emphasized the roles of the first four baroclinic Kelvin and Rossby waves in the seasonal variations of the surface and subsurface circulations in the Eastern Pacific. In this section, we use the wind forcing long wave theory to explain the seasonal cycle of the EUC_E.
Wind patterns in the central and Far Eastern Pacific are quite different. Winds in the equatorial central Pacific are nearly zonal with small seasonal fluctuations. While in the Eastern Pacific, the winds are characterized by a strong southerly crossequatorial component with obvious seasonal fluctuations. To the east of Galapagos, the zonal winds are very weak or even westerly due to the right deflection of southerly in the northern hemisphere. The southerly is weaker during boreal winter and spring and stronger during boreal summer and autumn (Fig. 11).

|
| Fig.11 Mean wind stress (vectors) and zonal wind stress (colors), for four average seasons Red shading shows westerly and blue easterly, in units of N/m2, with (stretched) color key at right. The scale vector is located in the American continent. |
Seasonal variations in winds, sea surface height, and subsurface zonal currents are highlighted by subtracting annual means from monthly climatologies (Fig. 12). Along the equator, the demeaned zonal winds progress westward west of the islands. In contrast, to the east of the islands, there are no obvious propagating signals (Fig. 12). Anomalous westerly (relaxation of trade wind) propagates westward across the central and Eastern Pacific from January to June, and the anomalous easterly (intensification of trade wind) propagates westward from June to September (Fig. 12a). The demeaned meridional winds exhibit obvious annual variations with intensification of southerly winds from June to November and relaxation of southerly from December to May. There is no propagation signal in the demeaned meridional winds, and the largest fluctuations are near the location of the islands (Fig. 12b).

|
| Fig.12 Seasonal variations along the equator from ECCO2 a. zonal wind stress (N/m2); b. meridional wind stress (N/m2); c. sea surface height (m); d. zonal current averaged over 50-150 m (m/s). Red shading shows positive anomalies and blue negative. The long-term means are removed from monthly mean climatologies. |
The time-longitude structure of the seasonal variability in SSH along the equator shows clear propagation signals (Fig. 12c). Seasonal variability in SSH has different character east and west of roughly 120°W. To the east of 120°W, SSH anomalies propagate eastward leading to large amplitudes near 100°W, and the SSH to east of the islands displays a pronounced semiannual cycle, whereas west of 120°W, there is an annual cycle propagating westward. The demeaned subsurface zonal currents averaged over the core depth of the EUC (50–150 m) along the equator also display two distinct domains roughly separated by 120°W (Fig. 12d). To west of 120°W, the seasonal cycle of the subsurface zonal currents exhibits an annual fluctuation with one peak and the currents are altered by wave signals. To the east of 120°W, there is a semiannual signal with double peaks in boreal spring and autumn. This is consistent with the feature shown in Fig. 5 that the seasonal cycle of the EUC exhibits two peaks in the Far Eastern Pacific and one peak in the west.
As mentioned above, the seasonality in SSH and subsurface zonal currents can be interpreted by Rossby and Kelvin waves excited by decrease or increase in easterly. In order to reveal the spatial structure of the equatorial waves, maps of demeaned pressure and currents averaged over the EUC core depth (50–200 m) are constructed (Fig. 13).

|
| Fig.13 The spatial structure of 50–200 m averaged monthly climatological anomalies of pressure (kg/(m·s2); color) and currents (vectors) for the 1992–2016 period from ECCO2 output |
From April to July, equatorial-trapped downwelling Kelvin waves propagate eastward resulting in increases in sea surface height and pressure averaged over the depth of 50–200 m at the eastern boundary region through convergence of surface water. These downwelling Kelvin waves correspond to a decrease in easterly (downwelling favorable) during January to May (Figs. 12a, c, & 13d–f). The amplitudes of the fluctuation increase eastward from 120°W to the eastern boundary from April to June as the downwelling Kelvin waves accumulate eastward (Figs. 12c & 13d–f), which is consistent with Minobe and Takeuchi's (1995) results showing that the amplitudes of the Kelvin waves increase eastward from 130°W to 90°W. The SSH and pressure in the Far Eastern Pacific reaches maximum in June (Figs. 12c & 13f). The increase in pressure near the eastern boundary in May–June is indicative of a poleward travelling coastally-trapped Kelvin wave (Fig. 13e–f). In June, the coastally-trapped Kelvin wave is reflected as a downwelling Rossby wave traveling to the west (Fig. 13e–f). The setup of the westward pressure gradient force by the high pressure near the eastern boundary hampers the EUC_E in summer (Fig. 12d).
The decrease in easterly from January to May also excites westward propagation upwelling Rossby waves (Figs. 12c & 13b–g). The westward travelling upwelling Rossby waves lead to large decreases in pressure along its pathway in both north and south of the equator. Such kind of the meridional structure of the pressure associated with upwelling Rossby waves results in an enhanced EUC from April to June in the central and Eastern Pacific (Fig. 13d–f). As shown in Figs. 5h & 12d, the EUC_E reaches maximum during boreal spring, it is likely affected by the enhanced EUC in the west through the horizontal advection. The amplitudes of Rossby waves excited by the wind forcing in the Eastern Pacific increase westward as pointed out by Minobe and Takeuchi (1995), resulting in the significant effect of Rossby waves on the equatorial oceanic seasonal variation much farther to the west (Fig. 13d–f).
In July and August, there is a significant increase in easterly between 140°W–90°W (Fig. 12a), which excites eastward propagation upwelling Kelvin waves and westward propagation downwelling Rossby waves (Figs. 12c & 13g–k). Figure 13h–k shows low pressures east of the 120°W during August–November, which is induced by the upwelling Kelvin waves and the reflected westward upwelling Rossby waves. Meanwhile, the westward propagating downwelling Rossby waves excited by increase in easterly are also evident between 100°W and 180°W (Fig. 13h–l). The high pressures on both sides of the equator associated with the downwelling Rossby waves lead to weakened EUC in the central and Eastern Pacific with the most obvious decrease in EUC occurring between 120°W–140°W September–October (Figs. 12d & 13h–j). However, we can observe a slight enhancement in the EUC to the east of 120°W during October–December (Figs. 12d & 13j–l), which is consistent with the autumn maximum in the seasonal cycle of the EUC in the Eastern Pacific. This enhancement is due to the eastward pressure gradient force in the east basin, which is set up by the pressure increase in west and the pressure decrease in east, the former is caused by the westward downwelling Rossby waves and the latter is caused by the upwelling Kelvin waves and the reflected upwelling Rossby waves from the eastern boundary.
The lead/lag correlations between the EUC on the two sides of the Galapagos and the zonal and meridional components of the wind in the equator are shown in Fig. 14. The maximum velocity at 95°W and 85°W within 1°N–1.5°S and 0–200 m are used as the index to measure the strength of the EUC_W and EUC_E, respectively. The correlations are calculated using the monthly mean zonal and meridional wind components over the period from January 1992 to December 2016.

|
| Fig.14 Longitude-time contours of lead correlation coefficients between (upper panel) maximum zonal velocity at 95°W and zonal component (a), meridional component (b), (lower panel) maximum zonal velocity at 85°W, zonal component (c), meridional component (d) Color shading indicates coefficients beyond 95% confidence level. Red values indicate positive correlation and blue values negative. |
The significant correlations between the EUC at 95°W and zonal winds are in the central Pacific (150°E–120°W) when the zonal winds lead the undercurrent about 1–9 months. The maximum correlation occurs at the area 170°E–150°W when the zonal winds lead the EUC about 3–6 months (Fig. 14a). The EUC at 95°W does not have significant correlations with the local winds (Fig. 14a–b). When the lead time longer than 3 months, the EUC at 85°W also has significant correlations with the zonal winds in the central Eastern Pacific (150°W–120°W) (Fig. 14c). Compared to the EUC at 95°W, the zonal winds significantly correlated to the EUC at 85°W are located farther east and the correlation coefficients are smaller. The EUC at 85°W has weak correlations with local winds (Fig. 14c–d). The correlation analysis confirms that the seasonal variation of the EUC in the Far East Pacific is significantly influenced by zonal winds in the central Pacific via wind forcing waves.
3.4 Fate of the EUC in Eastern PacificIt is well known that the EUC water in the Eastern Pacific upwells to surface layer, recirculates and feeds the westward SEC, flows both north and south of the Islands and contributes to the NEC and the PCUC, respectively. In this section, a mass budget is computed to estimate the magnitudes of each termination.
3.4.1 UpwellingA mass budget was computed in a box so as to estimate the transport of upwelling from the undercurrent in the Eastern Pacific (Fig. 15). The length of the box is approximately 20° of longitude or 2×10³ km, from 100°W to the western coast of South America at 79°W. As suggested by Wyrtki (1981), upwelling above the undercurrent is probably limited to ~2° of latitude from the equator. Based on the vertical extension of the undercurrent (Fig. 6), an average depth from 50 to 400 m was chosen. The seasonal variations of the EUC pathways averaged over 50–400 m within the box are given in Fig. 16, which gives a clearer picture of the strength, width, and axis of EUC in the box. The eastward EUC has a width of 2° in latitude (~0.5°N–1.5°S) with its axis located at 0.5°S. The northern/southern boundaries of the lower levels of the westward SEC are approximately 3° of latitude, and it is somewhat less in the north and more in the south of the equator (Fig. 16). Consequently, the north and south boundaries of the box are set as 2.5°N and 3°S respectively, which determines the width of the box as 5.5° of latitude, or about 600 km. Unlike the stability in width and axis, the EUC shows obvious seasonality in strength with a strong intensification in boreal autumn.

|
| Fig.15 Schematic view of the box with the inflow and outflow across each face for the construction of mass budget and the estimation of upwelling in the Eastern Pacific |

|
| Fig.16 Seasonal variations of the subsurface circulation averaged over 50–400 m within the box The scale vector for each plot is located in South America. |
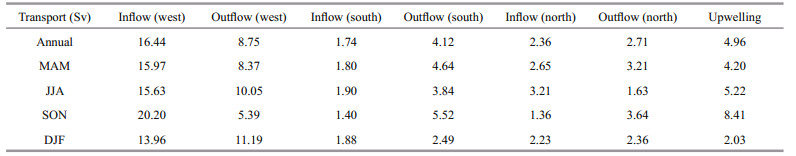
The annual and seasonal mean transports across each side of the box are listed in Table 2. The flow convergence at the 50–400-m layer can be used to estimate the upwelling of the EUC water to upper 50 m. In view of the annual mean results, the lateral inflow to the box is 16.44 Sv at 100°W, 1.74 Sv at 3°S, and 2.36 Sv at 2.5°N. Meanwhile, the lateral outflow from the box is 8.75 Sv at 100°W, 4.12 Sv at 3°S, and 2.71 Sv at 2.5°N. The total inflow of 20.54 Sv is partially balanced by the outflow of 15.58 Sv in the 50–400-m depth. The residual of 4.96 Sv (about 24% of the total inflow) is upwelled to the upper 50 m. If this upwelling mass flux is evenly distributed over a distance of 2×10³ km east-west and of 600 km northsouth, the vertical upwelling velocity will be 0.41×10⁻⁵ m/s (0.35 m/d).
|
The estimates also suggest that, at 50–400 m, approximate 42.6% of the EUC (8.75 Sv) turns westward to feed the SEC, 13.2% (2.71 Sv) flows northward entering the northern tropical current system, and 20.1% (4.12 Sv) flows southward to the Peruvian coastal region mainly contributing to the PCUC. More EUC water flows south than north of the equator.
The estimated upwelling is stronger during boreal summer and autumn and weaker in boreal spring and winter, with the maximum in boreal autumn and minimum in boreal winter (Table 2). In boreal autumn, the inflow at 100°W is the strongest (20.20 Sv) when the southeasterly reaches far north, while the westward outflow at 100°W reaches minimum of 5.39 Sv. The maximum upwelling of 8.41 Sv in boreal autumn is much stronger than the annual average of 4.96 Sv. The minimum upwelling of 2.03 Sv in boreal winter appears to arise from the minimum inflow of 13.96 Sv and maximum westward outflow of 11.19 Sv at 100°W (Table 2). The annual cycle of upwelling transport is exactly in phase with the net transport at the west side.
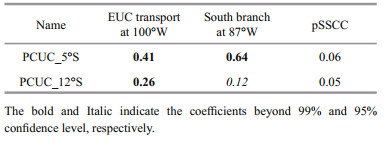
3.4.2 Connection between EUC and PCUCAccording to the estimations, the annual mean outflow across 3°S is 4.12 Sv, which is much larger than that across 2.5°N (2.71 Sv), implying more EUC water flows south of the equator than north. The southward flowing EUC water is believed to contribute to the PCUC. The PCUC begins near 5°S and becomes strong near 12°S. As shown in Fig. 4, the PCUC at 5°S is fed by the EUC and pSSCC whereas the PCUC at 12°S is fed by the three subsurface equatorial flows (EUC, pSSCC, sSSCC) and water from south of ~9°S, which is consistent with the model results of Montes et al. (2010). The correlations between the monthly mean EUC and PCUCs at 5°S and 12°S are calculated over the period from January 1992 to December 2016. It is noted that the seasonal cycle has not been removed in the calculation. The PCUC at 5°S has a closer relationship with the EUC in the east than the west of Galapagos, the correlation coefficients are 0.64 and 0.41, respectively, which are all significant at the 99% level. The PCUC at 12°S has a smaller correlation coefficient of 0.26 (significant at 99% level) with the EUC at 100°W and an insignificant correlation of 0.12 with the EUC at 87°W (Table 3). The positive correlations suggest that the PCUC would be enhanced when the EUC is stronger.
|
Using the method of least squares, linear regression models over January 1992–December 2016 were derived, linking the transport of PCUC and EUC, South branch at 87°W, as follows:
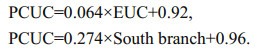
Based on this relationship, an additional 15.5 Sv of EUC transport or 3.6 Sv of South branch transport will result in an increase of 1 Sv in the PCUC transport.
4 DISCUSSION AND CONCLUSIONDue to the obstruction of the Galapagos Islands, strong cross-equatorial southerly and weak zonal winds, the dynamics of the EUC in the Far Eastern Pacific are distinct from the west. By utilization of the ECCO2 data, this study provides a systematic investigation on the structure and dynamics of seasonal variations of the EUC around and beyond the Galapagos Islands.
The presence of the EUC to the north and south of the Galapagos at 91.5°W and on the equator at 85°W was observed as early as 1960 by Knauss (1959-1960). In agreement with the observations and other simulations, the ECCO2 reproduced a reduced-speed eastward EUC to east of the Galapagos with the annual mean core velocity being 10 cm/s and transport being approximately half of the west. ECCO2 shows that some of EUC water recirculates into lower levels of the westward SEC to the west of the Galapagos, and the rest circumvents past the Galapagos into the coast with two poleward branches on either side of the equator. However, the shipboard ADCP observations indicate that some EUC flow circumnavigates Isabela to the north and returns equatorward into the central islands of the Galapagos (Karnauskas et al., 2010), which is not obvious in the ECCO2 estimates due to the limitation of the model resolution.
The EUC termination in the Far Eastern Pacific exhibits obvious seasonal variations (Fig. 7). The subsurface circulation around the islands is symmetric about the equator in boreal spring and asymmetric in other seasons with a stronger northern branch than southern branch during boreal winter and autumn (Fig. 7b–d). The vertical extension of the EUC is considerably reduced beyond the islands. The EUC has the largest core velocity in boreal spring and smallest in summer. The volume transport of the EUC in the two sides of the Galapagos Islands goes through similar seasonal cycles with two peaks in boreal spring and autumn. The autumn maximum transport is due to the larger vertical extension than other seasons.
The deepening of the EUC in autumn was also observed by the current meter during September–December 1961 (Knauss, 1966). We have not discussed the reason for the autumn deepening of the EUC. Using the observations from June 1985 to December 2000, Johnson et al. (2002) obtained a mean seasonal cycle of transport of the EUC at 95°W with a single peak in boreal spring (May), which differs from the double peaks in the ECCO2. In their study, the EUC was defined as all eastward flow between 2°N and 2°S for potential densities of 23.0 kg/m3 < σθ < 26.5 kg/m3. The maximum transport in May is well reproduced by the ECCO2 but weaker than Johnson's value, and another peak in boreal autumn does not appear in Johnson's seasonal cycle. One possible reason is that the EUC deepens in the boreal autumn and vertical range extends beyond the isopycnal of 26.5 kg/m3. We compute the EUC transport at 95°W in the same density range as Johnson's to do an accurate comparison, and find that the peak in boreal autumn still exists but with a smaller magnitude. The seasonal variability in the EUC zonal transport based on the OPA model in Blanke and Raynaud (1997) is consistent with the ECCO2.
The weak zonal winds or even westerly east of the Galapagos are not favorable for the EUC according to linear dynamics. The diagnosis of zonal momentum equation suggests that the zonal advection (the nonlinear terms) drives the currents east of the Islands, thus the EUC_E is an extension of the EUC_W. The seasonal relaxation (intensification) of the trade wind results in westerly (easterly) anomalies in the central and Eastern Pacific. The westward propagating zonal winds anomalies excite Kelvin and Rossby waves, which govern the seasonal variations of the EUC in the Eastern Pacific. In the Far Eastern Pacific, the eastward propagation Kelvin waves and reflected Rossby waves play dominate roles in the seasonal cycle of the EUC, which is different from the western and central Pacific, where the westward-propagating Rossby waves play a dominate role. To west of 120°W, an annual fluctuation with one peak propagates westward. In contrast, to east of 120°W, there is a semiannual fluctuation with double peaks in boreal spring and autumn.
A mass budget was constructed to estimate the amount of EUC water upwelled to the mixed layer. Volume transport of various subsurface currents was also calculated, to further determine the fate of the EUC in the Eastern Pacific. The mass budget suggests that approximately 24.1% of the EUC water east of 100°W upwells to the mixed layer by 0.41×10⁻⁵ m/sor 0.35 m/d. The upwelling is the strongest during boreal autumn and weakest during boreal winter. The calculation also suggests that approximately 42.6% of the EUC turns westward to feed the SEC, 13.2% flows north of the equator, and 20.1% flows south of the equator mainly contributing to the PCUC. Montes et al. (2010) showed all the possible EUC pathways and contributions according to the trajectories of EUC floats for two solutions in the ROMS model. The percentage of floats occupied by each path was as followings: 4.9% (7.8%): equatorial upwelling, 72.7% (60.7%): westward flows, 14.3% (25.4%): northern route, 8.1% (6.1%): southern route. The pathways for the EUC water are very similar but their respective percentages of occurrence are inconsistent.
The evidence of significant vertical upwelling in the Eastern Pacific has already been found in many studies. A simple box model based on geostrophy, Ekman dynamics, and mass and heat budgets between 170°E and 100°W yielded an upwelling of 1.15×10⁻⁵ m/s (0.99 m/d) across 50 m (Wyrtki, 1981). An upwelling rate peaked at (1.9±0.9)×10-5 m/s (1.64±0.78 m/d) within 170°W–95°W at 50 m was shown by integrating horizontal divergence (Johnson et al., 2001). Meinen et al. (2001) estimated the vertical velocity of 0.3×10⁻⁵ m/s (0.26 m/d) over 155°W–95°W via a box volume balance. Jakoboski et al. (2020) found local maximum in vertical velocity with magnitude of (1.7±0.6)×10-5 m/s (1.47±0.52 m/d) at 93°W by integrating the average horizontal volume transport profile. The upwelling reported in this study, with averaged value of 0.41×10⁻⁵ m/s(0.35 m/d), is slightly larger than the vertical velocity reported by Meinen et al. (2001), but much smaller than the others mentioned above. The difference between our estimate and previous studies is mainly attributed to the various methods of calculation. In addition, note that there is topographic upwelling just west of the Galapagos that is presumably much more intense than our regional averaged value (Karnauskas et al., 2015). Hence, the local maximum upwelling velocity at the equator may be much larger.
It is clearly that the EUC termination varies on both seasonal and interannual time scales simultaneously, but only seasonal variations and their dynamic mechanisms are discussed in this study, and the interannual variability related to ENSO also deserves to be investigated. The interannual variability of EUC affects the SST and further the large-scale ocean circulation in the equatorial region. Therefore, the further understanding of the variation and dynamic mechanism of EUC on the interannual time scale is of great importance in studying the changes of the equatorial upwelling and SST in the cold tongue.
5 DATA AVAILABILITY STATEMENTThe datasets generated and/or analyzed during the current study are available from the corresponding author on reasonable request.
6 ACKNOWLEDGMENTECCO2 is a contribution to the National Aeronautics and Space Administration (NASA) Modeling, Analysis, and Prediction (MAP) program. The authors wish to acknowledge computational resources and support from the NASA Advanced Supercomputing (NAS) Division and from the Jet Propulsion Laboratory (JPL) Supercomputing and Visualization Facility (SVF). We sincerely thank the anonymous reviewers for their critical and constructive comments, which helped significantly improve the analysis and presentation of the paper.
Blanke B, Raynaud S. 1997. Kinematics of the Pacific equatorial undercurrent: an Eulerian and Lagrangian approach from GCM results. Journal of Physical Oceanography, 27(6): 1038-1053.
DOI:10.1175/1520-0485(1997)027<1038:KOTPEU>2.0.CO;2 |
Brink K H, Halpern D, Huyer A, Smith R L. 1983. The physical environment of the Peruvian upwelling system. Progress in Oceanography, 12(3): 285-305.
DOI:10.1016/0079-6611(83)90011-3 |
Bryden H L, Brady E C. 1985. Diagnostic model of the three-dimensional circulation in the upper equatorial Pacific Ocean. Journal of Physical Oceanography, 15(10): 1255-1273.
DOI:10.1175/1520-0485(1985)015<1255:DMOTTD>2.0.CO;2 |
Busalacchi A J, O'Brien J J. 1980. The Seasonal variability in a model of the tropical Pacific. Journal of Physical Oceanography, 10(12): 1929-1951.
DOI:10.1175/1520-0485(1980)010<1929:TSVIAM>2.0.CO;2 |
Chen G X, Han W Q, Li Y L, Wang D X, McPhaden M J. 2015. Seasonal-to-interannual time-scale dynamics of the equatorial undercurrent in the Indian Ocean. Journal of Physical Oceanography, 45(6): 1532-1553.
DOI:10.1175/JPO-D-14-0225.1 |
Chen G X, Han W Q, Li Y L, Yao J L, Wang D X. 2019. Intraseasonal variability of the equatorial undercurrent in the Indian Ocean. Journal of Physical Oceanography, 49(1): 85-101.
DOI:10.1175/JPO-D-18-0151.1 |
Fiedler P C, Talley L D. 2006. Hydrography of the eastern tropical Pacific: a review. Progress in Oceanography, 69(2-4): 143-180.
DOI:10.1016/j.pocean.2006.03.008 |
Guo H H, Chen Z H, Yang H Y. 2019. Poleward shift of the Pacific north equatorial current bifurcation. Journal of Geophysical Research: Oceans, 124(7): 4557-4571.
DOI:10.1029/2019JC015019 |
Jakoboski J, Todd R E, Owens W B, Karnauskas K B, Rudnick D L. 2020. Bifurcation and upwelling of the equatorial undercurrent west of the Galápagos Archipelago. Journal of Physical Oceanography, 50(4): 887-905.
DOI:10.1175/JPO-D-19-0110.1 |
Johnson G C, McPhaden M J, Firing E. 2001. Equatorial Pacific Ocean horizontal velocity, divergence, and upwelling. Journal of Physical Oceanography, 31(3): 839-849.
DOI:10.1175/1520-0485(2001)031<0839:EPOHVD>2.0.CO;2 |
Johnson G C, Sloyan B M, Kessler W S, McTaggart K E. 2002. Direct measurements of upper ocean currents and water properties across the tropical Pacific during the 1990s. Progress in Oceanography, 52(1): 31-61.
DOI:10.1016/S0079-6611(02)00021-6 |
Kalnay E, Kanamitsu M, Kistler R, Collins W, Deaven D, Gandin L, Iredell M, Saha S, White G, Woollen J, Zhu Y, Chelliah M, Ebisuzaki W, Higgins W, Janowiak J, Mo K C, Ropelewski C, Wang J, Leetmaa A, Reynolds R, Jenne R, Joseph D. 1996. The NCEP/NCAR 40-year reanalysis project. Bulletin of the American Meteorological Society, 77(3): 437-472.
DOI:10.1175/1520-0477(1996)077<0437:TNYRP>2.0.CO;2 |
Karnauskas K B, Jenouvrier S, Brown C W, Murtugudde R. 2015. Strong sea surface cooling in the eastern equatorial Pacific and implications for Galápagos Penguin conservation. Geophysical Research Letters, 42(15): 6432-6437.
DOI:10.1002/2015GL064456 |
Karnauskas K B, Murtugudde R, Busalacchi A J. 2007. The effect of the Galápagos Islands on the equatorial Pacific cold tongue. Journal of Physical Oceanography, 37(5): 1266-1281.
DOI:10.1175/JPO3048.1 |
Karnauskas K B, Murtugudde R, Busalacchi A J. 2008. The effect of the Galápagos Islands on ENSO in forced ocean and hybrid coupled models. Journal of Physical Oceanography, 38(11): 2519-2534.
DOI:10.1175/2008JPO3848.1 |
Karnauskas K B, Murtugudde R, Busalacchi A J. 2010. Observing the Galápagos-EUC Interaction: insights and challenges. Journal of Physical Oceanography, 40(12): 2768-2777.
DOI:10.1175/2010JPO4461.1 |
Kessler W S. 2006. The circulation of the eastern tropical Pacific: a review. Progress in Oceanography, 69(2-4): 181-217.
DOI:10.1016/j.pocean.2006.03.009 |
Knauss J A. 1959-1960. Measurements of the Cromwell current. Deep Sea Research (1953), 6: 265-286.
DOI:10.1016/0146-6313(59)90086-3 |
Knauss J A. 1966. Further measurements and observations on the Cromwell Current. Journal of Marine Research, 24(2): 205-240.
|
Lukas R. 1986. The termination of the equatorial undercurrent in the eastern Pacific. Progress in Oceanography, 16(2): 63-90.
DOI:10.1016/0079-6611(86)90007-8 |
Marshall J, Adcroft A, Hill C, Perelman L, Heisey C. 1997. A finite-volume, incompressible Navier Stokes model for studies of the ocean on parallel computers. Journal of Geophysical Research: Oceans, 102(C3): 5753-5766.
DOI:10.1029/96JC02775 |
McPhaden M J, Busalacchi A J, Cheney R, Donguy J R, Gage K S, Halpern D, Ji M, Julian P, Meyers G, Mitchum G T, Niiler P P, Picaut J, Reynolds R W, Smith N, Takeuchi K. 1998. The tropical ocean-global atmosphere observing system: a decade of progress. Journal of Geophysical Research: Oceans, 103(C7): 14169-14240.
DOI:10.1029/97JC02906 |
McPhaden M J, Taft B A. 1988. Dynamics of seasonal and intraseasonal variability in the eastern equatorial Pacific. Journal of Physical Oceanography, 18(11): 1713-1732.
DOI:10.1175/1520-0485(1988)018<1713:DOSAIV>2.0.CO;2 |
Meinen C S, McPhaden M J, Johnson G C. 2001. Vertical velocities and transports in the equatorial Pacific during 1993–99. Journal of Physical Oceanography, 31(11): 3230-3248.
DOI:10.1175/1520-0485(2001)031<3230:VVATIT>2.0.CO;2 |
Menemenlis D, Campin J M, Heimbach P, Hill C, Lee T, Nguyen A, Schodlok M, Zhang H. 2008. ECCO2: high resolution global ocean and sea ice data synthesis. Mercator Ocean Quarterly Newsletter, 31: 13-21.
|
Minobe S, Takeuchi K. 1995. Annual period equatorial waves in the Pacific Ocean. Journal of Geophysical Research: Oceans, 100(C9): 18379-18392.
DOI:10.1029/95JC01666 |
Montes I, Colas F, Capet X, Schneider W. 2010. On the pathways of the equatorial subsurface currents in the eastern equatorial Pacific and their contributions to the Peru-Chile undercurrent. Journal of Geophysical Research: Oceans, 115(C9): C09003.
DOI:10.1029/2009JC005710 |
Nie X W. 2017. Water Sources of the Pacific Equatorial Undercurrent and Their Main Pathways. University of Chinese Academy of Sciences, Qingdao.
|
Qiu B, Chen S M, Powell B S, Colin P L, Rudnick D L, Schönau M C. 2019. Nonlinear short-term upper ocean circulation variability in the tropical western Pacific. Oceanography, 32(4): 22-31.
DOI:10.5670/oceanog.2019.408 |
Sloyan B M, Johnson G C, Kessler W S. 2003. The Pacific cold tongue: a pathway for interhemispheric exchange. Journal of Physical Oceanography, 33(5): 1027-1043.
DOI:10.1175/1520-0485(2003)033<1027:TPCTAP>2.0.CO;2 |
Steger J M, Collins C A, Chu P C. 1998. Circulation in the archipiélago de colón (Galapagos Islands), November, 1993. Deep Sea Research Part II: Topical Studies in Oceanography, 45(6): 1093-1114.
DOI:10.1016/S0967-0645(98)00015-0 |
Stevenson M R, Taft B A. 1971. New evidence of the equatorial undercurrent east of the Galapagos Island. Journal of Marine Research, 29(2): 103-115.
|
Strub P T, Mesias J M, Montecino V, Rutllant J. 1998. Coastal ocean circulation off western South America. Coastal segment. In: Robinson A R, Brink K H eds. The Sea. Wiley, Hoboken. p. 273-314.
|
Toggweiler J R, Dixon K, Broecker W S. 1991. The Peru upwelling and the ventilation of the South Pacific thermocline. Journal of Geophysical Research: Oceans, 96(C11): 20467-20497.
DOI:10.1029/91JC02063 |
Ubelmann C, Fu L L. 2011. Vorticity structures in the tropical Pacific from a numerical simulation. Journal of Physical Oceanography, 41(8): 1455-1464.
DOI:10.1175/2011JPO4507.1 |
White W B. 1969. The Equatorial Undercurrent, the South Equatorial Countercurrent, and their extensions in the south Pacific Ocean east of the Galapagos Islands during February-March, 1967. Texas A & M University, College Station. p. 74.
|
White W B. 1973. An oceanic wake in the Equatorial Undercurrent downstream from the GalapagosArchipelago. Journal of Physical Oceanography, 3(1): 156-161.
DOI:10.1175/1520-0485(1973)003<0156:AOWITE>2.0.CO;2 |
Wooster W S, Gilmartin M. 1961. The Peru-Chile undercurrent. Journal of Marine Research, 19(3): 97-122.
|
Wyrtki K. 1963. The horizontal and vertical field of motion in the Peru current. Bulletin of the Scripps Institution of Oceanography, University of California, San Diego, 8(4): 313-344.
|
Wyrtki K. 1966. Oceanography of the eastern equatorial Pacific Ocean. Oceanography and Marine Biology: An Annual Review, 4: 33-68.
|
Wyrtki K. 1967. Circulation and water masses in the eastern equatorial Pacific Ocean. International Journal of Oceanology and Limnology, 1: 117-147.
|
Wyrtki K. 1981. An estimate of equatorial upwelling in the Pacific. Journal of Physical Oceanography, 11(9): 1205-1214.
DOI:10.1175/1520-0485(1981)011<1205:AEOEUI>2.0.CO;2 |
Yu X R, McPhaden M J. 1999a. Seasonal variability in the equatorial Pacific. Journal of Physical Oceanography, 29(5): 925-947.
DOI:10.1175/1520-0485(1999)029<0925:SVITEP>2.0.CO;2 |
Yu X R, McPhaden M J. 1999b. Dynamical analysis of seasonal and interannual variability in the equatorial Pacific. Journal of Physical Oceanography, 29(9): 2350-2369.
DOI:10.1175/1520-0485(1999)029<2350:DAOSAI>2.0.CO;2 |
Zuta S, Rivera T, Bustamante A. 1978. Hydrologic aspects of the main upwelling areas off Peru. In: Boje R, Tomczak M eds. Upwelling Ecosystems. Springer, Berlin. p. 235-257.
|