 2022, Vol. 40
Institute of Oceanology, Chinese Academy of Sciences
Article Information
- CHEN Tingjun, LI Zhimin, LIU Jianyong, LIANG Caifeng, YUAN Le
- Transcriptome of hepatopancreas in kuruma shrimp Marsupenaeus japonicus under low-salinity stress
- Journal of Oceanology and Limnology, 40(2): 745-765
- http://dx.doi.org/10.1007/s00343-021-0444-z
Article History
- Received Dec. 3, 2020
- accepted in principle Mar. 2, 2021
- accepted for publication Apr. 8, 2021


2 Guangdong Provincial Shrimp Breeding and Culture Laboratory, Guangdong Ocean University, Zhanjiang 524088, China
The kuruma shrimp Marsupenaeus japonicus is one of the most commercially important shrimp species worldwide, distributed in Japan, the South China Sea, and the Indo-West Pacific (Hamasaki and Kitada, 2008; Tsoi et al., 2014). The adaptability of M. japonicus to salinity is relatively poor, the suitable salinity range is 15-30, the survival salinity is 7-35, and it is difficult to survive below 7 (Weng et al., 2012). Due to its advantages of rapid reproduction, tolerance to low temperature and long-distance transport capacity, this species has become one of the most important shrimp species in China's coastal waters (Paterson, 1993; Duan et al., 2016). In 2016, the production of M. japonicusin China was 55 885 t (http://www.fao.org/home/en/). In recent decades, there have been many studies on M. japonicus, and mostly concerned about the life activities (Chen and Lai, 1993; Hewitt and Duncan, 2001), cultivation mode (Cheng and Chen, 2001; Li et al., 2014b), environmental stress (Coman et al., 2002; Lee and Chen, 2003), and molecular biology (Lin et al., 2008; Leu et al., 2011). Recently, production of M. japonicus has declined; in particular, production was approximately 2 000 t less in 2017 than in 2016 (http://www.fao.org/home/en/). This decrease may be related to the broodstock of M. japonicus collected from wild populations, which exhibit poor stress resistance (Liu et al., 2019). The another, it may be the environmental stress, which combined with a bottom environment rich in ammonia nitrogen and nitrite nitrogen in farms undergoing a series of environmental changes (Cheng et al., 2004, 2013), such as salinity (Setiarto et al., 2004), temperature (Lu et al., 2016), and dissolved oxygen (Chien and Shiau, 2005).
Salinity is one of the most important environmental factors affecting the survival of aquatic organisms (Heugens et al., 2001; Hop et al., 2002; Laing, 2002; Chong-Robles et al., 2014). With the rapid change of the global marine environment, ocean warming (Johnson et al., 2011), typhoon activity (Balaguru et al., 2016), tide movement (Kourafalou et al., 1996) and other natural and human factors can cause the decrease of the salinity of the natural sea water, which has a great impact on aquatic organisms. Low salinity stress has been reported in many shrimps, such as Litopenaeus vannamei (McGraw et al., 2002), Fenneropenaeus chinensis (Liu et al., 2006), Penaeus monodon (Ye et al., 2009), and M. japonicus (Via, 1986). Low salinity affected the growth and survival of prawn, and the survival rate decreased significantly with the decrease of salinity (Via, 1986; McGraw et al., 2002; Ye et al., 2009).In addition, low salinity affected osmotic regulation (McNamara et al., 2015; Fregoso-López et al., 2017) and immune regulation (Lin et al., 2012). For example, M. japonicus and L. vannamei are susceptible to white spot virus and Vibrio alginolyticus under low-salinity conditions (Yu et al., 2003; Wang and Chen, 2005; Li et al., 2010), which may be due to shrimp consuming a large amount of stored energy to regulate osmotic pressure in vivo, leading to an increase in metabolic rate and decreases in growth rate and stress tolerance upon salinity change (Ingram et al., 2002; Setiarto et al., 2004). To clarify the osmotic regulation mechanism used by shrimp under low-salinity conditions, molecular research has intensified, including studies using gene cloning (Tiu et al., 2007; Meng et al., 2011; Rajesh et al., 2012), suppression subtractive hybridization (Gao et al., 2012; Shekhar et al., 2013), transcriptome sequencing (Hu et al., 2015), proteomics (Fan et al., 2019), and digital gene expression techniques (Zhao et al., 2015). Among these methods, transcriptome sequencing has been used most widely. Unfortunately, there is still a lack of research on low salt molecules of M. japonicus, the specific mechanism of osmotic and immune regulation remains unknown.
Transcriptome sequencing can be used for accurate quantification of the expression of various RNA molecules, such as mRNAs, lncRNAs, and microRNAs, in different tissues, developmental stages, and disease states, to characterize complex molecular pathways and differential gene expression patterns (Brawand et al., 2011; He et al., 2012; Zhao et al., 2012; Park et al., 2013; Kornienko et al., 2016; Ludwig et al., 2016). To date, the transcriptomes of several prawn species, including Litopenaeus vannamei (Li et al., 2012), Fenneropenaeus chinensis (Li et al., 2013), Fenneropenaeus merguiensis (Powell et al., 2015), and Macrobrachium rosenbergii (Jung et al., 2011), have been sequenced. Those studies focused mainly on development, immunity, and osmotic regulation in shrimp. Previous studies have shown that the main osmotic regulator of shrimp is the gill (Shekhar et al., 2013; Hu et al., 2015). However, recent studies have found that the hepatopancreas is also involved in osmotic regulation (Chen et al., 2015). The hepatopancreas is the main organ responsible for not only the digestion, metabolism, absorption, and storage of nutrients in decapod crustaceans but also for energy metabolism under low-salinity stress (Wang et al., 2014b; Zhang et al., 2016). The purpose of this study is to evaluate transcript levels in the hepatopancreas of M. japonicus under low-salinity stress for different periods using transcriptome sequencing, identifying the pathways related to osmotic regulation, immune response, detoxification, and apoptosis, and revealing differentially expressed genes (DEGs) involved in low-salinity stress. The results not only enrich the information of shrimp cDNA database, but also provide important molecular evidence for breeding improved strains of M. japonicus in the future.
2 MATERIAL AND METHOD 2.1 Salinity challenge and sample preparationA 120-day-old mixed family of M. japonicus with an average body length of 49.28±4.79 mm and average body weight of 1.39±0.38 g was obtained from Guolian Aquatic Limited Company, Guangdong Province, China. Before the experiment, the shrimp were acclimated in a cement pond in 28±0.2 ℃, salinity 29.8±0.2, and dissolved oxygen 6.0 mg/L for 7 days to reduce any stress response. In the preliminary experiment, the adaptability of M. japonicas to low salinity was studied. The results show that the survival rate of M. japonicus was 80% for 96 h in salinity 8. Thus, we determined that the salinity of low salt stress was 8 in this study. The shrimp were divided into the control group (CG) and low-salinity group (LS). Salinity was regulated by mixing seawater with disinfected tap water, and the low-salinity and control groups were exposed to salinities of 8 and 29.8±0.2, respectively. Three experimental replicates were performed per group. A 1 500-L plastic bucket was used for the experiment, and all other experimental conditions were consistent with the domestication conditions. No food was given during the experiment, which lasted 96 h, with salinity determined every 6 h to maintain a constant level. The hepatopancreas was collected from 9 shrimp of each group at the 6th, 12th, 24th, 48th, and 96th h and stored in an enzymatic centrifuge tube containing 1-mL RNA stabilization solution. The samples were stored overnight at 4 ℃ and then held at 20 ℃ until RNA extraction.
2.2 RNA extraction and Illumina sequencingTotal RNA from the hepatopancreases was extracted using TRIzol reagent (Invitrogen) according to the manufacturer's instructions. RNA degradation and contamination were monitored by 1% agarose gel electrophoresis. RNA purity was checked using the NanoPhotometer® spectrophotometer (Implen, CA, USA). The RNA concentration was measured using the Qubit® RNA Assay Kit and Qubit®2.0 fluorometer (Life Technologies, CA, USA). RNA integrity was assessed using the RNA Nano 6000 Assay Kit of the Bioanalyzer 2100 system (Agilent Technologies, CA, USA) (Hu et al., 2015). Ten libraries were constructed, five from the low-salinity group at each time point (LS6, LS12, LS24, LS48, and LS96) and five from the control group at each time point (CG6, CG12, CG24, CG48, and CG96). These 10 libraries were generated using the NEBNext® UltraTM RNA Library Prep Kit for Illumina® (NEB, USA) following the manufacturer's recommendations, and index codes were added to identify the sequences expressed in each sample. The total RNA content of each sample was 3 μg. Finally, PCR products were purified (The Agencourt AMPure XP system, Beckman Coulter, Brea, CA, USA), and the library quality was assessed on the Agilent Bioanalyzer 2100 system. Clustering of the index-coded samples was performed on the cBot Cluster Generation System using the TruSeq PE Cluster Kit v3-cBot-HS (Illumina) according to the manufacturer's instructions. After cluster generation, library preparation was carried out on the Illumina Hiseq platform, and 125–150 bp paired-end reads were generated (Fu and Zou, 2018).
2.3 Bioinformatics analysis of the transcriptome data 2.3.1 Sequencing data filtering and assemblyRaw data (raw reads) in the fastq format were first processed using in-house Perl scripts. In this step, clean data (clean reads) were obtained by removing reads containing adapter sequences or poly-N sequences and low-quality reads (The base number of the qphred≤20 accounts for more than 50% of the total reads) from the raw data. At the same time, the Q20, Q30, and GC content of the clean reads were calculated, respectively. All downstream analyses were based on high-quality clean reads (Li et al., 2020). Clean reads were assembled with Trinity (Grabherr et al., 2011). Briefly, Trinity is an efficient and stable transcriptome splicing software developed by Broad Institute and Hebrew University of Jerusalem for RNA-seq data. It combines three independent software modules (Inchworm, Chrysalis, and Butterfly) to process and splice a large number of RNA-seq. The main process was as follows: By software Inchworm, first, all the fq files of the read were read and converted into the fa format read files, and then merged the 3′-end reads and 5′-end reads to obtain both.fa. The reads were decomposed by kmers (short fragment of k-bp length), and the types of k-mers and the number of k-mers of each type were counted, and then sorted from high to low by the frequency of k-mers. The k-mer with the highest frequency, as a seed, was extended to 3′-end. The frequency of each k-mer after the extension was counted. The k-mer with the highest frequency was selected as the extension path. Finally, following the greedy algorithm, the k-mers were extended by the overlap relationship to form the contig sequence. Using software Chrysalis, all contigs with similar regions more than k–1-mers were clustered to form components. The de Bruijn graph was constructed according to different components, and meantime, the reads and components were compared and verified. With the software Butterfly, the transcripts were listed, and the graph was split into linear sequence. The error sequence was eliminated by the read and pairs relationship, and the de Bruijn graph of each component was simplified. The full-length transcripts of the variable splicing subtypes were output, and the transcripts corresponding to the paralogous genes were sorted out. Finally, the splicing result file is obtained and named as TRINITY. fasta.
2.3.2 Annotation of gene functions and differential expression analysisGene functions were annotated based on the following databases: National Center for Biotechnology Information non-redundant protein (NR) and nucleotide sequences (NT), Pfam (protein family database), Clusters of Orthologous Groups of proteins (KOG/COG), Swiss-Prot (a manually annotated and reviewed protein sequence database), Kyoto Encyclopedia of Genes and Genomes (KEGG) (Kanehisa et al., 2007), KEGG Orthology database (KO) (Mao et al., 2005), and gene ontology (GO) databases (Young et al., 2010).
Clean reads were aligned to transcriptome sequences by bowtie2 (Langmead et al., 2009), and the alignment results of bowtie were counted by RSEM (http://deweylab.biostat.wisc.edu/rsem/) (Li and Dewey, 2011). The read counts of each sample aligned to each gene were obtained, and the FPKM conversion were carried out (Trapnell et al., 2010). Read counts for each sequenced library were adjusted using the edgeR v.3.0.8 package of R software and a normalization scaling factor, TMM was used to standardize the read count data, and the DEGs between LS groups and CG groups were analyzed with DEGseq R package. Differential genes were determined by combining q value (q value≤0.05) and fold change (|log2FC(sample2/sample1)|≥1). P values were adjusted using q values. A q value of 1 was set as the threshold for defining significant differential expression (Wang et al., 2010).
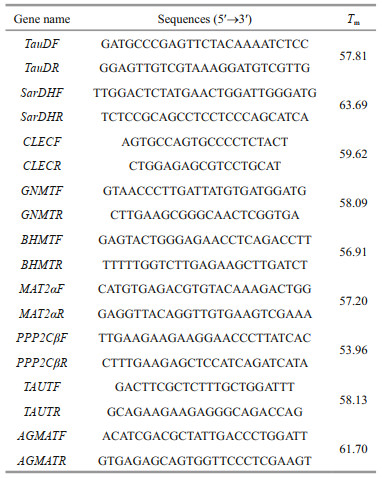
2.4 Validation of mRNA-seq data using quantitative real-time PCR (qPCR)Nine DEGs from five libraries were randomly selected, including taurine catabolism dioxygenase (TauD), sarcosine dehydrogenase mitochondrial isoform X1 (SarDH), C-type lectin (CLEC), glycine N-methyltransferase (GNMT), betaine-homocysteine S-methyltransferase (BHMT), methionine adenosyltransferase II alpha (MAT2α), serine/ threonine-protein phosphatase 2A catalytic subunit beta isoform (PPP2Cβ), taurine transporter (TAUT), and agmatinase mitochondrial-like (AGMAT) were confirmed by qPCR. Using TransStart Tip Green SuperMix (Beijing TransGen Biotech Co., Ltd.) and performed on the Light Cycler 480II (Roche) thermal cycler according to the manufacturer's instructions. Elongation factor 1α (EF1α) was used as the reference gene, and each gene amplification was performed in three wells. Gene-specific primers were designed using Premier 5 (Table 1). Amplification was performed in a 384-well plate in a 10-μL reaction volume containing 1-μL cDNA, 0.2 μL each of the gene-specific forward and reverse primers, 5-μL TransStart Tip Green qPCR SuperMix and 3.6-μL RNase-free water. The thermal profile for the PCR was 94 ℃ for 30 s followed by 45 cycles of 94 ℃ for 5 s, 60 ℃ for 15 s and 72 ℃ for 10 s. The results are presented as the change in relative expression normalized to the reference gene (EF1α) using the 2-ΔΔCt method. The data was mean±SD, and the difference was statistically significant (P < 0.05) by one-way ANOVA in SPSS19.0.
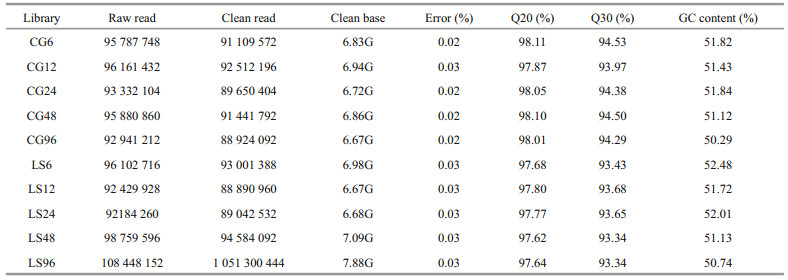
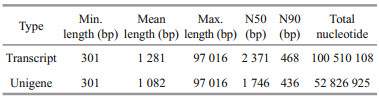
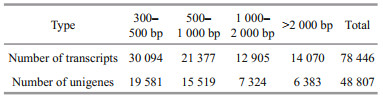
After transcriptome sequencing, 92 184 260– 108 448 152 raw reads were generated from the 10 libraries prepared from the control and low-salinity groups. After removing the reads containing adapter sequences or poly-N sequences and low-quality reads from the raw reads, 88 890 960–1 051 300 444 clean reads were obtained, the data volume is 6.67G–7.88G, the GC contents of the raw data were 50.29%–52.48%, the Q20 percentages were 97.62%–98.11%, and the Q30 percentages were 93.34%–94.53% (Table 2). Using the Trinity to assemble the obtained clean reads, and after removing the redundancy, 48 807 unigenes were obtained from 52 826 925 nucleotides. N50 and N90 were 1 746 bp and 436 bp, respectively, with an average length of 1 082 bp (Table 3). According to the length distribution statistics of the assembled unigenes, the minimum length is 301 bp; there are 19 581 unigenes distributed between 300– 500 bp, accounting for 40.12% of the total, with the largest number; there are only 6 383 unigenes more than 2 000 bp, accounting for 13.08% of the total (Table 4; Fig. 1).

|
| Fig.1 Unigenes length distribution of spliced transcripts |
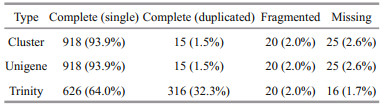
We used BUSCO to evaluate the splicing quality of unigenes, and compared with the conservative genes to evaluate the accuracy and integrity of the splicing results. The results showed that 978 BUSCO were completely covered, and 918 (93.9%), 15 (1.5%), 20 (2.0%), and 25 (2.6%) unigenes were completely matched, including complete and single copy, complete and duplicated, partial fragment, and missing, respectively (Table 5; Fig. 2). These data greatly enrich the genetic resources available for M. japonicus, which may facilitate further molecular studies of M. japonicus under low-salinity conditions for various periods.

|
| Fig.2 BUSCO evaluation results of splicing transcript Different colors represent different splicing transcript types. C represent complete copy, including complete and single-copy (S) and complete and duplicated-copy (D). F represent fragmented unigenes, M represent missing unigenes and n represent number of unigenes completely covered by BUSCO. |
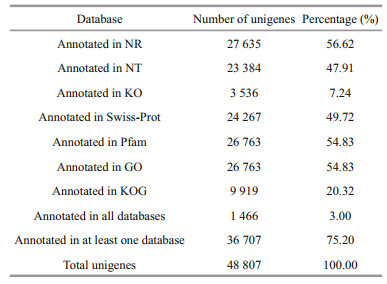
A total of 48 807 unigenes were annotated by NR, NT, KO, Swiss-Prot, Pfam, GO, and KOG. The number of unigenes annotated to at least one database in seven databases is 36 707, accounting for 75.20% of the total, while the number of unigenes annotated to all seven databases is 1 466, only accounting for 3.00% of the total (Table 6). Among them, in the light of the analysis of species sources, 31.6%, 14.4%, and 6.6% of the transcript data compared to the NR database were annotated to the top 3 species, Hyalella azteca, M. japonicus, and Litopenaeus vannamei (Fig. 3).

|
| Fig.3 NR database species annotation The abscissa represents the species ID, and the ordinate indicates the number of transcripts on the annotation. |
According to the GO annotation of unigenes, 26 763 unigenes obtained GO annotation, accounting for 54.83% of the total. The annotation can be divided into three categories: biological process (BP), molecular function (MF), and cell component (CC). In the biological process, the most involved are cell process (56.80%), metabolism process (52.31%), and single cell tissue process (49.19%). In the cell component, cell part, cell, and membrane account for 26.49%, 26.49%, and 20.20% of the total, respectively. In molecular function, it is mainly related to binding and catalytic activity, accounting for 47.56% and 46.31% of the total, respectively (Fig. 4).

|
| Fig.4 GO annotation classification statistics |
A total of 9 919 (20.32%) unigenes were successfully annotated in the KOG database and classified according to 26 KOG, among which the most unigenes annotated to R (general function prediction) accounted for 14.30% of the total, followed by O (post translation modification, protein transformation, and molecular chaperone), T (signal transduction mechanism), E (amino acid transport and metabolism), accounting for 9.87%, 9.17%, and 8.56% of the total, respectively. However, X (unnamed protein) accounts for only 0.02% of the total, with the least annotated unigenes (Fig. 5).

|
| Fig.5 Classification statistics of KOG notes |
After KO annotation of 3 536 (7.24%) unigenes, according to the KEGG metabolic pathway involved by unigenes, there were 485 (13.72%), 427 (12.08%), 553 (15.64%), 2 006 (56.73%), and 795 (22.48%) unigenes involved in the A, B, C, D, and E (cellular processes, environmental information processing, genetic information processing, metabolism, and organismal systems) of KEGG metabolic pathway, respectively Middle branch. Among all pathways, the most abundant unigenes were 395 (11.17%) in carbohydrate metabolism. Secondly, there are 351 and 337 unigenes in amino acid metabolism and signal transduction, respectively, accounting for 9.93% and 9.53% of the total (Fig. 6).

|
| Fig.6 Classification statistics of KEGG metabolic pathway The vertical coordinate in the figure is the name of KEGG metabolic pathway, and the horizontal coordinate is the number of genes annotated to the pathway and the proportion of the number of genes annotated to the total number of genes annotated. A: cellular processes; B: environmental information processing; C: genetic information processing; D: metabolism; E: organismal systems. |
The annotated genes in the control and low-salinity groups were screened to obtain DEGs. A total of 811, 589, 1 095, 745, and 875 DEGs were identified in the LS6, LS12, LS24, LS48, and LS96 libraries compared with the CG6, CG12, CG24, CG48, and CG96 libraries, respectively (Fig. 7). More genes were upregulated than down-regulated among all of the DEGs in 6 h, with approximately double the number of upregulated than down-regulated genes. However, the number of down-regulated genes exceeded the number of up-regulated genes in 12 h, 48 h, and 96 h.

|
| Fig.7 Volcano map of DEGs The scattered dots in the figure represent each gene, the blue dots indicate genes with no significant difference, the red dots indicate up-regulated genes with significant difference, and the green dots indicate down-regulated with significant difference. |
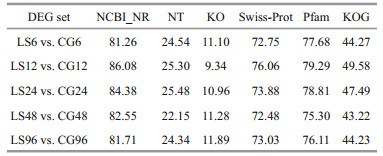
For DEG annotation, a total of 811, 589, 1 095, 745, and 875 genes in the LS6, LS12, LS24, LS48, and LS96 groups, respectively, were identified using the NR, NT, KO, Swiss-Prot, Pfam, and KOG databases (Table 7). The percentage is ranked as NR > Pfam > Swiss-Prot > KOG > NT > KO, of which the percentages of NR were all greater than 80%, while those of the KO database were 9.34%–11.89%.
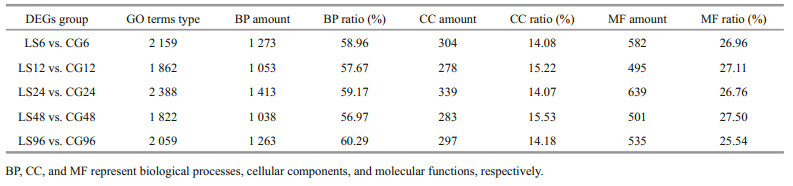
The DEGs from the comparisons of LS6 vs. CG6, LS12 vs. CG12, LS24 vs. CG24, LS48 vs. CG48, and LS96 vs. CG96 were analyzed based on GO enrichment and classified according to the three major GO categories: biological processes, cellular components, and molecular functions. There are 1 822–2 388 GO terms types. DEGs are the most abundant in biological processes, accounting for 56.97%–60.29% of the total, followed by molecular function (Table 8). Among the numerous biological processes represented, metabolic processes were the best represented. Chitin metabolic process (GO: 0006030), glucosamine-containing compound metabolic process (GO: 1901071), and amino sugar metabolic process (GO: 0006040) were the most commonly enriched among the groups. Only the LS6 vs. CG6, LS24 vs. CG24, and LS48 vs. CG48 comparisons showed significant enrichment of cellular component-related DEGs, with most related to extracellular components and the nucleosome. In addition, genes related to chitin and iron binding were significantly enriched in all groups among molecular functions (Fig. 8).

|
| Fig.8 Go enrichment of differential genes at five different time points BP, CC, and MF represent biological processes, cellular components, and molecular functions, respectively. |
DEGs were mapped to KEGG pathways to confirm the biological pathways activated or repressed during the response of M. japonicus to low salinity. A total of 151, 85, 149, 97, and 111 KEGG pathways were enriched among the DEGs identified in the LS6 vs. CG6, LS12 vs. CG12, LS24 vs. CG24, LS48 vs. CG48, and LS96 vs. CG96 comparisons, respectively, among which the first 20 significantly enriched pathways are shown (Fig. 9). The results show that metabolic pathway and immune pathway were significantly enriched, which may play important roles related to salinity stress include the Linoleic acid metabolism (ko00591), Arachidonic acid metabolism (ko00590), Sphingolipid metabolism (ko00600), AMPK signaling pathway (ko04152), Sphingolipid signaling pathway (ko04071), Lysosome (ko04142), and TGF-beta signaling pathway (ko04350).

|
| Fig.9 KEGG pathway enrichment of the differentially expressed genes |
Nine DEGs were selected to verify the RNA-seq results in the comparisons of the experimental (LS6, LS12, LS24, LS48, and LS96) and control (CG6, CG12, CG24, CG48, and CG96) groups using qPCR. The qPCR results showed that the trends in DEG variations were consistent with the RNA-seq results, verifying the accuracy of RNA-seq (Fig. 10). According to qPCR, TauD, SarDH, CLEC, GNMT, BHMT, MAT2α, and PPP2Cβ showed up-regulation in the control group, whereas TAUT and AGMAT showed down-regulation in the control group.

|
| Fig.10 Expression of the selected nine genes verified by RNA-Seq and RT-qPCR *: P<0.05; **: P<0.01. |
Decapod crustaceans exhibit a wide range of osmoregulatory patterns and capabilities (McNamara and Faria, 2012). In the low ionic freshwater environment, decapods face four major osmoregulation challenges simultaneously: absorbing ions from food and the surrounding water, minimizing diffusive ion loss via semi-permeable membranes, restricting incoming water flux and regulating cell volume decreases to maintain cellular stability. These osmotic and ionic regulation processes are conducted mainly in the gills (Freire et al., 2008; Furriel et al., 2010; Rahi et al., 2017). Numerous enzymes and transporters are involved in ion transport in crustacean gills, including Na+/K+-ATPase, V (H+)-ATPase, carbonic anhydrase and Na+/K+/2Cl cotransporter (Weihrauch et al., 2001; Tsai and Lin, 2007; Furriel et al., 2010; Havird et al., 2013). Interestingly, we found three biological processes related to osmotic regulation in the LS12 vs. CG12 comparison of M. japonicus under low-salinity stress: energy-coupled proton transmembrane transport (GO: 0015988), ATP hydrolysis-coupled transmembrane transport (GO: 0090662) and ATP hydrolysis-coupled transport proton (GO: 0015991). These three processes were enriched among the DEGs identified at the 12th h only, and almost all of these DEGs were down-regulated. This result shows that the hepatopancreas of M. japonicus was involved in osmotic regulation, via inhibition of the ion transport process, under low-salinity stress for 12 h. We found significant differences in two DEGs: V (H+)-ATPase and V-H-ATPase subunits. V (H+)-ATPases are a family of membrane-related ATP-dependent proton pump enzymes. When located in the plasma membrane, these proteins couple the energy released during ATP hydrolysis with active transport of protons from the cytoplasm to intracellular or extracellular spaces (Forgac, 2007). The V1 region of V (H+)- ATPases contains eight different subunits (A–H), with catalytic sites located at the interface between the A and B subunits participating in ATP hydrolysis (Jefferies et al., 2008). When L. vannamei was moved from seawater with a salinity of 20 to water with a salinity of 5, the expression of V-H-ATPase subunit A in the gills was increased at approximately 12 h after the change in salinity, whereas that of V-H-ATPase subunit A in the hepatopancreas was decreased (Wang et al., 2012). In this study, we found that the expression levels of V(H+)-ATPase and V-H-ATPase subunits were down-regulated in 12 h, similar to previous findings in L. vannamei. We speculate that the hepatopancreas of M. japonicus inhibits H+ transport from the intracellular to extracellular space as an adaptation to hypoosmotic stress. The specific reason for this response remains to be explored.
The ion transporter Na+/K+-ATPase alpha subunit was also differentially expressed in the LS24 vs. CG24 comparison. Ion absorption by crustaceans is achieved mainly via the Na+/K+-ATPase (Lucu and Towle, 2003). The Na+/K+-ATPase is located in the basolateral membrane of gill ion-transport epithelial cells. The establishment of an electrochemical gradient shows that the Na+/K+-ATPase is the main force driving ion transport (Towle and Kays, 1986). The Na+/K+-ATPase maintains a gradient of excess Na+ outside and excess K+ inside the cell, and this gradient is used as an energy source to create a membrane potential for regulating cytoplasmic composition and transepithelial transport (Skou and Esmann, 1992; Suhail, 2010). Expression of the Na+/ K+-ATPase alpha subunit gene in the hepatopancreas was increased under hypoosmotic stress, but the transcript level of this gene was down-regulated in 24 h, which was not consistent with previous research (Li et al., 2015). This pattern may result from the differences of species, and the specific reasons require further exploration.
4.2 Lipid metabolism and glucose metabolism related to osmotic regulation under salt stressUnder low-salinity stress, shrimp require additional saturated and polyunsaturated fatty acids to maintain their osmotic regulation and ion exchange, and this process involves high-energy consumption (Chen et al., 2014, 2019). A number of lipid metabolic pathways in the hepatopancreas of L. vannamei are affected by salinity stress, including fatty-acid biosynthesis, arachidonic acid metabolism, adipocytokine signaling, and glycerophospholipid metabolism (Chen et al., 2015). Fatty acid metabolism and arachidonic acid metabolism are also related to osmotic regulation in Eriocheir sinensis (Li et al., 2014a). In this study, enrichment of DEGs associated with linoleic acid metabolism (ko00591) and arachidonic acid metabolism (ko00590) was found in the comparisons of LS6 vs. CG6, LS24 vs. CG24, LS48 vs. CG48, and LS96 vs. CG96, and most of these DEGs were up-regulated. We speculate that lipid metabolism in the hepatopancreas (the main organ of fat production) and lacrimal secretion are increased in M. japonicus. Acceleration of synthetic renewal can provide enough energy for osmotic regulation in shrimp at low salinity. Previous studies have revealed two major strategies for osmotic regulation in crustaceans, the "limiting process" and "compensatory process", which are carried out mainly by the gills. The limiting process is a strategy to maintain hemolymph osmotic pressure and ions in branchial membranes by adjusting the permeability of boundary structures, which can effectively reduce ion diffusion and water inflow (Péqueux, 1995; Rainbow and Black, 2001). Our results suggest that the strategy of the limiting the process may play an important role in osmotic regulation in M. japonicus, which is similar to that in Portunus trituberculatus (Lv et al., 2013) and L. vannamei (Chen et al., 2019).
Energy metabolism plays an important role in survival and normal body functions, as well as in stress adaptation and tolerance (Sokolova et al., 2012). In this study, we found that glycometabolism was significantly affected by low-salinity stress in M. japonicus, with changes in fructose and mannose metabolism (ko00051), sphingolipid metabolism (ko00600), and other glycan degradation (ko00511) pathways and significant up-regulation of the glucosamine-containing compound metabolic process (GO: 1901071), amino sugar metabolic process (GO: 0006040), and aminoglycan metabolic process (GO: 0006022) terms in all groups. DEGs related to glycometabolism in the hepatopancreas of L. vannamei were more represented at a salinity of 3 than in the control in terms of gluconeogenesis, amino sugar and nucleotide sugar metabolism, glycosphingolipid biosynthesis, glycosaminoglycan degradation, and other glycan degradation, suggesting a requirement for extra energy by L. vannamei under chronic low-salinity stress, which is usually derived from the metabolism of nutrient substances (Xu et al., 2017). Therefore, we speculate that the active glycometabolism of M. japonicus under low-salinity stress is an adaptation to maintain osmotic regulation. Fructose-1, 6-bisphosphate aldolase is a key enzyme involved in glycolysis and gluconeogenesis. It is ubiquitously expressed in animals, plants and microorganisms (De-Simone et al., 2006; Lu et al., 2012; Dawson et al., 2013). In this study, fructose- 1, 6-bisphosphate aldolase was up-regulated at the 6th h and then returned to a normal level, reflecting an increase in glycometabolism during the early stage of low-salinity stress in M. japonicus. Previous studies have shown that supplementation with appropriate carbohydrates can improve the stress resistance of L. vannamei to low salinity (Wang et al., 2014c). Carbohydrate metabolism appears to play a major role in the energy supply for iono- and osmoregulation, and the liver is the main source of carbohydrate metabolites for osmoregulatory organs (Tseng and Hwang, 2008). Up-regulation of related genes indicated that carbohydrate metabolism was increased to provide more energy during the early stage of low-salinity stress in M. japonicus. We identified a DEG, alpha-amylase (alpha-1, 4-glucanglucanohydrolase), that was significantly associated with carbohydrate metabolism. Alpha-amylase belongs to the glycosyl hydrolase family 13, and it is a major carbohydrate hydrolase involved in the digestive functions of the liver and pancreas in shrimp (Kuriki and Imanaka, 1999; Glenn et al., 2005). In this study, alpha-amylase expression returned to normal after 6 h of up-regulation and then was downregulated after 24 h. Therefore, we speculate that this gene is related to low-salinity stress in M. japonicus, and that the hydrolysis of carbohydrates is increased as an adaptation to osmotic regulation during the early stages of stress. In addition, we found that phosphoenolpyruvate carboxykinase expression was increased significantly at 6, 12, and 24 h, after which it returned to normal, indicating that phosphoenolpyruvate carboxykinase is involved in the early stage of low-salinity stress in M. japonicus.
4.3 Immunity under low-salinity stressLow-salinity stress can reduce the immunity of M. japonicus and increase its sensitivity to viral infection (Yu et al., 2003). KEGG analysis showed that the DEGs identified at 48 h were enriched in the Chagas disease (American trypanosomiasis) (ko05142) and Vibrio cholerae infection (ko05110) pathways, and most of these DEGs were downregulated, suggesting that M. japonicus is more resistant to pathogens under low-salinity stress. Shrimp lack an acquired immune system, and its innate immune system is divided into humoral immunity and cellular immunity. Shrimp are thought to be totally dependent on a congenital and nonadaptive mechanism to resist pathogen invasion (Li and Xiang, 2013; Tassanakajon et al., 2013; Wang et al., 2014a). KEGG analysis showed that the DEGs were enriched in lysosome (ko04142), peroxisome (ko04146), phagosome (ko04145), and apoptosis (ko04210) pathways related to cellular immunity, consistent with the changes in pathways identified previously in the L. vannamei hepatopancreas under low-salinity stress (Xu et al., 2017). Immune-related genes such as calnexin involved in the phagosome (ko04145) and cathepsin A involved in the lysosome (ko04142) showed significantly down-regulated expression in response to low-salinity stress, suggesting that low-salinity stress reduced phagocytosis and oxygen-independent reactivity in phagocytes of L. vannamei (Zhao et al., 2015). In this study, cathepsin C and lysosomal alpha-mannosidase in the lysosome (ko04142) and calreticulin in the phagosome (ko04145) were significantly downregulated. Of these genes, cathepsin C returned to normal after 12 h of down-regulation, lysosomal alpha-mannosidase returned to normal after 6 hours of down-regulation, and calreticulin was down-regulated only during the late stage (after 48 h) of stress, indicating that these genes are involved in different stages of cellular immunity and reduce the phagocytic capacity of shrimp. Apoptosis is a genetically programmed cell suicide process that eliminates unwanted or diseased cells and plays important roles in embryogenesis, homeostasis, insect metamorphosis and immunity (Steller and Grether, 1994; Opferman and Korsmeyer, 2003). Cytochrome C is a proapoptotic factor that is released from the outer surface of the inner mitochondrial membrane during the early stage of apoptosis. In combination with certain cytosolic proteins, it induces conversion of the latent apoptosis-promoting protease pro-caspase 9 into its active form (Skulachev, 1998; Marsden et al., 2002). In this study, we found that cytochrome C, involved in the apoptosis (ko04210) signaling pathway, was upregulated at 6 h; this is consistent with its previously reported up-regulation in L. vannamei infected with WSSV, indicating that cytochrome C may be induced by low-salinity stress to participate in apoptosis (Hu and Yao, 2016). Interestingly, we found that caspase 3 was down-regulated at 6 h, suggesting that M. japonicus responds to low-salinity stress by inhibiting caspase 3 and thus preventing apoptosis.
The humoral response includes the prophenoloxidase (proPO) system, hemolymph coagulation, and a variety of antimicrobial peptides (Li and Xiang, 2013; Tassanakajon et al., 2013; Wang et al., 2014a). Melanization is regulated by phenoloxidase (PO), which is activated by the proPO cascade control and plays an important role in the immune system of invertebrates, responding quickly to pathogen infection (Amparyup et al., 2013). Prophenoloxidase b has been shown to contribute to PO activity in crustacean hemolymph plasma (Masuda et al., 2012). We found that prophenoloxidase b was increased significantly at 12 and 24 h in oxidoreductase activity (GO: 0016491), suggesting that prophenoloxidase b promotes humoral immune regulation in M. japonicus under low-salinity stress. proPO activation and Toll pathway initiation in arthropods are mediated by serine proteinase cascades and regulated by serpins in the hemolymph (Liu et al., 2009). Injecting rPmSERPIN3 along with Vibrio harveyi into shrimp decreased the clearance rate of bacteria from the hemolymph, suggesting that PmSERPIN3 functions as a regulator of the proPO activation system (Wetsaphan et al., 2013). We found that the expression of serpin 3 was up-regulated after 6 hours of stress. We speculate that serpin 3 promotes activation of proPO and the Toll pathway during the early stage of low-salinity stress. In addition, antilipopolysaccharide factor 2, an antimicrobial peptide, was down-regulated in 6 and 12 h, indicating that anti-lipopolysaccharide factor 2 is also involved in immune regulation.
4.4 Chitin metabolic process under salt stressNotably, the level of GO enrichment of DEGs related to chitin metabolism (q value: 6.4593E-10) was the highest among all metabolic processes. This indicates that chitin metabolism may be involved in osmotic regulation or affected by salinity stress, supporting the results of a salinity stress-based transcription analysis conducted in Portunus trituberculatus (Lv et al., 2013). In addition, we found DEGS in the control and low-salinity groups about the chitinase 1, peritrophin and peritrophin-like protein genes. In total, seven, five, and three chitinases were identified in L. vannamei, Penaeus monodon and M. japonicus, respectively. This study showed agreement that chitinase 1 is mainly expressed in the hepatopancreas (Watanabe et al., 1998; Huang et al., 2010; Proespraiwong et al., 2010; Rocha et al., 2012), and consistent with the data from this experiment. The growth, molting and development of crustaceans require chitinase, which functions in digesting chitinous food, modifying the parenteral nutrition membrane and degrading the chitin exoskeleton (Zou and Bonvillain, 2004; Zhang et al., 2014). In this study, chitinase 1 was initially down-regulated. We speculate that chitinase 1 is involved in the response to low-salinity stress and improves the ability of M. japonicus to resist low-salinity stress. The specific regulatory mechanism of this process remains to be explored. We presume that expression of chitinase elicits an immune response quickly under low-salinity stress, which promotes ecdysis, and then allows gradual adaption to changes in salinity, which may be related to osmotic regulation. Its subsequent inhibition under low-salinity conditions may be a regulatory mechanism to prevent energy waste. Peritrophin is the most widely investigated soluble protein in the insect peritrophic membrane. It has strong interactions with chitin-binding domain 2 and the envelope protein A domain to form the peritrophic membrane, which promotes food digestion and protects insects from microbial invasion (Jasrapuria et al., 2010). In recent years, many peritrophin-like genes have been identified and cloned in crustaceans such as F. merguiensis (Loongyai et al., 2007), P. monodon (Chen et al., 2009), F. chinensis (Du et al., 2006), and Exopalaemon carinicauda (Wang et al., 2013). Du et al. (2006) and Wang et al. (2013) found that silencing peritrophinlike genes by dsRNA interference improved the survival rate of shrimp infected with WSSV, suggesting that peritrophin-like genes may have an immune defense function. In our transcriptome data, chitinase 1 was initially up-regulated, then returned to normal, and then was down-regulated, while the peritrophin gene was initially down-regulated and then returned to normal, under low salinity compared with the control group. Interestingly, peritrophin-like protein gene showed the opposite trend of the peritrophin gene. We speculate that these three genes are involved in the regulation of low-salinity adaptation. Salt stress promotes a rapid immune response in shrimp. Shrimp may adapt to the low-salinity environment by selfregulating osmotic pressure. Down-regulation of chitinase levels may be undertaken to prevent energy waste. The specific regulatory mechanism of this response remains to be explored.
5 CONCLUSIONThe transcriptome libraries in hepatopancreas of M. japonicus under low salt stress were successfully constructed, and many differentially expressed genes identified. The DEGs were annotated to obtain the pathways and genes related to osmoregulation, metabolism, and immunity. These functional genes provide valuable information for the further understanding of molecular mechanism of M. japonicus under low salt stress.
6 DATA AVAILABILITY STATEMENTAll data supporting the results of this study are available upon reasonable request from the corresponding author.
Amparyup P, Charoensapsri W, Tassanakajon A. 2013. Prophenoloxidase system and its role in shrimp immune responses against major pathogens. Fish & Shellfish Immunology, 34(4): 990-1001.
|
Balaguru K, Foltz G R, Leung L R, Emanuel K A. 2016. Global warming-induced upper-ocean freshening and the intensification of super typhoons. Nature Communications, 7(13670): 1-8.
|
Brawand D, Soumillon M, Necsulea A, Julien P, Csárdi G, Harrigan P, Weier M, Liechti A, Aximu-Petri A, Kircher M, Albert F W, Zeller U, Khaitovich P, Grützner F, Bergmann S, Nielsen R, Pääbo S, Kaessmann H. 2011. The evolution of gene expression levels in mammalian organs. Nature, 478(7369): 343-348.
DOI:10.1038/nature10532 |
Chen J C, Lai S H. 1993. Effects of temperature and salinity on oxygen consumption and ammonia-N excretion of juvenile Penaeus japonicus Bate. Journal of Experimental Marine Biology and Ecology, 165(2): 161-170.
DOI:10.1016/0022-0981(93)90103-U |
Chen K Y, Hsu T C, Huang P Y, Kang S T, Lo C F, Huang W P, Chen L L. 2009. Penaeus monodon chitin-binding protein(PmCBP) is involved in white spot syndrome virus(WSSV) infection. Fish & Shellfish Immunology, 27(3): 460-465.
|
Chen K, Li E C, Gan L, Wang X D. 2014. Growth and lipid metabolism of the pacific white shrimp Litopenaeus vannamei at different salinities. Journal of Shellfish Research, 33(3): 825-833.
DOI:10.2983/035.033.0317 |
Chen K, Li E C, Li T Y, Xu C, Wang X D, Lin H Z, Qin J G, Chen L Q. 2015. Transcriptome and molecular pathway analysis of the hepatopancreas in the Pacific white shrimp Litopenaeus vannamei under chronic low-salinity stress. PLoS One, 10(7): e0131503.
DOI:10.1371/journal.pone.0131503 |
Chen K, Li E C, Xu C, Wang X D, Li H F, Qin J G, Chen L Q. 2019. Growth and metabolomic responses of Pacific white shrimp (Litopenaeus vannamei) to different dietary fatty acid sources and salinity levels. Aquaculture, 499: 329-340.
DOI:10.1016/j.aquaculture.2018.09.056 |
Cheng S Y, Chen J C. 2001. The time-course change of nitrogenous excretion in the Kuruma shrimp Penaeus japonicus following nitrite exposure. Aquatic Toxicology, 51(4): 443-454.
DOI:10.1016/S0166-445X(00)00122-3 |
Cheng S Y, Lee W C, Shieh L W, Chen J C. 2004. Increased production and excretion of urea in the kuruma shrimp (Marsupenaeus japonicus) exposed to combined environments of increased ammonia and nitrite. Archives of Environmental Contamination and Toxicology, 47(3): 352-362.
|
Cheng S Y, Shieh L W, Chen J C. 2013. Changes in hemolymph oxyhemocyanin, acid-base balance, and electrolytes in Marsupenaeus japonicus under combined ammonia and nitrite stress. Aquatic Toxicology, 130-131: 132-138.
DOI:10.1016/j.aquatox.2012.12.015 |
Chien Y H, Shiau W C. 2005. The effects of dietary supplementation of algae and synthetic astaxanthin on body astaxanthin, survival, growth, and low dissolved oxygen stress resistance of kuruma prawn, Marsupenaeus japonicus Bate. Journal of Experimental Marine Biology and Ecology, 318(2): 201-211.
DOI:10.1016/j.jembe.2004.12.016 |
Chong-Robles J, Charmantier G, Boulo V, Lizárraga-Valdéz J, Enríquez-Paredes L M, Giffard-Mena I. 2014. Osmoregulation pattern and salinity tolerance of the white shrimp Litopenaeus vannamei (Boone, 1931) during postembryonic development. Aquaculture, 422-423: 261-267.
DOI:10.1016/j.aquaculture.2013.11.034 |
Coman G J, Crocos P J, Preston N P, Fielder D. 2002. The effects of temperature on the growth, survival and biomass of different families of juvenile Penaeus japonicus Bate. Aquaculture, 214(1-4): 185-199.
DOI:10.1016/S0044-8486(02)00361-7 |
Dawson N J, Biggar K K, Storey K B. 2013. Characterization of fructose-1, 6-bisphosphate aldolase during anoxia in the tolerant turtle, Trachemys scriptaelegans: an assessment of enzyme activity, expression and structure. PLoS One, 8(7): e68830.
DOI:10.1371/journal.pone.0068830 |
De-Simone S G, Salles C M C D, Silva C M B, Hassón-Voloch A. 2006. Purification and amino acid sequence of fructose-1, 6-bisphosphate aldolase from the electric organ of Electrophorus electricus(L.). Zeitschriftfür Naturforschung C A Journal of Biosciences, 61(11-12): 884-888.
DOI:10.1515/znc-2006-11-1217 |
Du X J, Wang J X, Ning L, Zhao X F, Li F H, Xiang J H. 2006. Identification and molecular characterization of a peritrophin-like protein from fleshy prawn (Fenneropenaeus chinensis). Molecular Immunology, 43(10): 1633-1644.
DOI:10.1016/j.molimm.2005.09.018 |
Duan Y F, Zhang J S, Dong H B, Wang Y, Liu Q S, Li H. 2016. Effect of desiccation and resubmersion on the oxidative stress response of the kuruma shrimp Marsupenaeus japonicus. Fish & Shellfish Immunology, 49: 91-99.
|
Fan L F, Wang L, Wang Z L. 2019. Proteomic characterization of the hepatopancreas in the Pacific white shrimp Litopenaeus vannamei under cold stress: revealing the organism homeostasis mechanism. Fish & Shellfish Immunology, 92: 438-449.
|
Forgac M. 2007. Vacuolar ATPases: rotary proton pumps in physiology and pathophysiology. Nature Reviews Molecular Cell Biology, 8(11): 917-929.
DOI:10.1038/nrm2272 |
Fregoso-López M G, Morales-Covarrubias M S, Franco-Nava M A, Ramírez-Rochín J, Fierro-Sañudo J F, PoncePalafox J T, Páez-Osuna F. 2017. Histological alterations in gills of shrimp Litopenaeus vannamei in low-salinity waters under different stocking densities: potential relationship with nitrogen compounds. Aquaculture Research, 48(12): 5854-5863.
DOI:10.1111/are.13408 |
Freire C A, Onken H, Mcnamara J C. 2008. A structurefunction analysis of ion transport in crustacean gills and excretory organs. Comparative Biochemistry and Physiology Part A: Molecular & Integrative Physiology, 151(3): 272-304.
|
Fu B Z, Zou L L. 2018. De novo transcriptome assembly and comparison of walnut (Juglansregia L.) cv.Qingxiang organs: roots, stems and leaves. Swift Journal of Agricultural Research, 4(1): 1-20.
|
Furriel R P M, Firmino K C S, Masui D C, Faleiros R O, Torres A H, McNamara J C. 2010. Structural and biochemical correlates of Na+, K+-ATPase driven ion uptake across the posterior gill epithelium of the true freshwater crab, Dilocarcinus pagei (Brachyura, Trichodactylidae). Journal of Experimental Zoology.Part A: Ecological Genetics and Physiology, 313(8): 508-523.
|
Gao W H, Tan B P, Mai K S, Chi S Y, Liu H Y, Dong X H, Yang Q H. 2012. Profiling of differentially expressed genes in hepatopancreas of white shrimp (Litopenaeus vannamei) exposed to long-term low salinity stress. Aquaculture, 364-365: 186-191.
DOI:10.1016/j.aquaculture.2012.08.024 |
Glenn K L, Grapes L, Suwanasopee T, Harris D L, Li Y, Wilson K, Rothschild M F. 2005. SNP analysis of AMY2 and CTSL genes in Litopenaeus vannamei and Penaeusmonodon shrimp. Animal Genetics, 36(3): 235-236.
DOI:10.1111/j.1365-2052.2005.01274.x |
GrabherrM G, HaasB J, Yassour M, Levin J Z, Thompson D A, Amit I, Adiconis X, Fan L, Raychowdhury R, Zeng Q D, Chen Z H, Mauceli E, Hacohen N, Gnirke A, Rhind N, di Palma F, Birren B W, Nusbaum C, Lindblad-Toh K, Friedman N, Regev A. 2011. Full-length transcriptome assembly from RNA-Seq data without a reference genome. Nature Biotechnology, 29(7): 644-652.
DOI:10.1038/nbt.1883 |
Hamasaki K, Kitada S. 2008. Potential of stock enhancement for decapod crustaceans. Reviews in Fisheries Science, 16(1-3): 164-174.
DOI:10.1080/10641260701681722 |
Havird J C, Henry R P, Wilson A E. 2013. Altered expression of Na+/K+-ATPase and other osmoregulatory genes in the gills of euryhaline animals in response to salinity transfer: ameta-analysis of 59 quantitative PCR studies over 10years. Comparative Biochemistry and Physiology Part D: Genomics and Proteomics, 8(2): 131-140.
DOI:10.1016/j.cbd.2013.01.003 |
He L, Wang Q, Jin X K, Wang Y, Chen L L, Liu L H, Wang Y, Liu Z J. 2012. Transcriptome profiling of testis during sexual maturation stages in Eriocheir sinensis using Illumina sequencing. PLoS One, 7(3): e33735.
DOI:10.1371/journal.pone.0033735 |
Heugens E H W, Hendriks A J, Dekker T, van Straalen N M, Admiraal W. 2001. A review of the effects of multiple stressors on aquatic organisms and analysis of uncertainty factors for use in risk assessment. Critical Reviews in Toxicology, 31(3): 247-284.
DOI:10.1080/20014091111695 |
Hewitt D R, Duncan P F. 2001. Effect of high water temperature on the survival, moulting and food consumption of Penaeus (Marsupenaeus) japonicus (Bate, 1888). Aquaculture Research, 32(4): 305-313.
DOI:10.1046/j.1365-2109.2001.00560.x |
Hop H, Pearson T, Hegseth E N, Kovacs K M, Wiencke C, Kwasniewski S, Eiane K, Mehlum F, Gulliksen B, Wlodarska-Kowalczuk M, Lydersen C, Weslawski J M, Cochrane S, Gabrielsen G W, Leakey R J G, Lønne O J, Zajaczkowski M, Falk-Petersen S, Kendall M, Wängberg S Å, Bischof K, Voronkov A Y, Kovaltchouk N A, Wiktor J, Poltermann M, di Prisco G, Papucci C, Gerland S. 2002. The marine ecosystem of Kongsfjorden, Svalbard. Polar Research, 21(1): 167-208.
DOI:10.3402/polar.v21i1.6480 |
Hu D X, Pan L Q, Zhao Q, Ren Q. 2015. Transcriptomic response to low salinity stress in gills of the Pacific white shrimp, Litopenaeus vannamei. Marine Genomics, 24: 297-304.
DOI:10.1016/j.margen.2015.07.003 |
Hu W Y, Yao C L. 2016. Molecular and immune response characterizations of a novel AIF and cytochrome c in Litopenaeus vannamei defending against WSSV infection. Fish & Shellfish Immunology, 56(3): 84-95.
|
Huang Q S, Yan J H, Tang J Y, Tao Y M, Xie X L, Wang Y, Wei X Q, Yan Q H, Chen Q X. 2010. Cloning and tissue expressions of seven chitinase family genes in Litopenaeus vannamei. Fish & Shellfish Immunology, 29(1): 75-81.
|
Ingram B A, Mckinnon L J, Gooley G J. 2002. Growth and survival of selected aquatic animals in two saline groundwater evaporation basins: an Australian case study. Aquaculture Research, 33(6): 425-436.
DOI:10.1046/j.1365-2109.2002.00691.x |
Jasrapuria S, Arakane Y, Osman G, Kramer K J, Beeman R W, Muthukrishnan S. 2010. Genes encoding proteins with peritrophin A-type chitin-binding domains in Tribolium castaneum are grouped into three distinct families based on phylogeny, expression and function. Insect Biochemistry and Molecular Biology, 40(3): 214-227.
DOI:10.1016/j.ibmb.2010.01.011 |
Jefferies K C, Cipriano D J, Forgac M. 2008. Function, structure and regulation of the vacuolar (H+) -ATPases. Archives of Biochemistry and Biophysics, 476(1): 33-42.
DOI:10.1016/j.abb.2008.03.025 |
Johnson C R, Banks S C, Barrett N S, Cazassus F, Dunstan P K, Edgar G J, Frusher S D, Gardner C, Haddon M, Helidoniotis F, Hill K L, Holbrook N J, Hosie G W, Last P R, Ling S D, Melbourne-Thomas J, Miller K, Pecl G T, Richardson A J, Ridgway K R. 2011. Climate change cascades: shifts in oceanography, species' ranges and subtidal marine community dynamics in eastern Tasmania. Journal of Experimental Marine Biology and Ecology, 400(1-2): 17-32.
DOI:10.1016/j.jembe.2011.02.032 |
Jung H, Lyons R E, Dinh H, Hurwood D A, McWilliam S, Mather P B. 2011. Transcriptomics of a giant freshwater prawn (Macrobrachium rosenbergii): de novo assembly, annotation and marker discovery. PLoS One, 6(12): e27938.
DOI:10.1371/journal.pone.0027938 |
Kanehisa M, Araki M, Goto S, Hattori M, Hirakawa M, Itoh M, Katayama T, Kawashima S, Okuda S, Tokimatsu T, Yamanishi Y. 2007. KEGG for linking genomes to life and the environment. Nucleic Acids Research, 36: D480-D484.
DOI:10.1093/nar/gkm882 |
Kornienko A E, Dotter C P, Guenzl P M, Gisslinger H, Gisslinger B, Cleary C, Kralovics R, Pauler F M, Barlow D P. 2016. Long non-coding RNAs display higher natural expression variation than protein-coding genes in healthy humans. Genome Biology, 17: 14.
DOI:10.1186/s13059-016-0873-8 |
Kourafalou V H, Lee T N, Oey L Y, Wang J D. 1996. The fate of river discharge on the continental shelf: 2.Transport of coastal low-salinity waters under realistic wind and tidal forcing. Journal of Geophysical Research: Oceans, 101(C2): 3435-3455.
DOI:10.1029/95JC03025 |
Kuriki T, Imanaka T. 1999. The concept of the α-amylase family: structural similarity and common catalytic mechanism. Journal of Bioscience and Bioengineering, 87(5): 557-565.
DOI:10.1016/S1389-1723(99)80114-5 |
Laing I. 2002. Effect of salinity on growth and survival of king scallop spat (Pectenmaximus). Aquaculture, 205(1-2): 171-181.
DOI:10.1016/S0044-8486(01)00663-9 |
Langmead B, Trapnell C, Pop M, Salzberg S L. 2009. Ultrafast and memory-efficient alignment of short DNA sequences to the human genome. Genome Biology, 10(3): R25.
DOI:10.1186/gb-2009-10-3-r25 |
Lee W C, Chen J C. 2003. Hemolymph ammonia, urea and uric acid levels and nitrogenous excretion of Marsupenaeus japonicus at different salinity levels. Journal of Experimental Marine Biology and Ecology, 288(1): 39-49.
DOI:10.1016/S0022-0981(02)00597-X |
Leu J H, Chen S H, Wang Y B, Chen Y C, Su S Y, Lin C Y, Ho J M, Lo C F. 2011. A review of the major penaeid shrimp EST studies and the construction of a shrimp transcriptome database based on the ESTs from four penaeid shrimp. Marine Biotechnology, 13(4): 608-621.
DOI:10.1007/s10126-010-9286-y |
Li B, Dewey C N. 2011. RSEM: accurate transcript quantification from RNA-Seq data with or without a reference genome. BMC Bioinformatics, 12(1): 323.
DOI:10.1186/1471-2105-12-323 |
Li B, He X L, Zhao Y P, Bai D Y, Du M, Song L J, Liu Z, Yin Z C, Manglai D. 2020. Transcriptome profiling of developing testes and spermatogenesis in the Mongolian horse. BMC Genetics, 21(1): 46.
DOI:10.1186/s12863-020-00843-5 |
Li C C, Yeh S T, Chen J C. 2010. Innate immunity of the white shrimp Litopenaeus vannamei weakened by the combination of a Vibrio alginolyticus injection and lowsalinity stress. Fish & Shellfish Immunology, 28(1): 121-127.
|
Li C Z, Weng S P, Chen Y G, Yu X Q, Lü L, Zhang H Q, He J G, Xu X P. 2012. Analysis of Litopenaeus vannamei transcriptome using the next-generation DNA sequencing technique. PLoS One, 7(10): e47442.
DOI:10.1371/journal.pone.0047442 |
Li E C, Wang S L, Li C, Wang X D, Chen K, Chen L Q. 2014a. Transcriptome sequencing revealed the genes and pathways involved in salinity stress of Chinese mitten crab, Eriocheir sinensis. Physiological Genomics, 46(5): 177-190.
DOI:10.1152/physiolgenomics.00191.2013 |
Li F H, Xiang J H. 2013. Recent advances in researches on the innate immunity of shrimp in China. Developmental&Comparative Immunology, 39(1-2): 11-26.
|
Li J T, Ma P, Liu P, Chen P, Li J. 2015. The roles of Na+/K+-ATPase α-subunit gene from the ridgetail white prawn Exopalaemon carinicauda in response to salinity stresses. Fish & Shellfish Immunology, 42(2): 264-271.
|
Li S H, Zhang X J, Sun Z, Li F H, Xiang J H. 2013. Transcriptome analysis on Chinese shrimp Fenneropenaeus chinensis during WSSV acute infection. PLoS One, 8(3): e58627.
DOI:10.1371/journal.pone.0058627 |
Li Y Q, Jiang L X, Wang R J. 2014b. Layered farming for Marsupenaeus japonicus Bate. Chinese Journal of Oceanology and Limnology, 32(3): 549-553.
DOI:10.1007/s00343-014-3112-8 |
Lin Y C, Chen J C, Li C C, Morni W Z W, Suhaili A S N A, Kuo Y H, Chang Y H, Chen L L, Tsui W C, Chen Y Y, Huang C L. 2012. Modulation of the innate immune system in white shrimp Litopenaeus vannamei following long-term low salinity exposure. Fish & Shellfish Immunology, 33(2): 324-331.
|
Lin Y C, Vaseeharan B, Chen J C. 2008. Identification and phylogenetic analysis on lipopolysaccharide and β-1, 3-glucan binding protein (LGBP) of kuruma shrimp Marsupenaeus japonicus. Developmental & Comparative Immunology, 32(11): 1260-1269.
|
Liu B, Yu Z M, Song X X, Guan Y Q, Jian X F, He J G. 2006. The effect of acute salinity change on white spot syndrome(WSS) outbreaks in Fenneropenaeus chinensis. Aquaculture, 253(1-4): 163-170.
DOI:10.1016/j.aquaculture.2005.08.022 |
Liu J H, Zheng J J, Liu J Y. 2019. Genetic parameters for growth-related traits and survival with age in the Kuruma shrimp Marsupenaeus japonicus. Aquaculture Research, 50(1): 42-48.
DOI:10.1111/are.13862 |
Liu Y C, Li F H, Wang B, Dong B, Zhang X J, Xiang J H. 2009. A serpin from Chinese shrimp Fenneropenaeus chinensis is responsive to bacteria and WSSV challenge. Fish & Shellfish Immunology, 26(3): 345-351.
|
Loongyai W, Avarre J C, Cerutti M, Lubzens E, Chotigeat W. 2007. Isolation and functional characterization of a new shrimp ovarian peritrophin with antimicrobial activity from Fenneropenaeus merguiensis. Marine Biotechnology, 9(5): 624-637.
DOI:10.1007/s10126-007-9019-z |
Lu W, Tang X L, Huo Y Q, Xu R, Qi S D, Huang J G, Zheng C C, Wu C A. 2012. Identification and characterization of fructose 1, 6-bisphosphate aldolase genes in Arabidopsis reveal a gene family with diverse responses to abiotic stresses. Gene, 503(1): 65-74.
DOI:10.1016/j.gene.2012.04.042 |
Lu X, Luan S, Hu L Y, Mao Y, Tao Y, Zhong S P, Kong J. 2016. High-resolution genetic linkage mapping, high-temperature tolerance and growth-related quantitative trait locus (QTL) identification in Marsupenaeus japonicus. Molecular Genetics and Genomics, 291(3): 1391-1405.
DOI:10.1007/s00438-016-1192-1 |
Lucu Č, Towle D W. 2003. Na++K+-ATPase in gills of aquatic crustacea. Comparative Biochemistry and Physiology Part A: Molecular & Integrative Physiology, 135(2): 195-214.
|
Ludwig N, Leidinger P, Becker K, Backes C, Fehlmann T, Pallasch C, Rheinheimer S, Meder B, Stähler C, Meese E, Keller A. 2016. Distribution of miRNA expression across human tissues. Nucleic Acids Research, 44(8): 3865-3877.
DOI:10.1093/nar/gkw116 |
Lv J J, Liu P, Wang Y, Gao B Q, Chen P, Li J. 2013. Transcriptome analysis of Portunus trituberculatus in response to salinity stress provides insights into the molecular basis of osmoregulation. PLoS One, 8(12): e82155.
DOI:10.1371/journal.pone.0082155 |
Mao X, Cai T, Olyarchuk J G, Wei L. 2005. Automated genome annotation and pathway identification using the KEGG Orthology (KO) as a controlled vocabulary. Bioinformatics, 21(19): 3787-3793.
DOI:10.1093/bioinformatics/bti430 |
Marsden V S, O'Connor L, O'Reilly L A, Silke J, Metcalf D, Ekert P G, Huang D C S, Cecconi F, Kuida K, Tomaselli K J, Roy S, Nicholson D W, Vaux D L, Bouillet P, Adams J M, Strasser A. 2002. Apoptosis initiated by Bcl-2-regulated caspase activation independently of the cytochrome c/Apaf-1/caspase-9 apoptosome. Nature, 419(6907): 634-637.
DOI:10.1038/nature01101 |
Masuda T, Otomo R, Kuyama H, Momoji K, Tonomoto M, Sakai S, Nishimura O, Sugawara T, Hirata T. 2012. A novel type of prophenoloxidase from the kuruma prawn Marsupenaeus japonicus contributes to the melanization of plasma in crustaceans. Fish &Shellfish Immunology, 32(1): 61-68.
|
Mcgraw W J, Davis D A, Teichert-Coddington D, Rouse D B. 2002. Acclimation of Litopenaeus vannamei post larvae to low salinity: influence of age, salinity endpoint, and rate of salinity reduction. Journal of the World Aquaculture Society, 33(1): 78-84.
DOI:10.1111/j.1749-7345.2002.tb00481.x |
Mcnamara J C, Faria S C. 2012. Evolution of osmoregulatory patterns and gill ion transport mechanisms in the decapod Crustacea: a review. Journal of Comparative Physiology B, 182(8): 997-1014.
DOI:10.1007/s00360-012-0665-8 |
Mcnamara J C, Freire C A, Torres A H Jr, Faria S C. 2015. The conquest of fresh water by the palaemonid shrimps: an evolutionary history scripted in the osmoregulatory epithelia of the gills and antennal glands. Biological Journal of the Linnean Society, 114(3): 673-688.
DOI:10.1111/bij.12443 |
Meng X L, Dong Y W, Dong S L, Yu S S, Zhou X. 2011. Mortality of the sea cucumber, Apostichopus japonicus Selenka, exposed to acute salinity decrease and related physiological responses: osmoregulation and heat shock protein expression. Aquaculture, 316(1-4): 88-92.
DOI:10.1016/j.aquaculture.2011.03.003 |
Opferman J T, Korsmeyer S J. 2003. Apoptosis in the development and maintenance of the immune system. Nature Immunology, 4(5): 410-415.
DOI:10.1038/ni0503-410 |
Park S J, Komata M, Inoue F, Yamada K, Nakai K, Ohsugi M, Shirahige K. 2013. Inferring the choreography of parental genomes during fertilization from ultralarge-scale wholetranscriptome analysis. Genes & Development, 27(24): 2736-2748.
|
Paterson B D. 1993. Respiration rate of the kuruma prawn, Penaeus japonicus Bate, is not increased by handling at low temperature (12℃). Aquaculture, 114(3-4): 229-235.
DOI:10.1016/0044-8486(93)90298-D |
Péqueux A. 1995. Osmotic regulation in crustaceans. Journal of Crustacean Biology, 15(1): 1-60.
DOI:10.1163/193724095X00578 |
Powell D, Knibb W, Remilton C, Elizur A. 2015. De-novo transcriptome analysis of the banana shrimp(Fenneropenaeus merguiensis) and identification of genes associated with reproduction and development. Marine Genomics, 22: 71-78.
DOI:10.1016/j.margen.2015.04.006 |
Proespraiwong P, Tassanakajon A, Rimphanitchayakit V. 2010. Chitinases from the black tiger shrimp Penaeus monodon: phylogenetics, expression and activities. Comparative Biochemistry and Physiology Part B: Biochemistry and Molecular Biology, 156(2): 86-96.
DOI:10.1016/j.cbpb.2010.02.007 |
Rahi M L, Amin S, Mather P B, Hurwood D A. 2017. Candidate genes that have facilitated freshwater adaptation by palaemonid prawns in the genus Macrobrachium: identification and expression validation in a model species(M.koombooloomba). Peer J, 5(2): e2977.
|
Rainbow P S, Black W H. 2001. Effects of changes in salinity on the apparent water permeability of three crab species: Carcinusmaenas, Eriocheirsinensis and Necorapuber. Journal of Experimental Marine Biology and Ecology, 264(1): 1-13.
DOI:10.1016/S0022-0981(01)00289-1 |
Rajesh S, Kiruthika J, Ponniah A G, Shekhar M S. 2012. Identification, cloning and expression analysis of Catechol-O-methyltransferase (COMT) gene from shrimp, Penaeus monodon and its relevance to salinity stress. Fish & Shellfish Immunology, 32(5): 693-699.
|
Rocha J, Garcia-Carreño F L, Muhlia-AlmazánA, PeregrinoUriarte A B, Yépiz-Plascencia G, Córdova-Murueta J H. 2012. Cuticular chitin synthase and chitinase mRNA of whiteleg shrimp Litopenaeus vannamei during the molting cycle. Aquaculture, 330-333: 111-115.
DOI:10.1016/j.aquaculture.2011.12.024 |
Setiarto A, Strüssmann C A, Takashima F, Watanabe S, Yokota M. 2004. Short-term responses of adult kuruma shrimp Marsupenaeus japonicus (Bate) to environmental salinity: osmotic regulation, oxygen consumption and ammonia excretion. Aquaculture Research, 35(7): 669-677.
DOI:10.1111/j.1365-2109.2004.01064.x |
Shekhar M S, Kiruthika J, Ponniah A G. 2013. Identification and expression analysis of differentially expressed genes from shrimp (Penaeus monodon) in response to low salinity stress. Fish & Shellfish Immunology, 35(6): 1957-1968.
|
Skou J C, Esmann M. 1992. The Na, k-ATPase. Journal of Bioenergetics and Biomembranes, 24(3): 249-261.
|
Skulachev V P. 1998. Cytochrome c in the apoptotic and antioxidant cascades. FEBS Letters, 423(3): 275-280.
DOI:10.1016/S0014-5793(98)00061-1 |
Sokolova I M, Frederich M, Bagwe R, Lannig G, Sukhotin A A. 2012. Energy homeostasis as an integrative tool for assessing limits of environmental stress tolerance in aquatic invertebrates. Marine Environmental Research, 79: 1-15.
DOI:10.1016/j.marenvres.2012.04.003 |
Steller H, Grether M E. 1994. Programmed cell death in Drosophila. Neuron, 13(6): 1269-1274.
DOI:10.1016/0896-6273(94)90413-8 |
Suhail M. 2010. Na+, K+-ATPase: ubiquitous multifunctional transmembrane protein and its relevance to various pathophysiological conditions. Journal of Clinical Medicine Research, 2(1): 1-17.
|
Tassanakajon A, Somboonwiwat K, Supungul P, Tang S. 2013. Discovery of immune molecules and their crucial functions in shrimp immunity. Fish & Shellfish Immunology, 34(3): 954-967.
|
Tiu S H K, He J G, Chan S M. 2007. The LvCHH-ITP gene of the shrimp (Litopenaeus vannamei) produces a widely expressed putative ion transport peptide (LvITP) for osmo-regulation. Gene, 396(2): 226-235.
DOI:10.1016/j.gene.2007.02.027 |
Towle D W, Kays W T. 1986. Basolateral localization of Na++K+-ATPase in gill epithelium of two osmoregulating crabs, Callinectes sapidus and Carcinus maenas. Journal of Experimental Zoology, 239(3): 311-318.
DOI:10.1002/jez.1402390302 |
Trapnell C, Williams B A, Pertea G, Mortazavi A, Kwan G, van Baren M J, Salzberg S L, Wold B J, Pachter L. 2010. Transcript assembly and quantification by RNA-Seq reveals unannotated transcripts and isoform switching during cell differentiation. Nature Biotechnology, 28(5): 511-515.
DOI:10.1038/nbt.1621 |
Tsai J R, Lin H C. 2007. V-type H+-ATPase and Na+, K+-ATPase in the gills of 13 euryhaline crabs during salinity acclimation. Journal of Experimental Biology, 210(4): 620-627.
DOI:10.1242/jeb.02684 |
Tseng Y C, Hwang P P. 2008. Some insights into energy metabolism for osmoregulation in fish. Comparative Biochemistry and Physiology Part C: Toxicology & Pharmacology, 148(4): 419-429.
|
Tsoi K H, Ma K Y, Wu T H, Fennessy S T, Chu K H, Chan T Y. 2014. Verification of the cryptic species Penaeus pulchricaudatus in the commercially important kuruma shrimp P. japonicus (Decapoda: Penaeidae) using molecular taxonomy. Invertebrate Systematics, 28(5): 476-490.
DOI:10.1071/IS14001 |
Via G J D. 1986. Salinity responses of the juvenile penaeid shrimp Penaeus japonicus: I. Oxygen consumption and estimations of productivity. Aquaculture, 55(4): 297-306.
DOI:10.1016/0044-8486(86)90170-5 |
Wang L K, Feng Z X, Wang X, Wang X W, Zhang X G. 2010. DEGseq: an R package for identifying differentially expressed genes from RNA-seq data. Bioinformatics, 26(1): 136-138.
DOI:10.1093/bioinformatics/btp612 |
Wang L U, Chen J C. 2005. The immune response of white shrimp Litopenaeus vannamei and its susceptibility to Vibrioalginolyticus at different salinity levels. Fish&Shellfish Immunology, 18(4): 269-278.
|
Wang L Y, Li F H, Wang B, Xiang J H. 2013. A new shrimp peritrophin-like gene from Exopalaemon carinicauda involved in white spot syndrome virus (WSSV) infection. Fish &Shellfish Immunology, 35(3): 840-846.
|
Wang L, Wang W N, Liu Y, Cai D X, Li J Z, Wang A L. 2012. Two types of ATPases from the Pacific white shrimp, Litopenaeus vannamei in response to environmental stress. Molecular Biology Reports, 39(6): 6427-6438.
DOI:10.1007/s11033-012-1461-y |
Wang P H, Huang T Z, Zhang X B, He J G. 2014a. Antiviral defense in shrimp: from innate immunity to viral infection. Antiviral Research, 108: 129-141.
DOI:10.1016/j.antiviral.2014.05.013 |
Wang W, Wu X G, Liu Z J, Zheng H J, Cheng Y X, Buratti E. 2014b. Insights into hepatopancreatic functions for nutrition metabolism and ovarian development in the crab Portunus trituberculatus: gene discovery in the comparative transcriptome of different hepatopancreas stages. PLoS One, 9(1): e84921.
DOI:10.1371/journal.pone.0084921 |
Wang X D, Li E C, Qin J G, Wang S F, Chen X F, Cai Y, Chen K, Hou Y M, Yu N, Zhang M L, Du Z Y, Chen L Q. 2014c. Growth, body composition, and ammonia tolerance of juvenile white shrimp Litopenaeus vannamei fed diets containing different carbohydrate levels at low salinity. Journal of Shellfish Research, 33(2): 511-517.
DOI:10.2983/035.033.0220 |
Watanabe T, Kono M, Aida K, Nagasawa H. 1998. Purification and molecular cloning of a chitinase expressed in the hepatopancreas of the penaeid prawn Penaeusjaponicus. Biochimica et Biophysica Acta (BBA) -Protein Structure and Molecular Enzymology, 1382(2): 181-185.
DOI:10.1016/S0167-4838(97)00184-2 |
Weihrauch D, Ziegler A, Siebers D, Towle D W. 2001. Molecular characterization of V-type H+-ATPase(B-subunit) in gills of euryhaline crabs and its physiological role in osmoregulatory ion uptake. Journal of Experimental Biology, 204: 25-37.
DOI:10.1242/jeb.204.1.25 |
Weng X, Song S X, He J G, Li S D, Li Y J, Wang P. 2012. New technology of efficient ecological culture of Marsupenaeus japonicus. p. 14. (in Chinese)
|
Wetsaphan N, Rimphanitchayakit V, Tassanakajon A, Somboonwiwat K. 2013. PmSERPIN3 from black tiger shrimp Penaeus monodon is capable of controlling the proPO system. Developmental &Comparative Immunology, 41(2): 110-119.
|
Xu C, Li E C, Liu Y, Wang X D, Qin J G, Chen L Q. 2017. Comparative proteome analysis of the hepatopancreas from the Pacific white shrimp Litopenaeus vannamei under long-term low salinity stress. Journal of Proteomics, 162: 1-10.
DOI:10.1016/j.jprot.2017.04.013 |
Ye L, Jiang S G, Zhu X M, Yang Q B, Wen W G, Wu K C. 2009. Effects of salinity on growth and energy budget of juvenile Penaeusmonodon. Aquaculture, 290(1-2): 140-144.
DOI:10.1016/j.aquaculture.2009.01.028 |
Young M D, Wakefield M J, Smyth G K, Oshlack A. 2010. Gene ontology analysis for RNA-seq: accounting for selection bias. Genome Biology, 11(2): R14.
DOI:10.1186/gb-2010-11-2-r14 |
Yu Z M, Li C W, Guan Y Q. 2003. Effect of salinity on the immune responses and outbreak of white spot syndrome in the shrimp Marsupenaeus japonicus. Ophelia, 57(2): 99-106.
DOI:10.1080/00785236.2003.10409507 |
Zhang D, Wang F, Dong S L, Lu Y L. 2016. De novo assembly and transcriptome analysis of osmoregulation in Litopenaeus vannamei under three cultivated conditions with different salinities. Gene, 578(2): 185-193.
DOI:10.1016/j.gene.2015.12.026 |
Zhang S Y, Jiang S F, Xiong Y W, Fu H T, Sun S M, Qiao H, Zhang W Y, Jiang F W, Jin S B, Gong Y S. 2014. Six chitinases from oriental river prawn Macrobrachium nipponense: cDNA characterization, classification and mRNA expression during post-embryonic development and moulting cycle. Comparative Biochemistry and Physiology Part B: Biochemistry and Molecular Biology, 167: 30-40.
DOI:10.1016/j.cbpb.2013.09.009 |
Zhao Q, Pan L Q, Ren Q, Hu D X. 2015. Digital gene expression analysis in hemocytes of the white shrimp Litopenaeus vannamei in response to low salinity stress. Fish & Shellfish Immunology, 42(2): 400-407.
|
Zhao X L, Yu H, Kong L F, Li Q. 2012. Transcriptomic responses to salinity stress in the Pacific oyster Crassostreagigas. PLoS One, 7(9): e46244.
DOI:10.1371/journal.pone.0046244 |
Zou E M, Bonvillain R. 2004. Chitinase activity in the epidermis of the fiddler crab, Ucapugilator, as an in vivo screen for molt-interfering xenobiotics. Comparative Biochemistry and Physiology Part C: Toxicology & Pharmacology, 139(4): 225-230.
|