 2022, Vol. 40
Institute of Oceanology, Chinese Academy of Sciences
Article Information
- Zhang Lingshuai, Wang Xiudan, Zhang Weiqian, Yin Xiaoting, Liu Qing, Qiu Limei
- Impact of ocean acidification on physiology and microbiota in hepatopancreas of Pacific oyster Crassostrea gigas
- Journal of Oceanology and Limnology, 40(2): 620-633
- http://dx.doi.org/10.1007/s00343-021-0462-x
Article History
- Received Dec. 1, 2020
- accepted in principle Feb. 27, 2021
- accepted for publication Apr. 14, 2021


2 Qingdao University of Science and Technology, Qingdao 266071, China;
3 University of Chinese Academy of Sciences, Beijing 100049, China;
4 Laboratory for Marine Biology and Biotechnology, Pilot National Laboratory for Marine Science and Technology (Qingdao), Qingdao 266237, China
The phenomenon that the ocean absorbs excess CO2 in the atmosphere, causes a decrease in pH value of seawater and changes in the carbonate balance system, is called ocean acidification (OA) (Caldeira and Wickett, 2003). At the end of this century, the atmospheric CO2 concentration is expected to be 0.55‰–0.8‰ (Mackay, 2008), which is much higher than the current concentration of 0.4‰. Accordingly, the pH value of the ocean surface will fall by 0.3–0.4 (Hoegh-Guldberg et al., 2007), which is sure to have a profound impact on marine biodiversity and ecosystem functions (Doney et al., 2009, 2012), and challenge the survival of many marine organisms. The most direct and key impact of ocean acidification on organisms is the acid-base imbalance, which will increase the difficulty of calcification of marine organisms (Fitzer et al., 2014). Bivalves, as the important marine calcifiers, will spend more energy for biomineralization and adjustment of acid-base balance (Beniash et al., 2010). This will further influence the growth and survival of bivalves (Gutowska et al., 2010; Parker et al., 2013), so the full understanding about the responses of bivalves to OA is of critical importance to the future development of these species.
Many researches have revealed that OA can impact a series of biological processes in bivalves, such as energy metabolism (Beniash et al., 2010; Gu et al., 2019), calcification process (Melzner et al., 2011; Liu et al., 2020a), immune response (Wang et al., 2016), growth (Rodolfo-Metalpa et al., 2011; Amaral et al., 2012), development (Kurihara, 2008; Talmage and Gobler, 2010; Liu et al., 2020b), and genetic reproduction (Gobler and Talmage, 2013; Zhao et al., 2020). These observational data are mainly obtained by describing their physiological and biochemical changes in the larvae of different developmental stages, or in some important tissues, such as shell and hemolymph (Parker et al., 2013; Clements and Hunt, 2017). The hepatopancreas, an important functional tissue of mollusks (Zhang et al., 2012), plays major roles in the body's nutritional intake, hormone synthesis, energy metabolism, and immune defense (Canesi et al., 2007a, b ; Khan et al., 2018), but their reactions under OA conditions have not been well studied. Recently, an increasing interest has been attracted to the study of the impact of OA on hepatopancreas functions. For example, elevated CO2 concentration (2‰) had an inhibitory effect on some antioxidant activities and glutathione levels decreased in hepatopancreas of Pacific oysters (Wang et al., 2016). The hepatopancreas structure of bivalves could also be prominently damaged after 21 days of OA exposure (pH=7.1), which might further reduce the activity of digestive enzymes (Kong et al., 2019; Wang et al., 2020; Xu et al., 2020). If the marine environment is continuously deteriorated, as most of the bivalves are attaching organisms, they are inclined to permanently survive in the acidified environment after the pH value of seawater drops. However, previous researches focus mainly on the short-term (within a month) response of hepatopancreas to OA, the impact of long-term OA on hepatopancreas should be further emphasized and evaluated.
Shellfish are filter feeders and can filter up to 109 bacterial cells per hour, many of them may appear to be transients or opportunists in the microbiota (Paillard et al., 2004; Pruzzo et al., 2005). Studies have shown that hepatopancreas of healthy shellfish usually harbors species-rich microbial communities (Green and Barnes, 2010; Khan et al., 2018). Evidence reveals that the stable structure of microbiota in the digestive glands may contribute importantly to the maintenance of the normal function of shellfish (Khan et al., 2018). However, studies on this aspect are few at present. In addition, some researchers have proved that elevated CO2 level in seawater could lead to the change in the structure of bacterial communities of some marine organisms. For example, sponges Dysidea avara acquired 255 new Operational Taxonomic Units (OTUs) under the acidified condition (pH=7.8) (Ribes et al., 2016). Variations in the composition of microbiota may adversely affect hosts in the acidified environment. The intestinal bacterial community of sea bream Sparus aurata underwent significant dysbiosis after exposure to 121.59-kPa CO2 for one month due to the absence of Firmicutes phylum and increase of Proteobacteria abundance. The changes in the microbial community might be related to the digestion ability, for example, impaired digestion was observed in fish under hypercapnia (Fonseca et al., 2019). In mollusks, the hepatopancreas microbial community is also closely related to the host's digestion, nutrient absorption, and immune functions (Khan et al., 2018; Butt and Volkoff, 2019). Therefore, exploring the variations of hepatopancreas microbiota will help us to better understand the changes in physiological activities of hepatopancreas in an acidified environment.
The Pacific oyster Crassostrea gigas, known as ecosystem engineers, plays an important role in the ecological environment (Coleman and Williams, 2002), and their response and adaptation to OA have received increasing attention (Wei et al., 2015). In this study, we investigated the effects of long-term OA on antioxidation, digestion, and structure of microbiota in hepatopancreas of oysters. The results of the research will provide a reference for the study of the response and adaptation mechanisms of bivalve mollusks in acidification seawater and provide a scientific basis for strategies to deal with OA.
2 MATERIAL AND METHOD 2.1 AnimalOysters C. gigas with an average shell length of 13.0 cm were collected from a local farm in Qingdao, China. The oysters were fed every other day with Spirulina platensis, and were kept in aerated seawater about 15 ℃ for two weeks before the experiment. Animal experiments were approved by the Qingdao Animal Care and Use Committee, which complied with the National Institute of Health Guide for the Care and Use of Laboratory Animals.
2.2 Experimental design and tissue collectionAll animal tanks with a volume of 100 L were continuously bubbled with ambient air or air-CO2 mixtures as appropriate, the water was changed every other day to ensure adequate water quality, and the oysters were fed with Spirulina platensis after changing the water. The pH value controlled by an acidometer (AiKB, Qingdao, China) was 7.50 in the OA group, the pH value predicted for the year of 2250 (Caldeira and Wickett, 2003), and was 8.10 in the control group, which was the mean pH value of the normal seawater. The temperature was controlled at 14.9±0.5 ℃ and 15.0±0.4 ℃ for the control group and OA group, respectively. The salinity was relatively stable, and it was 32.8±0.04 and 32.6±0.05 in the control group and OA group, respectively. The dissolved oxygen was monitored and adjusted by controlling bubbling of air and the dissolved oxygen in the control group and OA group was 7.73±0.04 and 7.83±0.02 mg/L, respectively.
In the experiments, oysters used for the detection of the biochemical parameters were grouped as following: 10 oysters kept in the seawater with pH 7.50 for 56 days were designated as O56 group, and the same number of oysters placed in the normal seawater with pH 8.10 for 14 days, then transferred to seawater with pH 7.50 for 42 days were designated as O42 group. The remaining OA groups (O28, O21, O14, and O7) were processed similarly, that was the oysters were maintained in normal seawater (28, 35, 42, and 49 days) firstly, and then kept in the acidified environment at the appointed time (28, 21, 14, and 7 days). As a comparison, 10 oysters in normal seawater with pH 8.10 for 56 days were set as the control group. The fresh hepatopancreas tissues from five random oysters were cut into pieces on ice, and the portions in the order of cutting with the weight of ~2 g were digested immediately and used for the reactive oxygen species (ROS) determination. The rest hepatopancreas of each group were then divided into several aliquots with the weight of ~100 mg. The aliquots were snap-frozen in liquid nitrogen and then stored at -80 ℃ for other detections.
To determine the microbiota of hepatopancreas, oysters were kept in the acidified seawater for 7, 28, and 56 days (O7, O28, and O56), and the control groups were set at the corresponding time points and designated as C7, C28, and C56. In the meantime, a population of 100 oysters was cultured in the normal seawater environment. During the whole process, the death rate of the population was lower than 2%, indicating that the oysters have attempted to adapt to this laboratory culture conditions, as well as excluded the possibility of infection from bacteria or virus, which might disturb their microbiota. Three oysters were randomly sampled in each experimental condition for the amplicon sequencing. About 50 mg of hepatopancreas samples from each oyster were harvested by dissection under sterile conditions and stored at -80 ℃ for genomic DNA extraction.
2.3 D etermination of intracellular reactive oxygen species (ROS) levelThe prepared tissues were minced and incubated with Pronase (20 μg/mL) in 1 100-mOsm/L Hank's buffer containing no Ca2+ or Mg2+ with gentle shaking at room temperature for 30 min (Jemaà et al., 2014). The supernatant was filtered (48-μm mesh) and then centrifuged at 800×g, 4 ℃ for 10 min. The obtained pellet was resuspended in Hank's buffer to adjust the cell concentration to 106 cells/mL. The intracellular ROS content was determined by incubating the cells with 2′, 7′-dichlorofluorescein diacetate (DCFH-DA) at a final concentration of 10 μm at 37 ℃ for 20 min, and ROS level was quantified by the median fluorescence intensity of 10 000 cells by FACS Arial II flow cytometer.
2.4 D etermination of antioxidant capability, lipid peroxidation, and digestive enzyme activitiesAntioxidant is the basic and important function of hepatopancreas, so superoxide dismutase (SOD) activity, glutathione (GSH) level, and total antioxidant capacity (T-AOC) were applied together to assess the change of antioxidant capacity during the acidification for 56 days. malondialdehyde (MDA) content was often used for the evaluation of the lipid peroxidation (Valavanidis et al., 2006). To investigate the effect of OA exposure on the digestive capacity of the hepatopancreas, the activity levels of three digestive enzymes including pepsin (PES), lipase (LPS), and amylase (AMS) were measured. The SOD activity was estimated by the nitro blue tetrazolium method according to the literature (Beauchamp and Fridovich, 1971). The level of GSH activity was measured based on the method of dithionitrobenzoic acid (DTNB) by detecting the absorbance of the yellow compound produced (Ringwood et al, 1999). The T-AOC was estimated by detecting the absorbance of 2, 2′-azinobis-3-ethylbenzothiazoline-6-sulfonic acid radical cation (ABTS) according to the reference (Miller et al., 1993). Lipid peroxidation was quantified by measuring the thiobarbituric acid reactive substances (TBARS) produced during lipid peroxidation, and expressed in terms of MDA content. The activity of PES was estimated by detecting the absorbance of the blue substance reduced by phenol-containing amino acids according to the reference (Rungruangsak and Utne, 1981). The LPS activity was measured based on the method of methyl resorufin substrate (Steiner, 2005). The AMS activity could be calculated by detecting the absorbance of the blue complex formed by the combination of iodine solution and unhydrolyzed starch (Xiao et al., 2006).
These physiological and biochemical parameters were measured with commercially available kits (Jiancheng, Nanjing, China) according to the manual instruction. For every indictor, three pieces of thawed tissues from each experimental group were randomly applied as the biological replicates. Each pieces of 100-mg tissues (wet weight) were homogenized by adding 9-fold phosphate buffered saline (PBS) buffer in a weight: volume ratio of 1꞉9 and the homogenates were then centrifuged at 3 500 r/min, 4 ℃ for 10 min. The supernatants obtained from each tissue were divided into three equal portions as technical replicates and prepared for detection. The total protein concentration in the supernatant was measured using the BCA assay kit (Tiangen, Beijing, China) to normalize the relevant data. The absorbance values were determined by the microplate reader (BioTek Synergy, Vermont, USA). SOD activity and T-AOC were expressed as U/mgand mmol/g of tissue protein, respectively. GSH and MDA content was expressed as nmol/mg of tissue protein. PES and AMS activity units were expressed as U/mg, whereas LPS activity was expressed in U/g of the tissue protein.
2.5 Genomic DNA extraction and deep amplicon sequencing of the 16S rDNA geneGenomic DNA extraction and amplicon sequencing were accomplished by the company (Novogene, Beijing, China). Genomic DNA was extracted using the cetyltrimethylammonium bromide (CTAB) reference to the literature (Raimundo et al., 2018). The quality and concentration of DNA were detected by agarose gel electrophoresis and NanoDrop® spectrophotometer, respectively. The DNA sample was diluted to 1 ng/μL and used for the amplification for the 16S rDNA gene using primers of 515F (5′-GTGCCAGCMGCCGCGGTAA-3′) and 806R (5′-GGACTACHVGGGTWTCTAAT-3′) targeting the variable regions 16S V4. The obtained PCR products were then purified with the Gel recovery Kit of Qiagen Gel Extraction Kit (Qiagen, Germany). The library was constructed using the Tru Seq® DNA PCR-Free Sample Preparation Kit (Illumina, California, USA). The constructed library was quantified by Qubit 4.0 Fluorometer (Thermo Fisher Scientific, Massachusetts, USA) and ABI 7500 Real time Thermal Cycler (Thermo Fisher Scientific). After the library was qualified, NovaSeq6000 sequencing platform (Illumina, California, USA) was used for on-line sequencing.
2.6 Data processing and analysisThe results of biochemical parameters were expressed as means±SD (n=3) and analyzed by Statistical Package for Social Sciences (SPSS) 17.0. The significant differences among groups were tested by one-way analysis of variance (ANOVA) and multiple comparisons and the assumptions of ANOVA (normality and homogeneity of variances) were met. The relationship was analyzed by the Pearson test. Differences were considered significant at P < 0.05.
Raw reads of amplicon sequencing were processed using QIIME (V1.9.1) (Caporaso et al., 2010) to obtain effective tags. After stitching and filtering, all the effective tags were clustered using Uparse (Uparse v7.0.1001) software (Haas et al., 2011). The effective sequences were clustered into Operational Taxonomic Units (OTUs) based on 97% sequence identity. The Mothur method and SILVA's SSUr RNA database were used for species annotation and classification analysis (Edgar, 2013). Samples were rarefied to the maximum depth of the sample with less sequencing depth, and rarefaction curves were plotted. Alpha diversity was evaluated using the Chao1 and Shannon Diversity Index. The Wilcox test of the agricolae package was used to analyze the sample α-diversity.
3 RESULT 3.1 Effects of OA exposure on antioxidant system capabilityThe antioxidant for SOD activity, GSH level, and T-AOC were presented in Fig. 1. Compared with the control group, SOD activity increased significantly on day 7 after OA exposure, which was about 1.59- fold of the control group. Then it decreased to the lowest concentration on day 28 with 30.49 U/mg, and gradually returned to normal level on the 42nd day (34.06 U/mg) and the 56th day (35.94 U/mg) (P < 0.05) (Fig. 1a). The GSH level decreased significantly from 78.04 μmol/g of the control group to 40.88 μmol/g of the O7 group, then it displayed an increasing tread until it reached the highest level with 85.56 μmol/g on day 42, followed by a bit drop with the concentration of 69.70 μmol/g on day 56 (P < 0.05) (Fig. 1b). The content of T-AOC decreased significantly during the whole acidification process, especially on day 56 when it decreased by 38.88% compared to the control group (P < 0.05) (Fig. 1c).

|
| Fig.1 SOD (a), GSH (b), and T-AOC (c) level in the hepatopancreatic after OA exposure The control in the abscissa represents the control groups, O represents the OA groups, and the numbers indicate the time of OA treatment. Each value is shown as mean±SD (n=3), and statistical significance (P < 0.05) was shown in different letters. |
The indicators of oxidative stress, ROS level, and MDA content were shown in Fig. 2. In this study, ROS level quantified by the relative fluorescence intensity of the hepatopancreas of the O7 group increased significantly to 1.35-fold (P < 0.05) compared with the control group, while the intensity decreased significantly after that (P < 0.05), with the lowest level on day 28 and reduced by 47.67% (Fig. 2a). Similarly, the MDA content increased significantly from 3.64 nmol/mg in the control group to 4.64 nmol/mg in the O7 group, and then it decreased to a significantly lower level in O14, O21, O28, and O42 groups, but it recovered to the control level on day 56 after OA exposure (Fig. 2b).

|
| Fig.2 ROS (a) and MDA (b) level in the hepatopancreatic of oyster after OA exposure The control in the abscissa represents the control groups, O represents the OA groups, and the numbers indicate the time of OA treatment. Each value is shown as mean±SD (n=3), and statistical significance (P < 0.05) was shown in different letters. |
The enzymatic activities for PES, LPS, and AMS in all treatments were presented in Fig. 3. The activity of PES in the hepatopancreas displayed no significant change during 42 days of OA exposure but decreased by 62.47% on day 56 (P < 0.05) (Fig. 3a). LPS activity was significantly reduced since day 7 after OA exposure, and reached a minimum level on day 28 at the level of 0.367 U/g. After that, it recovered gradually and almost reached the control level of 1.53 U/g on day 56. The change of AMS activity was similar to LPS that AMS activity decreased to the minimum level with 2.69 U/mg in the O28 group, and then increased to a significantly higher level on day 56 with 4.62 U/mg than that of the control group (P < 0.05) (Fig. 3b & c).

|
| Fig.3 PES (a), LPS (b), and AMS (c) activity in the hepatopancreatic after OA exposure The control in the abscissa represents the control groups, O represents the OA groups, and the numbers indicate the time of OA treatment. Each value is shown as mean±SD (n=3), and statistical significance (P < 0.05) was shown in different letters. |
The DNA samples from six groups including C7, O7, C28, O28, C56, and O56 were applied for the analysis of 16S rDNA deep amplicon sequencing, and a total of 1 145 895 effective tags were obtained (Supplementary Table S1). All Effective Tags were clustered into 5 007 OTUs based on 97% identity. Rarefaction analysis was performed to standardize and compare the taxon richness between samples. As shown in Supplementary Fig.S1, the rarefaction curve of different samples approached the saturation plateau, indicating that the data amount was reasonable, which met the requirements of subsequent analysis.
Alpha diversity metrics of the total species abundance index (Chao1) and species diversity index (Shannon) were presented in Fig. 4. The two indexes showed the same change tendency which was more clearly for the Shannon index. Taken Shannon index for details, it maintained no obvious change in the control groups, but in OA groups, it firstly reduced to a significantly lower level than that of the C7 group, and then it increased a bit in O28 group, but finally the Shannon index in O56 group decreased to the lowest level of the six groups. Briefly, the variations of Chao1 and Shannon indexes both suggested that the microbial community experienced a dynamic change after OA exposure, and the abundance of microbiota reduced greatly at the end of the two months of acidification.

|
| Fig.4 Chao1 and Shannon index of microbiota in the control groups and OA-treated groups The letter C in the abscissa represents the control groups, O represents the OA groups, and the numbers indicate the time of OA treatment. |
The relative abundance of microbial communities at the phylum level was analyzed and the relative abundance of the top 10 phyla was presented in Fig. 5. The dominant phylum in the hepatopancreas microbiota included Proteobacteria, Firmicutes, Tenericutes, and Bacteroidetes, all of which accounted for 81.52%–96.58% of the reads in the six groups, but the four phyla bacteria showed different change tendency during the acidification. Among them, the phylum Proteobacteria, which accounted for the largest ratio in all the groups, did not change after 7 days of acidification and increased from 54.64% in C28 to 65.36% in O28, while its abundance reduced from 61.81% in C56 to 36.44% in O56 group. The phylum of Firmicutes also did not change significantly after 7 days of acidification, while its abundance increased to 3.73 times in O28 and 8.74 times in O56 than that in the control group, which finally accounted for 26.50% of the reads in the O56 group. The abundance of Tenericutes decreased obviously after 7 and 28 days of acidification, but it increased from 10.59% in C56 to 23.94% in O56. For the Bacteroidetes, although its abundance increased to a much higher level of 19.14% after 7 days of CO2 treatment than the C7 group (3.81%), it recovered to normal levels in the O28 and O56 groups compared with C28 and C56 groups, respectively.

|
| Fig.5 Relative abundance of bacterial phyla in the control groups and OA groups The ordinate indicates the relative abundance of species at the phylum level. The letter C in the abscissa represents the control groups, O represents the OA groups, and the numbers indicate the time of OA treatment. |
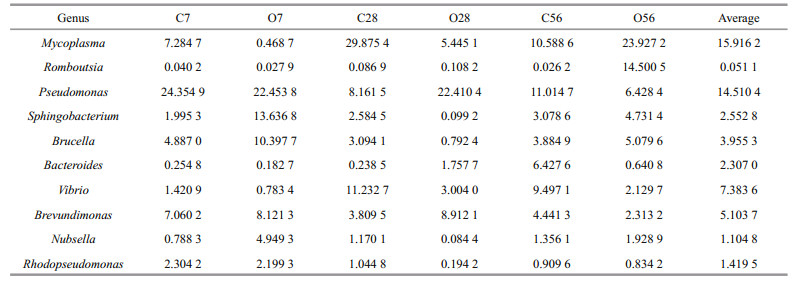
The abundance percentage of microbial communities at the genus level was further analyzed and the relative percentage of the top 10 genera were presented in Table 1. According to the mean value of the dominant species in the group of C7, C28, and C56, the three dominant genera in the control groups were Mycoplasma (15.9%), Pseudomonas (14.5%), and Vibrio (7.4%). To describe the change of the main species of microbiota, the abundance percentage of the three dominant genera were compared during the OA exposure. On day 7, the abundance percentage of genus Mycoplasma in the O7 group decreased from 7.284 7% to 0.468 7%, and Vibrio decreased from 1.420 9% to 0.783 4%, while there was no much difference for Pseudomonas. Compared with the control, the abundance percentages of Mycoplasma and Vibrio in the O28 group decreased by 24.430 3% and 8.228 7%, respectively, while Pseudomonas genus increased from 8.161 5% to 22.410 4%. On the contrary, the abundance percentage of Mycoplasma in the O56 group increased from 10.588 6% to 23.927 2%, and Romboutsia increased from 0.026 2% to 14.500 5% relative to the control group, while Pseudomonas reduced from 11.014 7% to 6.428 4%.
|
The top 35 most abundant genera in the control groups and OA-treated groups were selected for heatmap analysis (Fig. 6). The 35 genera belonged to the phyla of Actinobacteria, Bacteroidetes, Firmicutes, Proteobacteria, Tenericutes, and Verrucomicrobia, which were the most abundant as shown in Fig. 5. After 7-day OA exposure, five genera including Coxiella, Nubsella, Sphingobacterium, Brucella, and Devosia become more abundant than that in the C7 group. For the O28 group, Paracoccus, Enhydrobacter, Acinetobacter, and Limnobacter were more enriched than that in the C28 group. Notably, the enriched genera all belonged to microaerobic bacteria. After long-term OA exposure of 56 days, Order Clostridiales (unidentified Clostridiales, unidentified Lachnospiraceae, unidentified Ruminococcaceae, Romboutsia, and Faecalibacterium), which was famous for the anaerobic property, was more abundant than that of the C56 group.

|
| Fig.6 Abundance heap map of bacterial genus in the control groups and OA-treated groups The letter C in the abscissa represents the control groups, O represents the OA groups, and the numbers indicate the time of OA treatment. The vertical direction represents the different OA groups, and the horizontal direction represents the species annotation information. The cluster tree on the left of the figure was the species cluster tree and the 35 genera were clustered into 6 different phyla. The red colors in the picture indicate higher abundance and blue colors indicate lower abundance. |
Environmental stress can cause oxidative damage and elevate the steady-state level of ROS (Rada and Leto, 2008; Lushchak, 2011). Antioxidants, such as SOD and GSH are important substances that prevent ROS-mediated oxidative damage in bivalves (Soldatov et al., 2007). In this study, the activity of SOD increased significantly and the content of GSH decreased significantly after 7 days of acidification (Fig. 1a & b), indicating that the enhanced antioxidant response of the hepatopancreas might be an early adaptation mechanism that eliminated excess ROS under acidification stress. The similar results were observed in the hepatopancreas of clam Chamelea gallina and the mussel Mytilus galloprovincialis, which showed that the OA stress generally increased the activity of antioxidant enzymes after 7 days of acidification (Matozzo et al., 2013). Nevertheless, the T-AOC of the hepatopancreas reduced significantly after OA (Fig. 1c), indicating that OA would weaken the antioxidant capacity of the hepatopancreas. Correspondingly, the ROS and MDA content increased significantly after 7 days of acidification (Fig. 2), which indicated that the oysters suffered severe oxidative damage. The antioxidant system plays an important role in resisting environmental pressure, and its weakening will not be conducive to the long-term survival of oysters.
The activities of digestive enzymes experienced a dynamic process during the OA period. Some evidence showed that OA could inhibit the digestive enzyme activity of bivalves (Kong et al., 2019; Wang et al., 2020). For example, the hepatopancreas structure of blue mussel, Mytilus edulis was destroyed and the activities of AMS, protease, and LPS reduced significantly after 21 days of treatment in seawater with a pH of 7.10 (Xu et al., 2020). It was same that we found the AMS and LPS activities of oysters reduced significantly, but the difference was that the PES had no significant difference under short-term OA stress, and its activity reduced significantly only after long-term OA stress (Fig. 3a). In addition, the enzyme activities of LPS and AMS tended to return to the control levels or even increased after long-term OA (Fig. 3b & c). Digestive enzyme patterns can reflect the digestive capacity and indirectly reflect the metabolic profiles of various substances in oysters, and the metabolic efficiency determines the energy output (Debnath et al., 2007). The recovery of some certain digestive enzymes may be related to the energy metabolism of hepatopancreas and the adaptability to acidification. The previous studies have found that the main metabolic substrate in the energy metabolism of Petrolisthes cinctipes in OA was converted from lipid to proteins (Carter et al., 2013). However, after long-term OA treatment, protein digestion might not be sustainable, and the hepatopancreas metabolic pathways inclined to restore the activities of lipase and amylase to increase energy input. Especially for AMS, the enzyme activity was significantly higher than that of the control group after 56 days of acidification. The adaptation strategy of different species might be different. The previous study found that the activity of trypsin in the hepatopancreas of the thick shell mussels Mytilus coruscus was significantly inhibited after acidification for 7 days, but there was an obvious upward trend at day 14, which presumably due to the adaptive mechanism of M. coruscus under acidification conditions (Wang et al., 2020). In short, the dynamic course of the activities of the three digestive enzymes indicates that acidification can cause significant changes in the substrates of energy metabolism on hepatopancreas, which may be beneficial to the adaptation of oysters to the acidification environment.
The analysis of microbiota composition revealed that the microbiota of hepatopancreas had a high level of abundance and diversity, and more than 1 000 OTUs were found in the hepatopancreas microbiota under the normal condition (Supplementary Table S1). Among them, Proteobacteria, Firmicutes, Tenericutes, and Bacteroidetes were the dominant phyla, accounting for 81.52%–96.58% of the reads in the six groups, and other species were extremely low in abundance which might coexist harmlessly with the host in a normal environment (Fig. 5). Similar results were observed in oyster Crassostrea sikamea and scallop Argopecten purpuratus (Bernal et al., 2017; Muñoz et al., 2019), which showed that the rich diversity and the same dominant phyla. In the genus level, Mycoplasma (15.9%), Pseudomonas (14.5%), and Vibrio (7.4%) were the three-dominant genus of the hepatopancreas microbiota in normal oyster (Table 1). Traces of the three genera have been found in various bivalve microbiota, such as Crassostrea virginica (Li et al., 2019) and Pearl oyster Pinctada mazatlanica (Tremaroli and Bäckhed, 2012). Studies have shown that Mycoplasma appears abundant in the digestive gland of the healthy Sydney rock oysters Saccostrea glomerata and the intestines of the abalone Haliotis discus hannai (Green and Barnes, 2010; Roeselers et al., 2011). Some species of Mycoplasmas are only part of the natural microbiota and harmlessly symbiotic with the host, which use the substrate produced by the host or other microorganisms during the digestion process to proliferate (Pitcher and Nicholas, 2005). Pseudomonas produces a wide range of secondary metabolites, such as antibiotics, hydrogen cyanide or iron-chelating siderophores, and can inhibit a wide range of pathogenic bacteria (Campa-Córdova et al., 2009). The genus Vibrio is also a natural part of the host microbiota (Fernandez-Piquer et al., 2012; Vezzulli et al., 2018), which can provide chemical defense and produce digestive enzymes (AMS, LPS, and chitinase) to decompose dietary components for the host (Engel et al., 2002; Ray et al., 2012). The stable structure of microbiota is essential to maintain the homeostasis of the host (Sokolova et al., 2011), and a good composition and high diversity of hepatopancreas microbiota is indispensable for the physiological functions of oysters.
However, further analysis displayed that the structure of the hepatopancreas microbiota showed an obvious dynamic change during the process of acidification, and finally was changed greatly by OA treatment. At the beginning, the diversity of microbiota was greatly decreased compared with the control on day 7 of acidification (Fig. 4), and the abundance of some species, such as Mycoplasma and Vibrio was reduced greatly (Table 1), indicating that the hepatopancreas microbiota was sensitive to the change of the external environment, and the OA treatment might lead to apparent changes in the composition of the dominant genus and disrupt the dynamic balance of the original microbiota. The imbalance of bacterial community structure would be conducive to the growth of potential pathogenic components and the invasion of external pathogens (García-Bayona and Comstock, 2018), as revealed in the O28 group, a noticeable increase was observed in the abundance of Pseudomonas, Paracoccus, Enhydrobacter, and Acinetobacter, which were known as pathogens in marine aquaculture (Ferguson et al., 2004; Li et al., 2017). The higher abundance level of these genus bacteria might damage the immune defense function of the bacterial community and stimulate the invasion of the external bacteria, resulting in a temporarily richer diversity of microbiota in the O28 group. However, under the long-term OA treatment, the abundance and diversity of hepatopancreas microbiota were irreversibly decreased, as revealed by the decreased the Chao1 and Shannon index in the O56 group. To be detailed, many Vibrio species could help the host to decompose dietary components by producing digestive enzymes (AMS, LPS, and chitinase) (Ray et al., 2012). The abundance of Vibrio decreased significantly after long-term OA, which might be detrimental to the digestive process of the host in this study. In addition, it was found that the bacterial community was dominated by anaerobic or facultative anaerobic bacteria in the O56 group, which might be the consequence of increased hypoxia due to OA induced reduction of filtration activity (Xu et al., 2020). Taken an example, the abundance of order Clostridiales (unidentified Clostridiales, unidentified Lachnospiraceae, unidentified Ruminococcaceae, Romboutsia, and Faecalibacterium), which was famous for anaerobic, increased significantly (Fig. 6). These bacteria can produce lactic acid, formate, and other acidic products through anaerobic fermentative, which further promotes the acidification of the host internal environment (Mountfort et al., 1998; Bosshard et al., 2002; Duncan et al., 2002; Aujoulat et al., 2014; Gerritsen et al., 2014). In addition, the genus Mycoplasma, for example, which was a wellknown pathogen, was increased by 13.34% in the O56 group relative to the control (Table 1). Studies have shown that lower microbiota diversity in invertebrate is related to the presence of pathogens, and poor species richness is related to the sensitivity to pathogen invasion (Edgar, 2018), so long term acidification may threaten the survival of oysters due to the excessive proliferation of some potential pathogenic bacteria (Rottem, 2003; Pitcher and Nicholas, 2005). In short, the structure of the hepatopancreas microbiota was drastically changed after long-term OA, causing the decline of microbial diversity and abnormal proliferation of pathogenic and anaerobic bacteria, which in turn might further interfere with the digestive system, the immune reactions, and even the survival of oysters.
According to our result, it is worth noting that some of the responses and reactions in oyster hepatopancreas, such as the SOD activity, GSH content, MDA level, and the activities of LPS and AMS, tended to return to the control level after drastic changes, which indicated that oysters could partially adapt to the acidified environment through the changes of some enzymes or substances after longterm acidification. Taken the enzymes in the digestive system as an example, studies have found that bivalves can alleviate or even offset the adverse effects of OA under adequate food conditions, which fully demonstrates the importance of digestive capacity to adapt to acidified environments for bivalves (Melzner et al., 2011; Thomsen et al., 2013; Pansch et al., 2014). In this study, the activity of AMS increased significantly relative to control after longterm acidification, supposing that feeding high-starch content might be conducive to the survival of oysters in an acidified environment. On the contrary, some other reactions have shown an obvious difference between short-term and long-term OA conditions. For instance, ROS level increased significantly after acidification for 7 days but decreased significantly after long-term acidification. The abundance and diversity of hepatopancreas microbiota increased obviously after acidification of 28 days but decreased in O56 group. The available data not only remind us that two months or even longer time are required for the purpose to better understand the adaptability of shellfish to the elevated CO2, but also suggest the possibility to improve the adaptability of oysters to OA to some extent by adding antioxidants and the abundance and variety of probiotics to oyster feed.
5 CONCLUSIONHaving characterized the responses on the antioxidant capacity, the digestive ability, and the microbiota composition in the hepatopancreas of oyster C. gigas under OA conditions, we revealed that the recovery of LPS and AMS activity might be beneficial to the adaptation of oysters to the acidification environment, while the inhibition of T-AOC could cause the accumulation of oxidative damage during the long time OA condition. Meanwhile, the inevitable decline of microbial diversity and the abnormal proliferation of pathogenic and anaerobic bacteria caused by OA may affect the normal physiological function of the hepatopancreas, which would be harmful to the survival of oyster. The data are helpful for the understanding of the potential implications of OA for shellfish physiological functions, and provide some scientific basis to improve the adaptability to the elevated CO2.
6 DATA AVAILABILITY STATEMENTThe data used to support the findings of this study are available from the corresponding author upon request.
Electronic supplementary materialSupplementary material (Supplementary Table S1 & Fig.S1) is available in the online version of this article at https://doi.org/10.1007/s00343-021-0462-x.
Amaral V, Cabral H N, Bishop M J. 2012. Moderate acidification affects growth but not survival of 6-month-old oysters. Aquatic Ecology, 46(1): 119-127.
DOI:10.1007/s10452-011-9385-5 |
Aujoulat F, Bouvet P, Jumas-Bilak E, Jean-Pierre H, Marchandin H. 2014. Veillonella seminalis sp. nov., a novel anaerobic Gram-stain-negative coccus from human clinical samples, and emended description of the genus Veillonella. International Journal of Systematic and Evolutionary Microbiology, 64(Pt 10): 3526-3531.
|
Beauchamp C, Fridovich I. 1971. Superoxide dismutase: improved assays and an assay applicable to acrylamide gels. Analytical Biochemistry, 44(1): 276-287.
DOI:10.1016/0003-2697(71)90370-8 |
Beniash E, Ivanina A, Lieb N S, Kurochkin I, Sokolova I M. 2010. Elevated level of carbon dioxide affects metabolism and shell formation in oysters Crassostrea virginica. Marine Ecology Progress Series, 419: 95-108.
DOI:10.3354/meps08841 |
Bernal M G, Fernández N T, Lastra P E S, Marrero R M, Mazón-Suástegui J M. 2017. Streptomyces effect on the bacterial microbiota associated to Crassostrea sikamea oyster. Journal of Applied Microbiology, 122(3): 601-614.
DOI:10.1111/jam.13382 |
Bosshard P P, Zbinden R, Altwegg M. 2002. Turicibacter sanguinis gen. nov., sp. nov., a novel anaerobic, Grampositive bacterium. International Journal of Systematic and Evolutionary Microbiology, 52(Pt 4): 1263-1266.
|
Butt R L, Volkoff H. 2019. Gut microbiota and energy homeostasis in fish. Frontiers in Endocrinology, 10: 9.
DOI:10.3389/fendo.2019.00009 |
Caldeira K, Wickett M E. 2003. Oceanography: anthropogenic carbon and ocean pH. Nature, 425(6956): 365.
DOI:10.1038/425365a |
Campa-Córdova A I, González-Ocampo H, Luna-González A, Mazón-Suástegui J M, Ascencio F. 2009. Growth, survival, and superoxide dismutase activity in juvenile Crassostrea corteziensis (Hertlein, 1951) treated with probiotics. Hidrobiológica, 19(2): 151-158.
|
Canesi L, Borghi C, Ciacci C, Fabbri R, Vergani L, Gallo G. 2007a. Bisphenol-A alters gene expression and functional parameters in molluscan hepatopancreas. Molecular and Cellular Endocrinology, 276(1-2): 36-44.
DOI:10.1016/j.mce.2007.06.002 |
Canesi L, Borghi C, Fabbri R, Ciacci C, Lorusso L C, Gallo G, Vergani L. 2007b. Effects of 17β-estradiol on mussel digestive gland. General and Comparative Endocrinology, 153(1-3): 40-46.
DOI:10.1016/j.ygcen.2007.02.005 |
Caporaso J G, Kuczynski J, Stombaugh J, Bittinger K, Bushman F D, Costello E K, Fierer N, Peña A G, Goodrich J K, Gordon J I, Huttley G A, Kelley S T, Knights D, Koenig J E, Ley R E, Lozupone C A, McDonald D, Muegge B D, Pirrung M, Reeder J, Sevinsky J R, Turnbaugh P J, Walters W A, Widmann J, Yatsunenko T, Zaneveld J, Knight R. 2010. QIIME allows analysis of high-throughput community sequencing data. Nature Methods, 7(5): 335-336.
DOI:10.1038/nmeth.f.303 |
Carter H A, Ceballos-Osuna L, Miller N A, Stillman J H. 2013. Impact of ocean acidification on metabolism and energetics during early life stages of the intertidal porcelain crab Petrolisthes cinctipes. Journal of Experimental Biology, 216(Pt 8): 1412-1422.
|
Clements J C, Hunt H L. 2017. Effects of CO2-driven sediment acidification on infaunal marine bivalves: a synthesis. Marine Pollution Bulletin, 117(1-2): 6-16.
DOI:10.1016/j.marpolbul.2017.01.053 |
Coleman F C, Williams S L. 2002. Overexploiting marine ecosystem engineers: potential consequences for biodiversity. Trends in Ecology & Evolution, 17(1): 40-44.
|
Debnath D, Pal A K, Sahu N P, Yengkokpam S, Baruah K, Choudhury D, Venkateshwarlu G. 2007. Digestive enzymes and metabolic profile of Labeo rohita fingerlings fed diets with different crude protein levels. Comparative Biochemistry and Physiology Part B: Biochemistry and Molecular Biology, 146(1): 107-114.
DOI:10.1016/j.cbpb.2006.09.008 |
Doney S C, Fabry V J, Feely R A, Kleypas J A. 2009. Ocean acidification: the other CO2 problem. Annual Review of Marine Science, 1: 169-192.
DOI:10.1146/annurev.marine.010908.163834 |
Doney S C, Ruckelshaus M, Duffy J E, Barry J P, Chan F English C A, Galindo H M, Grebmeier J M, Hollowed A B, Knowlton N, Polovina J, Rabalais N N, Sydeman W J, Talley L D. 2012. Climate change impacts on marine ecosystems. Annual Review of Marine Science, 4: 11-37.
DOI:10.1146/annurev-marine-041911-111611 |
Duncan S H, Hold G L, Harmsen H J M, Stewart C S, Flint H J. 2002. Growth requirements and fermentation products of Fusobacterium prausnitzii, and a proposal to reclassify it as Faecalibacterium prausnitzii gen. nov., comb. nov. International Journal of Systematic and Evolutionary Microbiology, 52(Pt 6): 2141-2146.
|
Edgar R C. 2013. UPARSE: highly accurate OTU sequences from microbial amplicon reads. Nature Methods, 10(10): 996-998.
DOI:10.1038/nmeth.2604 |
Edgar R C. 2018. Updating the 97% identity threshold for 16S ribosomal RNA OTUs. Bioinformatics, 34(14): 2371-2375.
DOI:10.1093/bioinformatics/bty113 |
Engel S, Jensen P R, Fenical W. 2002. Chemical ecology of marine microbial defense. Journal of Chemical Ecology, 28(10): 1971-1985.
DOI:10.1023/A:1020793726898 |
Ferguson H W, Collins R O, Moore M, Coles M, MacPhee D D. 2004. Pseudomonas anguilliseptica infection in farmed cod, Gadus morhua L. Journal of Fish Diseases, 27(4): 249-253.
DOI:10.1111/j.1365-2761.2004.00537.x |
Fernandez-Piquer J, Bowman J P, Ross T, Tamplin M L. 2012. Molecular analysis of the bacterial communities in the live Pacific oyster (Crassostrea gigas) and the influence of postharvest temperature on its structure. Journal of Applied Microbiology, 112(6): 1134-1143.
DOI:10.1111/j.1365-2672.2012.05287.x |
Fitzer S C, Phoenix V R, Cusack M, Kamenos N A. 2014. Ocean acidification impacts mussel control on biomineralisation. Scientific Reports, 4: 6218.
|
Fonseca F, Cerqueira R, Fuentes J. 2019. Impact of ocean acidification on the intestinal microbiota of the marine sea bream (Sparus aurata L. ). Frontiers in Physiology, 10: 1446.
|
García-Bayona L, Comstock L E. 2018. Bacterial antagonism in host-associated microbial communities. Science, 361(6408): eaat2456.
DOI:10.1126/science.aat2456 |
Gerritsen J, Fuentes S, Grievink W, van Niftrik L, Tindall B J, Timmerman H M, Rijkers G T, Smid H. 2014. Characterization of Romboutsia ilealis gen. nov., sp. nov., isolated from the gastro-intestinal tract of a rat, and proposal for the reclassification of five closely related members of the genus Clostridium into the genera Romboutsia gen. nov., Intestinibacter gen. nov., Terrisporobacter gen. nov. and Asaccharospora gen. nov. International Journal of Systematic and Evolutionary Microbiology, 64(Pt 5): 1600-1616.
|
Gobler C J, Talmage S C. 2013. Short- and long-term consequences of larval stage exposure to constantly and ephemerally elevated carbon dioxide for marine bivalve populations. Biogeosciences, 10(4): 2241-2253.
DOI:10.5194/bg-10-2241-2013 |
Green T J, Barnes A C. 2010. Bacterial diversity of the digestive gland of Sydney rock oysters, Saccostrea glomerata infected with the paramyxean parasite, Marteilia sydneyi. Journal of Applied Microbiology, 109(2): 613-622.
DOI:10.1111/j.1365-2672.2010.04687.x |
Gu H X, Shang Y Y, Clements J, Dupont S, Wang T, Wei S S, Wang X H, Chen J F, Huang W, Hua M H, Wang Y J. 2019. Hypoxia aggravates the effects of ocean acidification on the physiological energetics of the blue mussel Mytilus edulis. Marine Pollution Bulletin, 149: 110538.
DOI:10.1016/j.marpolbul.2019.110538 |
Gutowska M A, Melzner F, Langenbuch M, Bock C, Claireaux G, Pörtner H O. 2010. Acid-base regulatory ability of the cephalopod (Sepia officinalis) in response to environmental hypercapnia. Journal of Comparative Physiology B, 180(3): 323-335.
DOI:10.1007/s00360-009-0412-y |
Haas B J, Gevers D, Earl A M, Feldgarden M, Ward D V, Giannoukos G, Ciulla D, Tabbaa D, Highlander S K, Sodergren E, Methé B, DeSantis T Z, The Human Microbiome Consortium, Petrosino J F, Knight R, Birren B W. 2011. Chimeric 16S rRNA sequence formation and detection in Sanger and 454-pyrosequenced PCR amplicons. Genome Research, 21(3): 494-504.
DOI:10.1101/gr.112730.110 |
Hoegh-Guldberg O, Mumby P J, Hooten A J, Steneck R S, Greenfield P, Gomez E, Harvell C D, Sale P F, Edwards A J, Caldeira K, Knowlton N, Eakin C M, Iglesias-Prieto R, Muthiga N, Bradbury R H, Dubi A, Hatziolos M E. 2007. Coral reefs under rapid climate change and ocean acidification. Science, 318(5857): 1737-1742.
DOI:10.1126/science.1152509 |
Jemaà M, Morin N, Cavelier P, Cau J, Strub J M, Delsert C. 2014. Adult somatic progenitor cells and hematopoiesis in oysters. Journal of Experimental Biology, 217(Pt 17): 3067-3077.
|
Khan B, Clinton S M, Hamp T J, Oliver J D, Ringwood A H. 2018. Potential impacts of hypoxia and a warming ocean on oyster microbiomes. Marine Environmental Research, 139: 27-34.
DOI:10.1016/j.marenvres.2018.04.018 |
Kong H, Wu F L, Jiang X Y, Wang T, Hu M H, Chen J F, Huang W, Bao Y B, Wang Y J. 2019. Nano-TiO2 impairs digestive enzyme activities of marine mussels under ocean acidification. Chemosphere, 237: 124561.
DOI:10.1016/j.chemosphere.2019.124561 |
Kurihara H. 2008. Effects of CO2-driven ocean acidification on the early developmental stages of invertebrates. Marine Ecology Progress Series, 373: 275-284.
DOI:10.3354/meps07802 |
Li J, Cao J L, Wang X, Liu N, Wang W M, Luo Y. 2017. Acinetobacter pittii, an emerging new multi-drug resistant fish pathogen isolated from diseased blunt snout bream (Megalobrama amblycephala Yih) in China. Applied Microbiology and Biotechnology, 101(16): 6459-6471.
DOI:10.1007/s00253-017-8392-4 |
Li Y F, Chen Y W, Xu J K, Ding W Y, Shao A Q, Zhu Y T, Wang C, Liang X, Yang J L. 2019. Temperature elevation and Vibrio cyclitrophicus infection reduce the diversity of haemolymph microbiome of the mussel Mytilus coruscus. Scientific Reports, 9(1): 16391.
DOI:10.1038/s41598-019-52752-y |
Liu Y W, Sutton J N, Ries J B, Eagle R A. 2020a. Regulation of calcification site pH is a polyphyletic but not always governing response to ocean acidification. Science Advances, 6(5): eaax1314.
DOI:10.1126/sciadv.aax1314 |
Liu Z Q, Zhou Z, Zhang Y K, Wang L L, Song X R, Wang W L, Zheng Y, Zong Y N, Lv Z, Song L S. 2020b. Ocean acidification inhibits initial shell formation of oyster larvae by suppressing the biosynthesis of serotonin and dopamine. Science of the Total Environment, 735: 139469.
|
Lushchak V I. 2011. Environmentally induced oxidative stress in aquatic animals. Aquatic Toxicology, 101(1): 13-30.
DOI:10.1016/j.aquatox.2010.10.006 |
Mackay A. 2008. Climate change 2007: impacts, adaptation and vulnerability. Contribution of working group II to the fourth assessment report of the intergovernmental panel on climate change. Journal of Environment Quality, 37(6): 2407.
|
Matozzo V, Chinellato A, Munari M, Bressan M, Marin M G. 2013. Can the combination of decreased pH and increased temperature values induce oxidative stress in the clam Chamelea gallina and the mussel Mytilus galloprovincialis?. Marine Pollution Bulletin, 72(1): 34-40.
DOI:10.1016/j.marpolbul.2013.05.004 |
Melzner F, Stange P, Trübenbach K, Thomsen J, Casties I, Panknin U, Gorb S N, Gutowska M A. 2011. Food supply and seawater pCO2 impact calcification and internal shell dissolution in the blue mussel Mytilus edulis. PLoS One, 6(9): e24223.
DOI:10.1371/journal.pone.0024223 |
Miller N J, Rice-Evans C, Davies M J, Gopinathan V, Milner A. 1993. A novel method for measuring antioxidant capacity and its application to monitoring the antioxidant status in premature neonates. Chemical Science, 84(4): 407-412.
|
Mountfort D O, Rainey F A, Burghardt J, Kaspar H F, Stackebrandt E. 1998. Psychromonas antarcticus gen. nov., sp. nov., a new aerotolerant anaerobic, halophilic psychrophile isolated from pond sediment of the McMurdo Ice Shelf, Antarctica. Archives of Microbiology, 169(3): 231-238.
|
Muñoz K, Flores-Herrera P, Gonçalves A T, Rojas C, Yáñez C, Mercado L, Brokordt K, Schmitt P. 2019. The immune response of the scallop Argopecten purpuratus is associated with changes in the host microbiota structure and diversity. Fish & Shellfish Immunology, 91: 241-250.
|
Paillard C, Le Roux F, Borrego J J. 2004. Bacterial disease in marine bivalves, a review of recent studies: Trends and evolution. Aquatic Living Resources, 17(4): 477-498.
DOI:10.1051/alr:2004054 |
Pansch C, Schaub I, Havenhand J, Wahl M. 2014. Habitat traits and food availability determine the response of marine invertebrates to ocean acidification. Global Change Biology, 20(3): 765-777.
DOI:10.1111/gcb.12478 |
Parker L M, Ross P M, O'Connor W A, Pörtner H O, Scanes E, Wright J M. 2013. Predicting the response of molluscs to the impact of ocean acidification. Biology, 2(2): 651-692.
|
Pitcher D G, Nicholas R A J. 2005. Mycoplasma host specificity: fact or fiction?. Veterinary Journal, 170(3): 300-306.
DOI:10.1016/j.tvjl.2004.08.011 |
Pruzzo C, Gallo G, Canesi L. 2005. Persistence of vibrios in marine bivalves: the role of interactions with haemolymph components. Environmental Microbiology, 7(6): 761-772.
|
Rada B, Leto T L. 2008. Oxidative innate immune defenses by Nox/Duox family NADPH oxidases. Contributions to Microbiology, 15: 164-187.
|
Raimundo J, Reis C M G, Ribeiro M M. 2018. Rapid, simple and potentially universal method for DNA extraction from Opuntia spp. fresh cladode tissues suitable for PCR amplification. Molecular Biology Reports, 45: 1405-1412.
|
Ray A K, Ghosh K, Ringø E. 2012. Enzyme-producing bacteria isolated from fish gut: a review. Aquaculture Nutrition, 18(5): 465-492.
|
Ribes M, Calvo E, Movilla J, Logares R, Coma R, Pelejero C. 2016. Restructuring of the sponge microbiome favors tolerance to ocean acidification. Environmental Microbiology Reports, 8(4): 536-544.
|
Ringwood A H, Conners D E, Keppler C J, DiNovo A A. 1999. Biomarker studies with juvenile oysters (Crassostrea virginica) deployed in-situ. Biomarkers, 4(6): 400-414.
|
Rodolfo-Metalpa R, Houlbrèque F, Tambutté É, Boisson F, Baggini C, Patti F P, Jeffree R, Fine M, Foggo A, Gattuso J P, Hall-Spencer J M. 2011. Coral and mollusc resistance to ocean acidification adversely affected by warming. Nature Climate Change, 1(6): 308-312.
|
Roeselers G, Mittge E K, Stephens W Z, Parichy D M, Cavanaugh C M, Guillemin K, Rawls J F. 2011. Evidence for a core gut microbiota in the zebrafish. The ISME Journal, 5(10): 1595-1608.
|
Rottem S. 2003. Interaction of mycoplasmas with host cells. Physiological Reviews, 83(2): 417-432.
|
Rungruangsak K, Utne F. 1981. Effect of different acidified wet feeds on protease activities in the digestive tract and on growth rate of rainbow trout (Salmo gairdneri Richardson). Aquaculture, 22: 67-79.
|
Sokolova I M, Sukhotin A A, Lannig G. 2011. Stress effects on metabolism and energy budgets in mollusks. In: Abele D, Vázquez-Medina J P, Zenteno-Savín T eds. Oxidative Stress in Aquatic Ecosystems. John Wiley & Sons, Oxford. p. 263–280.
|
Soldatov A A, Gostyukhina O L, Golovina I V. 2007. Antioxidant enzyme complex of tissues of the bivalve Mytilus galloprovincialis Lam. under normal and oxidative-stress conditions: a review. Applied Biochemistry and Microbiology, 43(5): 556-562.
|
Steiner J M. 2005. Clinical utility of a new lipase activity assay. Veterinary Clinical Pathology, 34(3): 176-177.
|
Talmage S C, Gobler C J. 2010. Effects of past, present, and future ocean carbon dioxide concentrations on the growth and survival of larval shellfish. Proceedings of the National Academy of Sciences of the United States of America, 107(40): 17246-17251.
|
Thomsen J, Casties I, Pansch C, Körtzinger A, Melzner F. 2013. Food availability outweighs ocean acidification effects in juvenile Mytilus edulis: laboratory and field experiments. Global Change Biology, 19(4): 1017-1027.
|
Tremaroli V, Bäckhed F. 2012. Functional interactions between the gut microbiota and host metabolism. Nature, 489(7415): 242-249.
|
Valavanidis A, Vlahogianni T, Dassenakis M, Scoullos M. 2006. Molecular biomarkers of oxidative stress in aquatic organisms in relation to toxic environmental pollutants. Ecotoxicology and Environmental Safety, 64(2): 178-189.
|
Vezzulli L, Stagnaro L, Grande C, Tassistro G, Canesi L, Pruzzo C. 2018. Comparative 16SrDNA gene-based microbiota profiles of the pacific oyster (Crassostrea gigas) and the mediterranean mussel (Mytilus galloprovincialis) from a shellfish farm (Ligurian Sea, Italy). Microbial Ecology, 75(2): 495-504.
|
Wang Q, Cao R W, Ning X X, You L P, Mu C K, Wang C L, Wei L, Cong M, Wu H F, Zhao J M. 2016. Effects of ocean acidification on immune responses of the Pacific oyster Crassostrea gigas. Fish & Shellfish Immunology, 49: 24-33.
|
Wang X H, Huang W, Wei S S, Shang Y Y, Gu H X, Wu F Z, Lan Z H, Hu M H, Shi H H, Wang Y J. 2020. Microplastics impair digestive performance but show little effects on antioxidant activity in mussels under low pH conditions. Environmental Pollution, 258: 113691.
|
Wei L, Wang Q, Wu H F, Ji C L, Zhao J M. 2015. Proteomic and metabolomic responses of Pacific oyster Crassostrea gigas to elevated pCO2 exposure. Journal of Proteomics, 112: 83-94.
|
Xiao Z Z, Storms R, Tsang A. 2006. A quantitative starch-iodine method for measuring alpha-amylase and glucoamylase activities. Analytical Biochemistry, 351(1): 146-148.
|
Xu M X, Sun T L, Tang X X, Lu K Y, Jiang Y S, Cao S, Wang Y. 2020. CO2 and HCl-induced seawater acidification impair the ingestion and digestion of blue mussel Mytilus edulis. Chemosphere, 240: 124821.
|
Zhang G F, Fang X D, Guo X M, Li L, Luo R B, Xu F, Yang P C, Zhang L L, Wang X T, Qi H G, Xiong Z Q, Que H Y, Xie Y L, Holland P W H, Paps J, Zhu Y B, Wu F C, Chen Y X, Wang J F, Peng C F, Meng J, Yang L, Liu J, Wen B, Zhang N, Huang Z Y, Zhu Q H, Feng Y, Mount A, Hedgecock D, Xu Z, Liu Y J, Domazet-Loso T, Du Y S, Sun X Q, Zhang S D, Liu B H, Cheng P Z, Jiang X T, Li J, Fan D D, Wang W, Fu W J, Wang T, Wang B, Zhang J B, Peng Z Y, Li Y X, Li N, Wang J P, Chen M S, He Y, Tan F J, Song X R, Zheng Q M, Huang R L, Yang H L, Du X D, Chen L, Yang M, Gaffney P M, Wang S, Luo L H, She Z C, Ming Y, Huang W, Zhang S, Huang B Y, Zhang Y, Qu T, Ni P X, Miao G Y, Wang J Y, Wang Q, Steinberg C E W, Wang H Y, Li N, Qian L M, Zhang G J, Li Y R, Yang H M, Liu X, Wang J, Yin Y, Wang J. 2012. The oyster genome reveals stress adaptation and complexity of shell formation. Nature, 490(7418): 49-54.
|
Zhao L Q, Shirai K, Tanaka K, Milano S, Higuchi T, Murakami-Sugihara N, Walliser E O, Yang F, Deng Y W, Schöne B R. 2020. A review of transgenerational effects of ocean acidification on marine bivalves and their implications for sclerochronology. Estuarine, Coastal and Shelf Science, 235: 106620.
|