 2022, Vol. 40
Institute of Oceanology, Chinese Academy of Sciences
Article Information
- TIAN Di, ZHOU Feng, ZHANG Wenyan, ZHANG Han, MA Xiao, GUO Xinyu
- Effects of dissolved oxygen and nutrients from the Kuroshio on hypoxia off the Changjiang River estuary
- Journal of Oceanology and Limnology, 40(2): 515-529
- http://dx.doi.org/10.1007/s00343-021-0440-3
Article History
- Received Nov. 13, 2020
- accepted in principle Jan. 28, 2021
- accepted for publication Mar. 18, 2021


2 Observation and Research Station of Yangtze River Delta Marine Ecosystems, Ministry of Natural Resources, Zhoushan 316022, China;
3 Ocean College, Zhejiang University, Zhoushan 316021, China;
4 Institute of Coastal Research, Helmholtz-Zentrum Geesthacht, Geesthacht 21502, Germany;
5 Southern Marine Science and Engineering Guangdong Laboratory(Zhuhai), Zhuhai 519082, China;
6 Center for Marine Environmental Study, Ehime University, Matsuyama 790-8577, Japan
Hypoxia, conventionally defined as dissolved oxygen (DO) concentrations ≤2.0 mg/L (62.5 mmol/m3; 1.4 mL/L), has expanded rapidly throughout coastal areas of the world since the mid-20th century (Gilbert et al., 2010; Rabalais et al., 2010). More than 500 coastal hypoxic zones have been reported and are typically considered to result from human activities through over-enrichment of nutrients (Diaz and Rosenberg, 2008; Breitburg et al., 2018a). Deficits in DO threaten the marine ecosystem, which lead to reductions in ocean productivity and biodiversity as well as changes to biogeochemical cycles (Vaquer-Sunyer and Duarte, 2008; Levin et al., 2009; Zhang et al., 2010). The biological effects of hypoxia are strengthened in conjunction with ocean acidification (Melzner et al., 2013). Currently, hypoxia is one of the most challenging global marine environmental issues (Diaz, 2001; Keeling et al., 2010; Breitburg et al., 2018b).
In the East China Sea (ECS), which has one of the largest continental shelves in the world, a seasonal (June-October) bottom water DO deficit with complex spatial and temporal variations, has been frequently observed offshore of the Changjiang (Yangtze) River estuary (CJE) in recent decades (Tian et al., 1993; Chen et al., 2007; Wei et al., 2007; Zhu et al., 2011, 2017; Ni et al., 2016). Hypoxia in the ECS was first detected in the late 1950s (Gu, 1980) but did not receive much attention until summer hypoxia of 1999 was well-documented (Li et al., 2002). In that summer, the hypoxic zone (< 2 mg/L) was estimated to encompass ~13 700 km2 at an average thickness of 20 m and a minimum DO concentration of 1 mg/L (Li et al., 2002). Over the past decades, the ECS hypoxic area expanded from 10 000 to 20 000 km2 (Wei et al., 2007; Wang et al., 2012), comparable to one of the largest coastal hypoxia areas in the world (northern Gulf of Mexico; Rabalais et al., 2002; Bianchi et al., 2010).
The formation and evolution of coastal hypoxia is controlled by multiple factors, which are closely related to both physical and biogeochemical processes (Zhang and Wirtz, 2017; Zhang et al., 2019b). The mechanisms controlling seasonal hypoxia in the offshore area of the CJE have been widely investigated via field observations (Wang, 2009; Li et al., 2011; Wang et al., 2012; Luo et al., 2018) and numerical modeling (Zhou et al., 2017; Zhang et al., 2019a, 2020; Zhou et al., 2020). It is generally suggested that this hypoxia formation and evolution is highly modulated by wind (Ni et al., 2016; Guo et al., 2019; Liblik et al., 2020), runoff (notably from the Changjiang River; Zhang et al., 2018), Kuroshio intrusion (Qian et al., 2017; Zhang et al., 2018; Zuo et al., 2019), nutrient loading (Zhu et al., 2017), and tides (Zhu et al., 2017). Bottom topography is also regarded as a factor influencing the residence time of hypoxic water (Wang, 2009).
The Kuroshio, a western boundary current of the Pacific Ocean, originates east of the Philippines, intrudes into the South China Sea (SCS) through the Luzon Strait and into the ECS mainly through the shelf-break northeast of Taiwan, China (Wu et al., 2017). The annual mean volume transport of the Kuroshio east of Taiwan, China (to 123°E) was 27.5 Sv (1 Sv=106 m3/s), and the annual mean volume transport across the 200 m isobath was around 2.6 Sv in 2006 (Zhou et al., 2015). Kuroshio intrusion has a profound influence on marine circulation and ecosystems in the ECS (Zhang et al., 2007; Sugimoto et al., 2009; Yang et al., 2011; Tian et al., 2019; Meng at al., 2020). In the ECS, more nutrients are sourced from the ocean than land (Chen and Wang, 1999). Wong et al. (2000) showed that the nutrient supply of the ECS shelf is mostly from subsurface Kuroshio water and, to a lesser extent, from the Changjiang River. The degradation of marine organic matter, as well as plankton respiration, represents the dominant consumption of oxygen in the bottom waters of the CJE hypoxic zone (Wang et al., 2016).
Recently, some studies have reported the effects of Kuroshio intrusion on the development of hypoxia in the ECS (Qian et al., 2017; Zhou et al., 2017; Zuo et al., 2019; Große et al., 2020). The north-south movement of the ECS hypoxic zone is related to the northward extension of the Taiwan Warm Current (Wang et al., 2012). Qian et al. (2017) demonstrated that intruded bottom water masses, mixed by subsurface Kuroshio and SCS waters, exert a synergistic control on DO concentrations in the area offshore of the CJE and significantly influence hypoxia formation. Yang et al. (2018) suggested that relatively cold, oxygen-poor, and nutrient-rich deep water from the Kuroshio may influence ECS hypoxia. Meanwhile, subsurface Kuroshio intrusion also can influence the extent of bottom water hypoxia by regulating bottom water residence time offshore of the CJE (Zhang et al., 2019a). However, an opposing view was proposed by Zuo et al. (2019), who argued that the Kuroshio carries high concentrations of DO onto the continental shelf and alleviates the ECS oxygen deficit. This same phenomenon (Kuroshio intrusion) has been found to diminish the degree of coastal hypoxia offshore the Zhujiang (Pearl) River estuary in the northern SCS (Lui et al., 2020). Hence, the effects of Kuroshio intrusion on DO concentrations in coastal regions are still unclear. Furthermore, the relative contribution of different nutrients and DO in Kuroshio water to ECS hypoxia is less understood.
We addressed this lack of knowledge by investigating the influence of Kuroshio DO and nutrients (silicate, nitrate, and phosphate) on ECS hypoxia using a coupled physical-biogeochemical model. The effect of Taiwan Strait water on hypoxia is also discussed. In general, the conventional definition of hypoxic water (DO concentrations of 2.0 mg/L) is below the empirical hypoxia threshold for more sensitive taxa. This has implications for the conservation of coastal biodiversity because hypoxia thresholds differ greatly among marine benthic organisms (Vaquer-Sunyer and Duarte, 2008). To ensure consistency with previous research (e.g., Chen et al., 2007; Zhou et al., 2017, 2020), hypoxia is defined in this study as DO concentrations less than 3.0 mg/L (2.1 mL/L).
2 METHOD 2.1 Coupled physical-biogeochemical modelWe used a coupled physical-biogeochemical coupled model in this study. The physical model is based on Regional Ocean Modelling Systems (ROMS), which is a free surface, terrain-following and three-dimensional primitive equations ocean model (Shchepetkin and McWilliams, 2005; Haidvogel et al., 2008). The model domain covers the Bohai and Yellow seas and the ECS (23.5°N-41.0°N, 117.5°E-132.0°E; Fig. 1) at a horizontal resolution of 1/24° (~4 km) and 30 vertical layers in a s-coordinate system.

|
| Fig.1 Model domain and bathymetry The yellow shading indicates bottom water hypoxia (dissolved oxygen (DO) concentrations < 3.0 mg/L) offshore of the Changjiang River estuary from an August 2006 field survey. The solid arrows represent paths of different water masses: Yellow Sea Coastal Current (YSCC), Yellow Sea Warm Current (YSWC), Tsushima Warm Current (TSWC), Taiwan Warm Current (TWC), and Kuroshio. On the southern East China Sea continental shelf, four Kuroshio intrusion branches in summer are represented (Yang et al., 2012): Kuroshio Branch Current (KBC, water depths < 60 m), Offshore Kuroshio Branch Current (OKBC, water depths between ~60-120 m), Nearshore Kuroshio Branch Current (NKBC, water depths between ~120-250 m) and the westward Kuroshio branch (UW). CDW: Changjiang Diluted Water. |
The model spin-up and forcing conditions (surface heat flux, momentum, and fresh water; lateral boundary conditions; river runoff) for a realistic run of 2006 were the same as Zhou et al. (2020). The hydrodynamic model was spun up for three years, initialized from a January climatological mean derived from multi-year observations (Chen, 1992) and driven by monthly forcing data from the Comprehensive Oceanographic Atmospheric Data Sets (da Silva et al., 1994). The realistic run of 2006 was initialized from the output of the last iteration of the spin-up. In this run, the surface fluxes of heat and precipitation/evaporation were from ERA-Interim data sets (European Centre for Medium-Range Weather Forecasts; Dee et al., 2011). The wind vector data were from the Blended Sea Winds (https://www.ncdc.noaa.gov/data-access/marineocean-data/blended-global/blended-sea-winds; Zhang et al., 2006; Peng et al., 2013). Lateral boundary conditions for temperature, salinity, current velocity, and sea surface elevation were from the Global Hybrid Coordinate Ocean Model realistic simulation for 2006 (Kelly et al., 2007). The monthly mean for Changjiang River runoff was also included in our realistic run. Further details on the setup of the ROMS model and its validation can be found in Zhou et al. (2015), which demonstrated a good model performance in capturing the key physics of the ECS.
The biogeochemical model is the Carbon, Silicate and Nitrogen Ecosystem (CoSiNE; Chai et al., 2002; Xiu and Chai, 2014) model, which consists of 11 stated variables, including four nutrients (silicate, nitrate, phosphate, and ammonium), two phytoplankton groups (small phytoplankton and diatoms), two grazer groups (microzooplankton and mesozooplankton), two classes of detritus (small/suspended and large/sinking), and DO, coupled online to physical processes. Among many biological parameters, the photosynthetically active radiation saturation for diatoms is 100.0 W/m2, the maximum specific growth rate for small phytoplankton and diatoms is 3.0/d and 3.5/d, respectively. The initial and boundary conditions of the CoSiNE model are derived from the output of the CoSiNE-Pacific model (Xiu and Chai, 2011). More details on the setup and parameters of the CoSiNE model and its validation for the ECS are in Zhou et al.(2017, 2020). Their results indicated that the development of hypoxia and observed vertical profiles of DO are reasonably reproduced by this coupled model.
The realistic run for 2006 had four iterations, driven by the same realistic forcing but with initial conditions from the last iteration. This procedure can reduce the bias between model results and observations. Three-day-mean outputs of the last model year were saved for analysis. The realistic run of 2006 was considered the reference run (Ref-run).
The initial DO concentration is important for the numerical experiments. Moreover, the prognostic DO concentration of the model is also constrained by the boundary DO values where the monthly mean output from the large-domain model was prescribed. In the Ref-run, the spatial distribution of the initial DO concentration in the bottom layer and at surface, and the initially vertical distribution of DO along 23.5°N (the south boundary of the model domain) and at specific locations (representing the Kuroshio) are shown in Fig. 2. The DO concentration in the Kuroshio varies notably with depth, ranging from ~7-~3 mg/L. The vertical structures (Fig. 2d) are consistent with Zuo et al. (2019).

|
| Fig.2 Initial dissolved oxygen (DO) concentration in the reference run a-b. spatial distribution in the bottom layer (a) and at surface (b); c-d. vertical structure along 23.5°N (c) and at the locations of 122.5°E, 23.5°N (in red) and 123.0°E, 23.5°N (in blue) (d). |
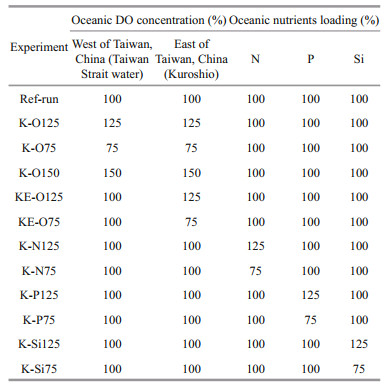
Nutrients and DO from the open ocean are transported into the ECS continental shelf via either the Taiwan Strait or Kuroshio (Fig. 1). We performed several sensitivity experiments using different DO concentrations in the open ocean to demonstrate their influence on ECS hypoxia (Table 1). In the first experiment (K-O125), DO concentrations in the Kuroshio and Taiwan Strait, represented by the oceanic DO concentration at the southern boundary, were increased by 25% relative to the Ref-run. In the second experiment (K-O75), oceanic DO concentrations at the southern boundary were decreased by 25%. The third experiment (K-O150) represented an extreme case in which oceanic DO concentrations at the southern boundary were increased by 50%. To distinguish whether the water is from the Kuroshio or from Taiwan Strait, additional two experiments were performed in the scenarios that DO concentrations at the southern boundary east of Taiwan, China, increased by 25% (KE-O125) or decreased by 25% (KE-O75), respectively. The differences between K-O125 and K-O75, and KE-O125 and KE-O75, show the contribution of Taiwan Strait water. Our decision to use 25% changes (increases or decreases) in oceanic DO relative to the Ref-run is consistent with Große et al. (2020) and in accordance with changes in DO projected by Coupled Model Intercomparison Project Phase 5 (CMIP5) Earth system models over the western North Pacific Ocean by the end of the 21st century under the high-emission Representative Concentration Pathway 8.5 scenario (Bopp et al., 2017).
|
To explore the response of ECS hypoxia to nutrient loading (nitrate, phosphate, and silicate were treated separately here) from oceanic sources (Kuroshio and Taiwan Strait), two experiments were designed for each nutrient (Table 1) with corresponding concentrations at the southern boundary increased or decreased by 25%. The sensitivity experiment setting is based on an analysis of observation data that showed nitrate concentrations in the Kuroshio north of Taiwan, China, increased by ~25% from the 1980s to 2000s (Guo et al., 2012).
Although the Kuroshio intrusion into the ECS mainly occurs at the shelf break northeast of Taiwan, China, it also can enter the Taiwan Strait after intruding the Luzon Strait and become a part of Taiwan Strait water. Xu et al. (2020) suggested that Taiwan Strait water has little influence on the production of chlorophyll offshore of the CJE. The influence of oceanic DO from the Taiwan Strait water on hypoxia offshore of the CJE is negligible relative to the Kuroshio (as discussed in the Section 3.1). Therefore, the influence of DO and nutrients from the open ocean are mainly attributed to the Kuroshio.
2.3 Maximum hypoxia extentFollowing Zhou et al. (2017), the maximum hypoxia extent (MHE) was adopted to represent the most probable spatial coverage of hypoxia during a specified period (e.g., 1 month or 1 year):

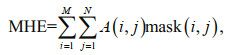
where O is the DO concentration (mg/L) in the bottom layer, Omin is the minimum DO concentration (mg/L) within a specified time period, k is the time index; mask(i, j) is an index (1=hypoxia; 0=otherwise; a non-dimensional number) at each model grid; if Omin(i, j) ≤3.0 mg/L, then mask(i, j)=1, otherwise, mask(i, j)=0; A is the grid area (km2) and i and j are grid indices in the meridional and zonal directions, respectively. Consistent with the MHE (km2), the 3-day-mean hypoxia extent (km2), which shows the synoptic variability of hypoxia, is also represented by the areas with DO concentrations less than 3.0 mg/L.
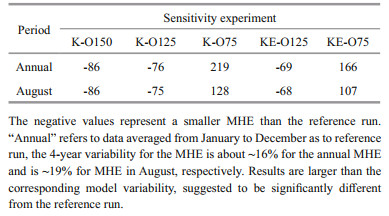
3 RESULT 3.1 Influence of Kuroshio to DO concentrationThe DO concentration in the ECS is widely influenced by intruded DO from the Kuroshio (Fig. 3). With a 50% increase in open ocean DO content, the DO concentration in the core hypoxic area (29°N-32°N, 122°E-124°E) increased by ~23% during the hypoxic season (July-September); with a 25% increase, the resulting DO concentration increased ~11%. Correspondingly, the area of hypoxic water represented by the MHE decreased along with higher DO concentrations in the open ocean (K-O150 and K-O125) compared with the Ref-run (Fig. 4a-b). The distinctive contraction of hypoxia was found in the northern, eastern, and southern areas of the CJE. Compared with the Ref-run, the MHE in K-O125 decreased 76% annually and 75% in August when hypoxia was most significant (Table 2). The difference in MHE between K-O150 and Ref-run was even larger at ~86% in August and annually (Table 2). In K-O75, the experiment with a 25% reduction in open ocean DO concentrations, the MHE increased 219% annually and 128% in August compared with the Ref-run. Hypoxic water also spread significantly southward and eastward (Fig. 4c).

|
| Fig.3 Anomalies in dissolved oxygen (DO) concentration in the bottom water averaged from July to September in DO sensitivity experiments relative to the reference run (Ref-run) a. K-O150; b. K-O125; c. K-O75; d. KE-O125; e. KE-O75. |

|
| Fig.4 Spatial distribution of annual minimum dissolved oxygen (DO) concentrations in the bottom water from sensitivity experiments a. K-O150; b. K-O125; c. K-O75. The black line indicates DO concentrations of 3.0 mg/Lin the Ref-run, and the red line indicates this concentration in the sensitivity experiment. |
|
In addition to the spatial extent of hypoxia, its duration and the minimum DO concentration are also sensitive to changes in oceanic DO concentrations, mainly supplied by the Kuroshio. Variations in the time series of the 3-day-mean hypoxic area were similar among the sensitivity experiments, but there were significant differences in their magnitude and duration, although the onset of hypoxia was similar (Fig. 5a). Generally, lower DO concentrations in the Kuroshio prolong hypoxia, while higher DO concentrations shorten its duration. For example, in K-O75, the hypoxia persisted until October, which was 1 month longer than the Ref-run (Fig. 5a). Moreover, the difference between K-O125 and the Ref-run was much larger than between K-O150 and K-O125 (but smaller than between K-O75 and the Ref-run), which suggests that hypoxia exhibits a nonlinear response to changes in DO concentrations.

|
| Fig.5 Comparisons of the reference run (Ref-run) and sensitivity experiments The 3-day-mean hypoxia extent (103 km2) (a-b) and maximum hypoxia extent (MHE, 104 km2) (c-d) in each month of 2006 in DO sensitivity experiments (left row) and nutrient sensitivity experiments (right row). |
The hypoxic area represented by the MHE was largest in August in all runs (Fig. 5c), with the lowest minimum DO concentration appearing at the same time (Fig. 6) in the area offshore of the CJE (Fig. 7). In August, the MHE was most vulnerable to changes in Kuroshio DO concentrations. We also determined that the hypoxic area is more affected by changing Kuroshio DO concentrations than hypoxia intensity, considering that the bottom water minimum DO concentrations in August were similar in the different sensitivity experiments.

|
| Fig.6 Time series of minimum dissolved oxygen (DO) concentrations in 2006 a. DO sensitivity experiments; b. nutrient sensitivity experiments. |

|
| Fig.7 Spatial distribution of minimum dissolved oxygen (DO) concentrations in June-October from sensitivity experiments a-e. K-O150; f-j. K-O125; k-o. K-O75. The black line indicates a DO of 3.0 mg/L in the Ref-run, and the red line indicates this same concentration in the sensitivity experiment. |
The DO concentrations offshore the CJE are dominated by oceanic DO input from the Kuroshio. In KE-O125 and KE-O75, the DO concentrations in the core hypoxic area (29°N-32°N, 122°E-124°E) varied by ~9% relative to the reference run, slightly smaller than the changes (~11%) in K-O125 and K-O75 (Fig. 3). The spatial distribution of hypoxic water in KE-O125/KE-O75 were similar to K-O125/ K-O75 (Fig. 8), which suggests that the hypoxic area is mainly affected by Kuroshio intrusion into the bottom water of the shelf-break northeast of Taiwan, China, and any effect from the Taiwan Strait is almost negligible.

|
| Fig.8 Spatial distribution of annual minimum dissolved oxygen (DO) concentrations from sensitivity experiments a. KE-O125/K-O125; b. KE-O75/K-O75. The red contour line indicates DO concentrations of 3.0 mg/L in the experiment, and the black contour line indicates DO concentrations of 3.0 mg/L in experiments K-O125 and K-O75. |
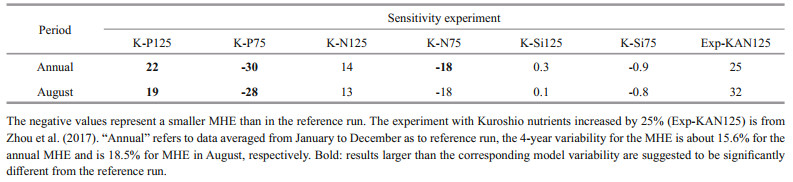
Variations in major nutrient (nitrate, phosphate, and silicate) concentrations of the Kuroshio were not as important as DO variations to the development of hypoxia offshore of the CJE and in ECS bottom waters (Figs. 9 & 10). A 25% change in each nutrient only led to a 2% variation in bottom water DO concentrations over the core hypoxic area in July- September (Fig. 3). Generally, the MHE expands slightly with increased nutrient concentrations and shrinks westward when nutrient concentrations decrease. The largest change in the monthly MHE in all sensitivity experiments occurred again in August (Table 3). The hypoxia extent was more sensitive to changes in phosphate concentrations than other nutrients because phosphate is usually a limiting factor for phytoplankton growth offshore of the CJE. With a 25% increase in phosphate concentrations, the MHE grew by 19% in August; there was also a 13% growth in the MHE when nitrate was increased by 25%. With a 25% decrease in phosphate and nitrate concentrations, the MHE contracted by 28% and 18%, respectively, in August. These quantitative results suggest that the MHE is more sensitive to decreased nutrient concentrations than to increases in nutrients. The impact of silicate concentrations on the MHE was negligible (Table 3).

|
| Fig.9 Dissolved oxygen (DO) concentration anomalies in the bottom water averaged from July to September in nutrient sensitivity experiments relative to the reference run (Ref-run) a. K-N125; b. K-N75; c. K-P125; d. K-P75; e. K-Si125; f. K-Si75. |

|
| Fig.10 Spatial distribution of annual minimum dissolved oxygen (DO) concentrations in the bottom water from sensitivity experiments a. K-P125; b. K-N125; c. K-Si125; d. K-P75; e. K-N75; f. K-Si75. The black contour line indicates 3.0 mg/L in the reference run, and the red line indicates the same concentration in the sensitivity experiments. |
|
Our sensitivity experiments indicate that intrusions of the Kuroshio affect hypoxia in the area offshore of the CJE in different ways. The DO content in the Kuroshio affects the ECS bottom water DO concentrations directly through advection and diffusion, which are hydrodynamic processes associated with Kuroshio intrusion; these processes eventually modify the intensity and distribution of hypoxia. In contrast, the effect of this DO intrusion on biochemical processes is limited (Fig. 11). A 50% change in the DO in the Kuroshio led to only a slight change (< 2%) in ECS phytoplankton concentrations. Hence, these results support the conclusion that intruded Kuroshio water masses exert a synergistic control on the initial DO concentration that led to the development of hypoxia in the ECS, and future DO decreases in the open ocean may exacerbate hypoxia (Qian et al., 2017).

|
| Fig.11 Changes in Surface chlorophyll-a (Chl-a) concentrations averaged from July to September in DO sensitivity experiments relative to the reference run (Ref-run) a. reference run (Ref-run); b. K-O150; c. K-O125; d. K-O75. The dashed and solid lines represent the 30-m and 50-m isobaths, respectively. |
Nutrient concentrations in the Kuroshio affect the ECS hypoxic zone through hydrodynamic and biogeochemical processes. Among nitrate, phosphate, and silicate, phosphate is the chief limiting factor on phytoplankton growth. Our results show that increased concentrations of nitrate and phosphate stimulated phytoplankton growth (represented by chlorophyll-a concentrations) in Zhejiang coastal water, whereas nutrient decreases constrained growth (Fig. 12a-d). In the area offshore of the CJE and its adjacent sea, surface chlorophyll-a concentrations in K-P75 and K-P125 obviously varied relative to the Ref-run, with changes mainly 6% to 12% more than in K-N75 and K-N125, especially in the region of water depths < 30 m. Photic zone export and deeper degradation of high amounts of biomass eventually overtake oxygen consumption in the bottom water. Overall, the influence of silicate is slight (Fig. 12e & f), which is consistent with previous results that silicate limitation on phytoplankton growth in the CJE rarely occurs (Zhou et al., 2008).

|
| Fig.12 Changes in surface chlorophyll-a (Chl-a) concentrations averaged from July to September in nutrient sensitivity experiments relative to the reference run (Ref-run) a. K-N125; b. K-N75; c. K-P125; d. K-P75; e. K-Si125; f. K-Si75. The dashed and solid lines represent the 30-m and 50-m isobaths, respectively. |
Hypoxic water is associated with both riverine and oceanic nutrients. Zhou et al. (2017) suggested that annual mean MHE would increase by 29% if all nutrients carried by the Kuroshio were elevated by 25%, which is consistent with our results in the nutrient sensitivity experiments (Table 3). Our study further quantified the relative importance of three major nutrients in the Kuroshio as phosphate > nitrate > silicate. The relative importance of riverine nutrients in affecting hypoxia is expected to be smaller compared with the Kuroshio. Specifically, the MHE should expand by 14% when all nutrient loadings from the Changjiang River are increased by 30% (Zhou et al., 2017). That is partly because the nutrient flux into the ECS from the open ocean exceeds the Changjiang River (Chen and Wang, 1999; Wong et al., 2000; Zhang et al., 2007). Chen and Wang (1999) suggested that rivers contribute only 7% of the total phosphorus input and about 38% of the total nitrogen input in the ECS. Xu et al. (2020) also pointed out that summer algal blooms in the northern ECS are mainly a result of riverine nutrient input from the Changjiang River (contribution of 59%), while in the southern ECS blooms are supported by oceanic nutrients (contribution of 85%). Moreover, riverine nutrients are quite rich in nitrate and silicate but low in phosphate. Compared with oceanic sources, riverine nitrogen from the Changjiang River has a larger effect on oxygen consumption in the ECS (Große et al., 2020). In our study, the nitrate concentration at the mouth of the Changjiang River was about 95 mmol/m3 in the simulated year, lower than silicate (~102 mmol/m3) but almost two orders of magnitude higher than phosphate (~1.58 mmol/m3). Nitrate transport from the Changjiang River was ~2.1 kmol/s (66×109 mol/a) and phosphate transport was ~0.034 kmol/s (1.05×10⁹ mol/a). The riverine N/P ratio was ~62, which is smaller than a previous estimate of 111 (Chen and Wang, 1999), but we only considered NO3 in our study; however, our N/P ratio was still higher than the Redfield ratio (16) for phytoplankton growth. According to Chen and Wang (1999), seawater transported to the ECS has an N/P ratio of 21 (N: 301×109 mol/a; P: 14.5×10⁹ mol/a), which is much closer to the Redfield ratio. That is also the reason surface chlorophyll a in the ECS is more sensitive to variations in Kuroshio phosphate concentrations with respect to nitrate and silicate.
4.3 Future improvementIn the sensitivity experiments of our study, the amplitude of relative change in DO and nutrients is set to be same for all types of Kuroshio waters. Although the intruded Kuroshio Subsurface Water is proved to be more important for the ECS than other types of Kuroshio water (Kuroshio Surface Water, Kuroshio Intermediate Water, and Kuroshio Deep Water). However, further sensitivity experiments with different amplitudes of relative change in DO and nutrients for different types of Kuroshio water would be worth to quantitatively investigate in future work if sufficient field data are collected to support the scenarios.
5 CONCLUSIONThe effects of DO and different nutrients (silicate, nitrate, and phosphate) in the Kuroshio on the development of hypoxia in the ECS were studied with a validated ROMS-CoSiNE model. Our results suggest that DO concentrations in the Kuroshio modify the distribution and intensity of hypoxia in the ECS mainly through hydrodynamic processes associated with intrusion of Kuroshio water. Kuroshio DO concentrations have a limited effect on phytoplankton growth in the ECS. The extent of hypoxia, represented by the MHE, showed a negative correlation with DO concentrations (R=0.96, P < 0.01). Relative to the Ref-run, the MHE in the ECS decreased by 76% when Kuroshio DO concentration increased by 25%, whereas the MHE increased by 219% when Kuroshio DO concentration decreased by 25%. A further increase in Kuroshio DO concentrations by 50% would lead to a decrease of the MHE by 86% compared with the Ref-run. The effect of DO from Taiwan Strait water was almost negligible compared with the oceanic source east of the Taiwan Strait.
The effect of Kuroshio nutrients on hypoxia in the area offshore of the CJE was opposite to that of Kuroshio DO. Increased nutrients typically stimulate phytoplankton growth, resulting in an expansion of the MHE, whereas decreased nutrients suppress phytoplankton and contract the MHE. The MHE offshore of the CJE is most sensitive to changes in Kuroshio phosphate concentrations (~22%-30% change in the MHE with a 25% change in phosphate), while it is least sensitive to changes in silicate (~0.3%-0.9% change in the MHE with a 25% change in silicate). The MHE changed by ~14%-18% with a 25% change in nitrate. Our modeling results suggest that the DO concentration in the area offshore of the CJE is influenced by both intruded DO and nutrients from the Kuroshio, and variations in DO in the Kuroshio seem to play a more important role than nutrients in the development of hypoxia. In reality, decreases in DO and increased nutrients in the Kuroshio always occur simultaneously, so their combined effects on ECS hypoxia are nonlinearly dependent on their sum.
6 DATA AVAILABILITY STATEMENTThe datasets generated for this study are available on request to the corresponding author. Model outputs used for the figures and tables will be available at https://www.soed.org.cn/index.php/scientific/data.
7 ACKNOWLEDGMENTWe thank anonymous reviewers for their constructive comments that helped to improve this paper.
Bianchi T S, DiMarco S F, Cowan J H Jr, Hetland R D, Chapman P, Day J W, Allison M A. 2010. The science of hypoxia in the Northern Gulf of Mexico: a review. Science of the Total Environment, 408(7): 1 471-1 484.
DOI:10.1016/j.scitotenv.2009.11.047 |
Bopp L, Resplandy L, Untersee A, Le Mezo P, Kageyama M. 2017. Ocean (de)oxygenation from the Last Glacial Maximum to the twenty-first century: insights from Earth System models. Philosophical Transactions of the Royal Society A: Mathematical, Physical and Engineering Sciences, 375(2102): 20160323.
DOI:10.1098/rsta.2016.0323 |
Breitburg D, Grégoire M, Isensee K. 2018a. Global Ocean Oxygen Network 2018. The ocean is losing its breath: Declining oxygen in the world's ocean and coastal waters. IOC-UNESCO, IOC Technical Series, No. 137, 40p.
|
Breitburg D, Levin L A, Oschlies A, Gregoire M, Chavez F P, Conley D J, Garcon V, Gilbert D, Gutierrez D, Isensee K, Jacinto G S, Limburg K E, Montes I, Naqvi S W A, Pitcher G C, Rabalais N N, Roman M R, Rose K A, Seibel B A, Telszewski M, Yasuhara M, Zhang J. 2018b. Declining oxygen in the global ocean and coastal waters. Science, 359(6371): eaam7240.
DOI:10.1126/science.aam7240 |
Chai F, Dugdale R C, Peng T H, Wilkerson F P, Barber R T. 2002. One-dimensional ecosystem model of the equatorial Pacific upwelling system. Part Ⅰ: model development and silicon and nitrogen cycle. Deep Sea Research Part Ⅱ. Topical Studies in Oceanography, 49(13-14): 2 713-2 745.
DOI:10.1016/S0967-0645(02)00055-3 |
Chen C C, Gong G C, Shiah F K. 2007. Hypoxia in the East China Sea: one of the largest coastal low-oxygen areas in the world. Marine Environmental Research, 64(4): 399-408.
DOI:10.1016/j.marenvres.2007.01.007 |
Chen C T A, Wang S L. 1999. Carbon, alkalinity and nutrient budgets on the East China Sea continental shelf. Journal of Geophysical Research: Oceans, 104(C9): 20 675-20 686.
DOI:10.1029/1999JC900055 |
Chen D X. 1992. Marine Atlas of Bohai Sea, Yellow Sea, East China Sea: hydrology. China Ocean Press, Beijing.
(in Chinese)
|
da Silva A M, Young C C, Levitus S. 1994. Atlas of Surface Marine Data 1994, vol 1. Algorithms and Procedures, NOAA Atlas NESDIS 6, US Dep of Comm, Washington DC. 83p.
|
Dee D P, Uppala S M, Simmons A J, Berrisford P, Poli P, Kobayashi S, Andrae U, Balmaseda M A, Balsamo G, Bauer P, Bechtold P, Beljaars A C M, van de Berg L, Bidlot J, Bormann N, Delsol C, Dragani R, Fuentes M, Geer A J, Haimberger L, Healy S B, Hersbach H, Hólm E V, Isaksen L, Kållberg P, Köhler M, Matricardi M, McNally A P, Monge-Sanz B M, Morcrette J J, Park B K, Peubey C, de Rosnay P, Tavolato C, Thépaut J N, Vitart F. 2011. The ERA-Interim reanalysis: configuration and performance of the data assimilation system. Quarterly Journal of the Royal Meteorological Society, 137(656): 553-597.
DOI:10.1002/qj.828 |
Diaz R J, Rosenberg R. 2008. Spreading dead zones and consequences for marine ecosystems. Science, 321(5891): 926-929.
DOI:10.1126/science.1156401 |
Diaz R J. 2001. Overview of Hypoxia around the World. Journal of Environmental Quality, 30(2): 275-281.
DOI:10.2134/jeq2001.302275x |
Gilbert D, Rabalais N N, DȪaz R J, Zhang J. 2010. Evidence for greater oxygen decline rates in the coastal ocean than in the open ocean. Biogeosciences, 7(7): 2 283-2 296.
DOI:10.5194/bg-7-2283-2010 |
Große F, Fennel K, Zhang H Y, Laurent A. 2020. Quantifying the contributions of riverine vs. oceanic nitrogen to hypoxia in the East China Sea. Biogeosciences, 17(10): 2 701-2 714.
DOI:10.5194/bg-17-2701-2020 |
Gu H K. 1980. The maximum value of dissolved oxygen in its vertical distribution in Yellow Sea. Acta Oceanologica Sinica, 2(2): 70-80.
(in Chinese with English abstract) |
Guo X Y, Zhu X H, Wu Q S, Huang D J. 2012. The Kuroshio nutrient stream and its temporal variation in the East China Sea. Journal of Geophysical Research: Oceans, 117(C1): C01026.
DOI:10.1029/2011jc007292 |
Guo Y R, Rong Z R, Li B, Xu Z, Li P X, Li X D. 2019. Physical processes causing the formation of hypoxia off the Changjiang estuary after Typhoon Chan-hom, 2015. Journal of Oceanology and Limnology, 37(1): 1-17.
DOI:10.1007/s00343-019-7336-5 |
Haidvogel D B, Arango H, Budgell W P, Cornuelle B D, Curchitser E, Di Lorenzo E, Fennel K, Geyer W R, Hermann A J, Lanerolle L, Levin J, McWilliams J C, Miller A J, Moore A M, Powell T M, Shchepetkin A F, Sherwood C R, Signell R P, Warner J C, Wilkin J. 2008. Ocean forecasting in terrain-following coordinates: formulation and skill assessment of the Regional Ocean Modeling System. Journal of Computational Physics, 227(7): 3 595-3 624.
DOI:10.1016/j.jcp.2007.06.016 |
Keeling R F, Kortzinger A, Gruber N. 2010. Ocean deoxygenation in a warming world. Annual Review of Marine Science, 2: 199-229.
DOI:10.1146/annurev.marine.010908.163855 |
Kelly K A, Thompson L, Cheng W, Metzger E J. 2007. Evaluation of HYCOM in the Kuroshio Extension region using new metrics. Journal of Geophysical Research: Oceans, 112(C1): C01004.
DOI:10.1029/2006jc003614 |
Levin L A, Ekau W, Gooday A J, Jorissen F, Middelburg J J, Naqvi S W A, Neira C, Rabalais N N, Zhang J. 2009. Effects of natural and human-induced hypoxia on coastal benthos. Biogeosciences, 6(10): 2 063-2 098.
DOI:10.5194/bg-6-2063-2009 |
Li D J, Zhang J, Huang D J, Wu Y, Liang J. 2002. Oxygen depletion off the Changjiang (Yangtze River) estuary. Science in China Series D: Earth Sciences, 45(12): 1 137-1 126.
DOI:10.1360/02yd9110 |
Li X G, Yu Z M, Song X X, Cao X H, Yuan Y Q. 2011. The seasonal characteristics of dissolved oxygen distribution and hypoxia in the Changjiang estuary. Journal of Coastal Research, 27(6A): 52-62.
DOI:10.2112/JCOASTRES-D-11-00013.1 |
Liblik T, Wu Y J, Fan D D, Shang D H. 2020. Wind-driven stratification patterns and dissolved oxygen depletion off the Changjiang (Yangtze) Estuary. Biogeosciences, 17(10): 2 875-2 895.
DOI:10.5194/bg-17-2875-2020 |
Lui H K, Chen C T A, Hou W P, Liau J M, Chou W C, Wang Y L, Wu C R, Lee J, Hsin Y C, Choi Y Y. 2020. Intrusion of kuroshio helps to diminish coastal hypoxia in the coast of Northern South China Sea. Frontiers in Marine Science, 7: 565952.
DOI:10.3389/fmars.2020.565952 |
Luo X F, Wei H, Fan R F, Liu Z, Zhao L, Lu Y Y. 2018. On influencing factors of hypoxia in waters adjacent to the Changjiang estuary. Continental Shelf Research, 152: 1-13.
DOI:10.1016/j.csr.2017.10.004 |
Melzner F, Thomsen J, Koeve W, Oschlies A, Gutowska M A, Bange H W, Hansen H P, Körtzinger A. 2013. Future ocean acidification will be amplified by hypoxia in coastal habitats. Marine Biology, 160(8): 1 875-1 888.
DOI:10.1007/s00227-012-1954-1 |
Meng Q C, Xuan J L, Zhang W Y, Zhou F, Hao Q, Zhao Q, Schrum C. 2020. Impact of submesoscale vertical advection on primary productivity in the Southern East China Sea. Journal of Geophysical Research: Biogeosciences, 125(8): e2019JG005540.
DOI:10.1029/2019JG005540 |
Ni X B, Huang D J, Zeng D Y, Zhang T, Li H L, Chen J F. 2016. The impact of wind mixing on the variation of bottom dissolved oxygen off the Changjiang Estuary during summer. Journal of Marine Systems, 154: 122-130.
DOI:10.1016/j.jmarsys.2014.11.010 |
Peng G, Zhang H M, Frank H P, Bidlot J R, Higaki M, Stevens S, Hankins W R. 2013. Evaluation of various surface wind products with OceanSITES buoy measurements. Weather and Forecasting, 28(6): 1 281-1 303.
DOI:10.1175/WAF-D-12-00086.1 |
Qian W, Dai M H, Xu M, Kao S J, Du C J, Liu J W, Wang H J, Guo L G, Wang L F. 2017. Non-local drivers of the summer hypoxia in the East China Sea off the Changjiang Estuary. Estuarine, Coastal and Shelf Science, 198: 393-399.
DOI:10.1016/j.ecss.2016.08.032 |
Rabalais N N, DȪaz R J, Levin L A, Turner R E, Gilbert D, Zhang J. 2010. Dynamics and distribution of natural and human-caused hypoxia. Biogeosciences, 7(2): 585-619.
DOI:10.5194/bg-7-585-2010 |
Rabalais N N, Turner R E, Wiseman W J Jr. 2002. Gulf of Mexico Hypoxia, A. K. A. "The Dead Zone". Annual Review of Ecology and Systematics, 33: 235-263.
DOI:10.1146/annurev.ecolsys.33.010802.150513 |
Shchepetkin A F, McWilliams J C. 2005. The regional oceanic modeling system (ROMS): a split-explicit, free-surface, topography-following-coordinate oceanic model. Ocean Modelling, 9(4): 347-404.
DOI:10.1016/j.ocemod.2004.08.002 |
Sugimoto R, Kasai A, Miyajima T, Fujita K. 2009. Transport of oceanic nitrate from the continental shelf to the coastal basin in relation to the path of the Kuroshio. Continental Shelf Research, 29(14): 1 678-1 688.
DOI:10.1016/j.csr.2009.05.013 |
Tian D, Su J, Zhou F, Mayer B, Sein D, Zhang H, Huang D J, Pohlmann T. 2019. Heat budget responses of the eastern China seas to global warming in a coupled atmosphere, ocean model. Climate Research, 79(2): 109-126.
DOI:10.3354/cr01579 |
Tian R C, Hu F X, Martin J M. 1993. Summer Nutrient Fronts in the Changjiang (Yantze River) Estuary. Estuarine, Coastal and Shelf Science, 37(1): 27-41.
DOI:10.1006/ecss.1993.1039 |
Vaquer-Sunyer R, Duarte C M. 2008. Thresholds of hypoxia for marine biodiversity. Proceedings of the National Academy of Sciences of the United States of America, 105(40): 15 452-15 457.
DOI:10.1073/pnas.0803833105 |
Wang B D, Wei Q S, Chen J F, Xie L P. 2012. Annual cycle of hypoxia off the Changjiang (Yangtze River) Estuary. Marine Environmental Research, 77: 1-5.
DOI:10.1016/j.marenvres.2011.12.007 |
Wang B D. 2009. Hydromorphological mechanisms leading to hypoxia off the Changjiang estuary. Marine Environmental Research, 67(1): 53-58.
DOI:10.1016/j.marenvres.2008.11.001 |
Wang H J, Dai M H, Liu J W, Kao S J, Zhang C, Cai W J, Wang G Z, Qian W, Zhao M X, Sun Z Y. 2016. Eutrophication, Driven hypoxia in the East China Sea off the Changjiang Estuary. Environmental Science & Technology, 50(5): 2 255-2 263.
DOI:10.1021/acs.est.5b06211 |
Wei H, He Y C, Li Q J, Liu Z Y, Wang H T. 2007. Summer hypoxia adjacent to the Changjiang Estuary. Journal of Marine Systems, 67(3-4): 292-303.
DOI:10.1016/j.jmarsys.2006.04.014 |
Wong G T F, Chao S Y, Li Y H, Shiah F K. 2000. The Kuroshio edge exchange processes (KEEP) study-an introduction to hypotheses and highlights. Continental Shelf Research, 20(4-5): 335-347.
DOI:10.1016/S0278-4343(99)00075-8 |
Wu C R, Wang Y L, Lin Y F, Chao S Y. 2017. Intrusion of the Kuroshio into the South and East China Seas. Scientific Reports, 7(1): 7 895.
DOI:10.1038/s41598-017-08206-4 |
Xiu P, Chai F. 2011. Modeled biogeochemical responses to mesoscale eddies in the South China Sea. Journal of Geophysical Research, 116(C10): C10006.
DOI:10.1029/2010JC006800 |
Xiu P, Chai F. 2014. Connections between physical, optical and biogeochemical processes in the Pacific Ocean. Progress in Oceanography, 122: 30-53.
DOI:10.1016/j.pocean.2013.11.008 |
Xu L J, Yang D Z, Greenwood J, Feng X R, Gao G D, Qi J F, Cui X, Yin B S. 2020. Riverine and oceanic nutrients govern different algal bloom domain near the Changjiang estuary in summer. Journal of Geophysical Research. Biogeosciences, 125(10): e2020JG005727.
DOI:10.1029/2020jg005727 |
Yang D Z, Huang R X, Yin B S, Feng X R, Chen H Y, Qi J F, Xu L J, Shi Y L, Cui X, Gao G D, Benthuysen J A. 2018. Topographic beta spiral and onshore intrusion of the kuroshio current. Geophysical Research Letters, 45(1): 287-296.
DOI:10.1002/2017GL076614 |
Yang D Z, Yin B S, Liu Z L, Bai T, Qi J F, Chen H Y. 2012. Numerical study on the pattern and origins of Kuroshio branches in the bottom water of southern East China Sea in summer. Journal of Geophysical Research. Oceans, 117(C2): C02014.
DOI:10.1029/2011jc007528 |
Yang D Z, Yin B S, Liu Z L, Feng X R. 2011. Numerical study of the ocean circulation on the East China Sea shelf and a Kuroshio bottom branch northeast of Taiwan in summer. Journal of Geophysical Research: Oceans, 116(C5): C05015.
DOI:10.1029/2010jc006777 |
Zhang H M, Bates J J, Reynolds R W. 2006. Assessment of composite global sampling: sea surface wind speed. Geophysical Research Letters, 33(17): L17714.
DOI:10.1029/2006GL027086 |
Zhang H Y, Fennel K, Laurent A, Bian C. 2020. A numerical model study of the main factors contributing to hypoxia and its interannual and short-term variability in the East China Sea. Biogeosciences, 17(22): 5 745-5 761.
DOI:10.5194/bg-17-5745-2020 |
Zhang J, Gilbert D, Gooday A J, Levin L, Naqvi S W A, Middelburg J J, Scranton M, Ekau W, Peña A, Dewitte B, Oguz T, Monteiro P M S, Urban E, Rabalais N N, Ittekkot V, Kemp W M, Ulloa O, Elmgren R, Escobar-Briones E, Van der Plas A K. 2010. Natural and human-induced hypoxia and consequences for coastal areas: synthesis and future development. Biogeosciences, 7(5): 1 443-1 467.
DOI:10.5194/bg-7-1443-2010 |
Zhang J, Liu S M, Ren J L, Wu Y, Zhang G L. 2007. Nutrient gradients from the eutrophic Changjiang (Yangtze River) Estuary to the oligotrophic Kuroshio waters and re-evaluation of budgets for the East China Sea Shelf. Progress in Oceanography, 74(4): 449-478.
DOI:10.1016/j.pocean.2007.04.019 |
Zhang W X, Wu H, Hetland R D, Zhu Z Y. 2019a. On mechanisms controlling the seasonal hypoxia hot spots off the Changjiang River estuary. Journal of Geophysical Research Oceans, 124(12): 8 683-8 700.
DOI:10.1029/2019JC015322 |
Zhang W X, Wu H, Zhu Z Y. 2018. Transient hypoxia extent off changjiang river estuary due to mobile Changjiang River plume. Journal of Geophysical Research. Oceans, 123(12): 9 196-9 211.
DOI:10.1029/2018JC014596 |
Zhang W Y, Wirtz K, Daewel U, Wrede A, Kröncke I, Kuhn G, Neumann A, Meyer J, Ma M Y, Schrum C. 2019b. The budget of macrobenthic reworked organic carbon: a modeling case study of the North Sea. Journal of Geophysical Research: Biogeosciences, 124(6): 1 446-1 471.
DOI:10.1029/2019JG005109 |
Zhang W Y, Wirtz K. 2017. Mutual dependence between sedimentary organic carbon and infaunal macrobenthos resolved by mechanistic modeling. Journal of Geophysical Research. Biogeosciences, 122(10): 2 509-2 526.
DOI:10.1002/2017JG003909 |
Zhou F, Chai F, Huang D J, Wells M, Ma X, Meng Q C, Xue H J, Xuan J L, Wang P B, Ni X B, Zhao Q, Liu C G, Su J L, Li H L. 2020. Coupling and decoupling of high biomass phytoplankton production and hypoxia in a highly dynamic coastal system: the Changjiang (Yangtze River) estuary. Frontiers in Marine Science, 7: 259.
DOI:10.3389/fmars.2020.00259 |
Zhou F, Chai F, Huang D J, Xue H J, Chen J F, Xiu P, Xuan J L, Lia J, Zeng D Y, Ni X B, Wang K. 2017. Investigation of hypoxia off the Changjiang Estuary using a coupled model of ROMS-CoSiNE. Progress in Oceanography, 159: 237-254.
DOI:10.1016/j.pocean.2017.10.008 |
Zhou F, Xue H J, Huang D J, Xuan J L, Ni X B, Xiu P, Hao Q. 2015. Cross-shelf exchange in the shelf of the East China Sea. Journal of Geophysical Research. Oceans, 120(3): 1 545-1 572.
DOI:10.1002/2014JC010567 |
Zhou M J, Shen Z L, Yu R C. 2008. Responses of a coastal phytoplankton community to increased nutrient input from the Changjiang (Yangtze) River. Continental Shelf Research, 28(12): 1 483-1 489.
DOI:10.1016/j.csr.2007.02.009 |
Zhu Z Y, Wu H, Liu S M, Wu Y, Huang D J, Zhang J, Zhang G S. 2017. Hypoxia off the Changjiang (Yangtze River) estuary and in the adjacent East China Sea: quantitative approaches to estimating the tidal impact and nutrient regeneration. Marine Pollution Bulletin, 125(1-2): 103-114.
DOI:10.1016/j.marpolbul.2017.07.029 |
Zhu Z Y, Zhang J, Wu Y, Zhang Y Y, Lin J, Liu S M. 2011. Hypoxia off the Changjiang (Yangtze River) Estuary: oxygen depletion and organic matter decomposition. Marine Chemistry, 125(1-4): 108-116.
DOI:10.1016/j.marchem.2011.03.005 |
Zuo J L, Song J M, Yuan H M, Li X G, Li N, Duan L Q. 2019. Impact of Kuroshio on the dissolved oxygen in the East China Sea region. Journal of Oceanology and Limnology, 37(2): 513-524.
DOI:10.1007/s00343-019-7389-5 |