 2021, Vol. 39
Institute of Oceanology, Chinese Academy of Sciences
Article Information
- LIU Yuxin, LIN Mingsen, JIANG Xingwei, SUN Xiujun, SONG Xiangzhou
- A comparison of multiplatform wind products in the South China Sea during summer and autumn in 2019
- Journal of Oceanology and Limnology, 39(6): 2181-2194
- http://dx.doi.org/10.1007/s00343-020-0207-2
Article History
- Received May. 21, 2020
- accepted in principle Aug. 18, 2020
- accepted for publication Nov. 20, 2020


2 National Satellite Ocean Application Service, Beijing 100081, China;
3 Key Laboratory of Space Ocean Remote Sensing and Application, Ministry of Natural Resources, Beijing 100081, China;
4 Physical Oceanography Laboratory, Ocean University of China, Qingdao 266100, China;
5 College of Oceanography, Hohai University, Nanjing 210098, China
Sea surface winds (SSWs) are important for the study of marine dynamic environments. For example, the basin-scale Ekman pumping associated with the wind stress curl (Pedlosky, 1987; Huang, 2010) drives general ocean circulation. Furthermore, the Ekman current, spiral and transport, which are fundamental processes of upper ocean dynamics, correspond to local wind vectors (Ekman, 1905; Price et al., 1986). The ocean mixing generated by surface winds, especially strong tropical cyclones (TCs, Sriver and Huber, 2007), can enhance vertical heat transport and penetration, helping maintain the global energy cycle. In addition, winds also play a central role in determining air-sea turbulent heat fluxes, namely, latent and sensible heat fluxes (Yu and Weller, 2007; Yu, 2019), and help establish a new water vapor/temperature balance at the air-sea boundary layer in terms of wind turbulence, thereby affecting air-sea heat exchanges. The increase in wind speed over the past few decades has resulted in global increases in evaporation and latent heat flux (Yu and Weller, 2007). Moreover, the wind anomaly associated with atmospheric oscillations (Cayan, 1992; Thompson and Wallace, 2000a, b; Song and Yu, 2012) modifies the air-sea thermal contrast in terms of wind-induced ocean and atmospheric processes. Li and Carbone (2012) also pointed out the importance of the SSW generated by mesoscale sea surface temperature (SST) gradients, which may lead to the initiation of local convection in the Tropical Western Pacific and is further organized at the Madden-Julian Oscillation (MJO, Madden and Julian, 1971, 1972) scale (Carbone and Li, 2015). Above all, SSW is used for numerical modeling of the ocean and atmosphere for weather and wave forecasts, biophysical interactions, and climate studies (Zhang et al., 2006).
Conventional observation platforms mainly include ships and buoys. The SSWs obtained from conventional platforms are very limited, and the spatial and temporal distributions of the data are not uniform; hence, it is difficult for conventional SSW data to meet the needs of ongoing research. Since the 1970s, the development of satellite remote sensing has provided a more effective technique than conventional means for continuous global SSW observations. As an active microwave radar dedicated to monitoring SSWs at the global scale, the spaceborne microwave scatterometer can achieve relatively accurate retrievals of the SSW speed and direction over a swath of more than 1 000 km and a spatial resolution of 10 km. Accordingly, this instrument represents an important satellite sensor for observing SSWs. Reanalysis products, which are advantageously characterized by long time series and high temporal resolutions, are also an important source of SSW data. The products from the European Centre for Medium-Range Weather Forecasts (ECMWF) and the United States National Centers for Environmental Prediction (NCEP) are commonly used reanalysis data in ocean-atmosphere studies. In addition, the wave glider is a newly developed device for ocean observations within the past decade. With their remarkable endurance and survivability, wave gliders have become increasingly popular for research, and related products have been widely used in marine science and engineering (Hine et al., 2009; Manley and Willcox, 2010; Daniel et al., 2011; Bingham et al., 2012).
However, calibration is essential to the production and application of SSW products. Comparing and analyzing the errors of SSWs through calibration can help us select a more appropriate SSW dataset and enhance our confidence in its application. A large number of studies have been conducted to evaluate the SSW data quality by comparing these SSW data with in-situ observations. Previous studies on the quality of scatterometer data have considered the Seasat-A Satellite Scatterometer (SASS, Jones et al., 1982), European Remote Sensing Satellite (ERS) Active Microwave Instrument (AMI, Bentamy et al., 1994), Advanced Earth Observing Satellite (ADEOS) NASA Scatterometer (NSCAT, Bourassa et al., 1997; Ebuchi, 1999; Dickinson et al., 2001), Quick Scatterometer (QSCAT) SeaWinds instrument (Ebuchi et al., 2002; Chelton and Freilich, 2005), Meteorological Operational Satellite Programme (MetOp) Advanced Scatterometer (ASCAT, Verspeek et al., 2010) and HY-2A Scatterometer (SCAT, Li and Shen, 2015; Zhao and Zhao, 2019). Similarly, to evaluate the quality of SSW reanalysis data, the NCEP National Center for Atmospheric Research (NCAR, Ladd and Bond, 2002), NCEP Climate Forecast System Reanalysis (CFSR, Peng et al., 2013), Modern-Era Retrospective Analysis for Research and Applications, Version 2 (MERRA2, Kim et al., 2018), ERA40 (Höglund et al., 2009), and ERA-Interim (Song et al., 2015) datasets have been considered benchmarks for climate analysis.
Most of the abovementioned studies evaluated satellite scatterometers launched many years ago and employed the previous generation of reanalysis data. In contrast, the data from newly developed SSWs such as wave glider observations, data from the Chinese-French Oceanography Satellite (CFOSAT), and the fifth ECMWF reanalysis (ERA5) dataset have not been fully examined. Especially in the South China Sea (SCS), the applicability of these new data is not yet fully understood. Accordingly, the errors of HY-2A, CFOSAT, ERA5 and wave glider SSW data are analyzed and evaluated with respect to the buoy in this paper, and a reasonable reference and basis are provided for the selection of SSW datasets in the SCS. The remainder of this paper is organized as follows.
In Section 2, the datasets, namely, the wave glider observations, HY-2A measurements, CFOSAT measurements, and ERA5 reanalysis, and the data processing method are briefly introduced, and buoy observations are used to calibrate the SSW estimates from different platforms. Then, errors in the multiplatform observations and a detailed analysis and discussion based on the applicability of SSW data are presented in Sections 3 & 4. Finally, the conclusions and suggestions for future research are given in Section 5.
2 DATA AND METHOD 2.1 DataFive types of SSW data are used in this article: buoy observations, "Black Pearl" medium-size wave glider observations, HY-2A measurements, CFOSAT measurements, and ERA5 reanalysis data. In general, the in-situ data provided by the World Meteorological Organization Information System (WMO WIS) are assimilated to ERA5 to improve the predictive ability in numerical weather predictions. Satellite scatterometer data are also assimilated into ERA5, including AMI, ASCAT, Oceansat-2 scatterometer (OSCAT), and SeaWinds. However, the near-coast buoy observations and satellite achievement used in this study have not been assimilated to ERA5. Thus, HY-2A, CFOSAT, buoy, and ERA5 can be regarded as independent resources for comparison. It is expected that newly achieved data products can be assimilated into reanalysis systems to improve the ability to predict ocean and climate states in the future. The ERA5 reanalysis has assimilated more proven wind products such as ASCAT. In this study, the wind in ERA5 will be compared with buoy observations, instead of the ASCAT wind. The detailed information of the four SSW datasets to be evaluated is shown in Table 1.
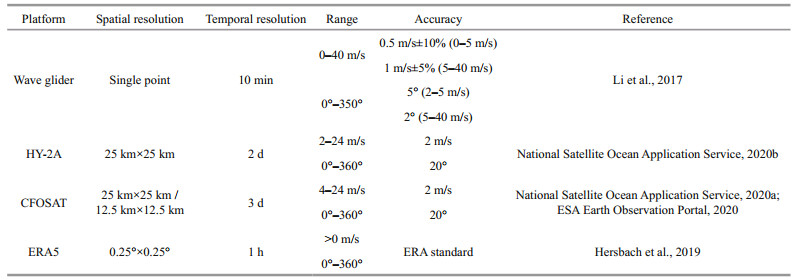
The "Black Pearl" medium-size wave glider used in this study was an ocean mobile observation platform with autonomous navigation capability, and it was developed by Ocean University of China and Tianjin Polytechnic University, China. It has many advantages. Its kinetic energy was generated from waves. The energy used for measurement, control, navigation, and communication systems was generated in solar technology. The observations could be conducted in a long period and long distance. It was very tolerant to extreme sea conditions. Observation jobs could be completed by various sensing equipment, such as sonar, weather stations, underwater cameras, conductivity, temperature, and depth (CTD) sensors, hydrophones, and biological or chemical detection instruments. Measurements of air-sea interface environment could be performed on large spatial scales via an iridium communication system, a global positioning system, and an autonomous navigation control system (Sun et al., 2019). In addition, a micro weather station for the "Black Pearl" called AirMar 200WX-IPX7 was used, and the data were transmitted by the iridium communication system. The wind speed accuracy of the sensor was 0.5 m/s±10% (0–5 m/s) or 1 m/s ±5% (5–40 m/s) in resolution of 0.1 m/s, and the wind direction accuracy was 5° (2–5 m/s) or 2° (5–40 m/s) in resolution of 0.1° (Li et al., 2017). The observations from the wave glider temporally ranged from June 15 to August 30, 2019, and the trajectory of the wave glider is shown in Fig. 1 as the solid black line.

|
| Fig.1 The trajectory (black line) of the wave glider from June 15 to August 30, 2019, and the location of buoy SF304 (purple square) affiliated with the Ministry of Natural Resources (MNR) in the SCS The colored background is the mean wind speed field (unit: m/s) based on the ERA5 reanalysis from June to November 2019. |
The HY-2A satellite was successfully launched in China on August 16, 2011, and is equipped with a radar altimeter, a microwave scatterometer, a scanning microwave radiometer, and a calibrated microwave radiometer. In particular, the microwave scatterometer has a swath width exceeding 1 700 km, a spatial resolution of 25 km×25 km, a wind speed measurement range of 2-24 m/s, a wind speed measurement accuracy of 2 m/s, and a wind direction measurement accuracy of 20° (Jiang et al., 2012). Since the experimental period of the wave glider spanned from June 15 to August 30, 2019, the HY-2A data within the period from June 15 to November 31, 2019, were used to match the observation period and guarantee a sufficient number of matching samples. HY-2A data were obtained from National Satellite Ocean Application Service (NSOAS, https://osdds.nsoas.org.cn/#/?lang=en).
2.1.3 CFOSATCFOSAT was jointly developed by China and France and was successfully launched on October 29, 2018. The satellite is equipped with two payloads: the Surface Waves Investigation and Monitoring (SWIM) instrument and SCAT. SCAT is the first rotating fan-beam scatterometer for the acquisition of global ocean vector wind observations, and SWIM is the first space radar dedicated to measuring the directional spectrum of ocean waves through a method involving real-aperture radar with six incidents. The combination of the SCAT sensor with rotating fan beams and the SWIM instrument with multi-incident beams is of great value for investigating the processes of marine dynamic environments and surface scattering characteristics. SCAT has a swath width exceeding 1 000 km, and it takes approximately 3 d to cover the globe (Earth Observation Portal, 2020, https://directory.eoportal.org). There are two CFOSAT SSW products with spatial resolutions of 25 km×25 km and 12.5 km×12.5 km, and the latter high-resolution dataset is selected in this paper. In addition, the wind speed measurement range is 4-24 m/s, the wind speed measurement accuracy is 2 m/s, and the wind direction measurement accuracy is 20° (National Satellite Ocean Application Service, 2020a). The CFOSAT data employed herein range from June 15 to November 31, 2019. CFOSAT data were obtained from NSOAS (https://osdds.nsoas.org.cn/#/?lang=en).
2.1.4 ERA5ERA5 was released in 2016 and is the fifthgeneration reanalysis of global climate and atmospheric data provided by the ECMWF. Compared with the previous versions of the reanalysis product, ERA5 provides a higher spatial resolution, hourly estimates of atmospheric variables, and a consistent representation of uncertainty. Moreover, ERA5 uses more satellite observations compared to earlier products. Transitioning from ERA-Interim to ERA5 represents an improvement in the overall quality and level of detail (Hersbach et al., 2019). The 10-m SSW of ERA5 is selected for this study. The spatial resolution is 0.25°×0.25°, and the temporal resolution is 1 h. Consistent with the observation periods of the wave glider and scatterometer data, the ERA5 data range from June 15 to November 31, 2019.
2.1.5 BuoyBecause HY-2A, CFOSAT, and ERA5 all provide global wind field data, a buoy that can match the trajectory of the wave glider must be selected. Hence, a 6-m medium-sized ocean data buoy, buoy SF304 that was deployed by the Ministry of Natural Resources in the SCS, was selected for this research. Buoy SF304 mainly carried out observations of the wind speed, wind direction, air temperature, air pressure, humidity, precipitation, wave height, wave period, wave direction, sea surface temperature, and ocean current, among other variables. The location of the buoy was 115.46°E/19.85°N as shown as a purple square in Fig. 1. The buoy's anemometer was an R. M. Young wind speed and wind direction sensor. The observed wind speed was in hours, and the measurement range was 0–100 m/s. The wind speed accuracy was ±0.3 m/s, and the wind direction accuracy was ±3°. The observational height of the anemometer was 7.4 m.
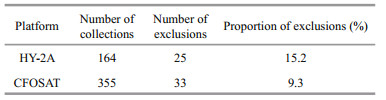
2.2 Processing method 2.2.1 Data processingFirst, the quality of the data needs to be controlled. According to the wind speed observation range of each SSW product, records outside the observation range and the wind vector cell (WVC) marked by rainfall in the scatterometer observations were excluded. The sigma values used in each WVC for the retrieval were ensured to be sufficiently high quality. Furthermore, the wind speed and wind direction observations from the buoy and wave glider were checked manually to ensure the credibility and rationality of the data. In addition, when the difference of wind directions between the scatterometer and buoy was more than 45°, the scatterometer estimate was rejected as having poor WVC ambiguity selection (Plagge et al., 2012). Due to the poor representativeness of low wind speeds and the quality control process of scatterometer, a slightly higher proportion of samples were not used for calibration. The excluded numbers of observations are shown in Table 2.
The wind directions determined by HY-2A and CFOSAT are defined as 0° due north and increasing clockwise, whereas those observed by the buoy, wave glider, and ERA5 are expressed according to the meteorological convention, that is, defined as 0° due south and increasing clockwise. Therefore, there is a 180° difference between the wind directions of HY-2A and CFOSAT and those of the other platforms. To unify the wind directions among the various datasets, the definition of the wind direction according to the meteorological convention was used in this study.
The buoy and wave glider measured the actual wind speed at heights of 7.4 m and 1.5 m above the sea surface, respectively. For HY-2A, CFOSAT, and ERA5, the reference height of the wind vector was 10 m above the sea surface. Thus, the SSW data were converted to 10-m neutral winds using the Liu-Katsaros-Businger (LKB) model (Liu et al., 1979; Fairall et al., 2003).
The temporal resolution of the buoy was 1 h, and the spatial resolution of the CFOSAT data was 12.5 km; thus, the spatial and temporal windows for matching these data were selected as 12.5 km and 30 min, and the same windows were used for the HY-2A and ERA5 data. In contrast, the temporal resolution of the wave glider was 10 min. Therefore, a time window of 5 min was employed to match the wave glider data with the buoy data. Moreover, since there was only one buoy site (SF304) along the trajectory of the wave glider, the spatial window was increased to 100 km to prevent an excessively short observation duration of the collected samples.
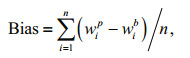
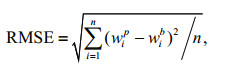
2.2.2 Statistical metricsTo quantitatively evaluate the accuracies of the different multiplatform products, several statistical metrics were applied to the collected samples. The Bias (Eq.1) and root mean square error (RMSE, Eq.2) were used to evaluate the uncertainty in the wind products, whereas the Pearson correlation coefficient (R, Eq.3) was used to analyze the correlations between the wave glider, HY-2A, CFOSAT, and ERA5 data and the buoy values:
 (1)
(1) (2)
(2)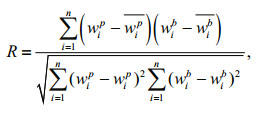 (3)
(3)where n is the number of collected samples, wib is the wind speed/direction observed by the buoy, and wip represents the wave glider, HY-2A, CFOSAT, and ERA5 wind speed/direction.
For the periodicity of the wind direction, the wind direction difference between wib and wip can be expressed as d (Eq.4):
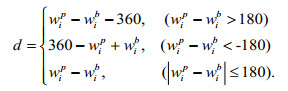 (4)
(4)Figure 2 shows scatterplots of the HY-2A, CFOSAT, wave glider, and ERA5 wind speeds with the corresponding buoy observations. The solid line at slope of 1 in each plot indicates that the wind speeds of the two platforms are equal to each other. Evidently, the HY-2A, CFOSAT, wave glider, and ERA5 wind speeds are all below 20 m/s. According to the wind speed error statistics, the wind speed biases of the HY-2A, CFOSAT, wave glider, and ERA5 datasets are -0.4, 0.5, -1.3, and -0.4 m/s, respectively, while the corresponding RMSEs are 1.6, 1.6, 2.9, and 1.9 m/s, and the correlation coefficients with the buoy observations are 0.86, 0.85, 0.63, and 0.84, respectively. In general, the RMSEs of the wind speed observed by HY-2A and CFOSAT are less than 2 m/s, and their observation accuracies reach the satellite design indexes. Moreover, the quality of the wind speed data from ERA5 is equivalent to the data quality from the two satellites, and the wind speed evaluation results of all three are similar. In contrast, the wind speed error of the wave glider is large, and the wind speed is lower than that of the buoy.

|
| Fig.2 Scatterplots of the wind speeds in the HY-2A, CFOSAT, wave glider, and ERA5 datasets and the corresponding observations from buoy SF304 The black line represents the bisector line, and the red line represents the regression line. |
Similarly, Fig. 3 depicts scatterplots of the HY-2A, CFOSAT, wave glider, and ERA5 wind directions with the corresponding buoy observations. Clearly, the wind directions observed by HY-2A, CFOSAT, and ERA5 are distributed mainly in the directions of 45° (southwesterly) and 225° (northeasterly). According to the statistical results of the wind direction errors, the HY-2A, CFOSAT, wave glider, and ERA5 wind direction biases were -1.4°, -1.9°, 15.5°, and -0.16°, respectively, while the corresponding RMSEs were 18.9°, 17.3°, 50.1°, and 33.4°, and the correlation coefficients with the buoy observations were 0.98, 0.98, 0.76, and 0.93, respectively. In general, the RMSEs of the HY-2A and CFOSAT wind directions were both less than 20° and their observation accuracies satisfied the satellite design requirements. However, since ERA5 samples with a large direction deviation relative to the buoy observations were not filter out, the RMSE of the ERA5 wind direction was relatively large. There was also a significant deviation in the wind direction observed by the wave glider.

|
| Fig.3 Scatterplots of the HY-2A, CFOSAT, wave glider, and ERA5 wind directions and the corresponding observations from buoy SF304 The black line represents the bisector line, and the red line represents the regression line. |
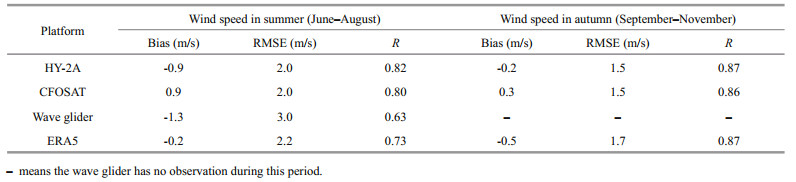
The wave glider observations were conducted mainly during the boreal summer, while the other observations lasted from June to November, covering the summer and autumn. Thus, the results were compared for summer and autumn (Tables 3 & 4) between which the air-sea boundary conditions can be different. Based on this clarification, it was found that the HY-2A, CFOSAT, and ERA5 show poorer quality in the summer and better quality in the autumn. According to the above analysis of different seasons, the observation time of the wave glider is in the summer, which may be one of the reasons for the poor quality.

The SCS lies in the tropical and subtropical regions off the southern part of the Asian continent. Compared with other sea areas, it is characterized by a significant tropical marine climate with short spring and autumn seasons, long summers, and prevailing southwest-northeast winds. The SCS is typically affected by the Asian southwest monsoon from June to August (with the autumn transition period in September) and the northeast monsoon period from October to March. According to the wind direction rose charts depicted in Fig. 4, except for the wave glider, the wind direction distributions of HY-2A, CFOSAT, and ERA5 are similar to that of the buoy observations.

|
| Fig.4 Wind roses of the following pairs of sensors: collected buoy SF304 and HY-2A, collected buoy SF304 and CFOSAT, collected buoy SF304 and wave glider, and collected buoy SF304 and ERA5 |
The reason for this discrepancy between the wave glider and buoy observations is that buoy SF304 was the only buoy deployed along the wave glider trajectory, and only 14 d (July 22 to August 4) of wave glider observations within 100 km of the buoy can be matched with the buoy observations. Therefore, the wave glider wind directions cannot represent the actual wind direction distribution during this period. Figure 4 shows that the wind speeds during the southwest monsoon are relatively weak (generally lower than 10 m/s), while those during the northeast monsoon have a higher intensity, and the wind direction is relatively stable. The abovementioned results may be caused by cold winter waves in the northern part of the SCS accompanied by high wind speeds. Moreover, the wind direction in summer is not as stable as that in winter due to the frequent occurrence of TCs.
3.2 Generalized analysisTo fully reflect the evaluation results of the multiplatform SSWs and clarify the results, three statistical metrics, namely, the standard deviation (SD), RMSE, and R were selected and plotted on standardized Taylor diagrams (Figs. 5 & 6) for comparison with the buoy observations. The radial distance from the dot (buoy) represents the ratio of the SD of the SSW data to that of the buoy observations, where the SD of the data relative to the SD of the buoy observations represents the ability to simulate the center amplitude of the SSW data. The closer the SD ratio is to 1, the better is the simulation ability. The RMSE is the difference in magnitude between the buoy observation and the SSW data and is represented in the diagrams as a dotted green semiarc with the buoy point at the center of the circle. The closer the SSW data point is to the buoy, the closer are the values. R was determined by the azimuth of the SSW data. When the SSW data are consistent with the buoy observations, the closer is the SSW point to the buoy on the x-axis and the higher is the correlation between the SSW data and the buoy observation at that time, bearing the problem of the degrees of freedom.

|
| Fig.5 Taylor diagram of the wind speed based on the HY-2A, CFOSAT, wave glider, ERA5, and buoy SF304 observations |

|
| Fig.6 Taylor diagram of the wind direction based on the HY-2A, CFOSAT, wave glider, ERA5, and buoy SF304 observations |
According to the above evaluation principles, the quality evaluations of the multiplatform SSW data are consistent with the results of the scatterplot analyses. Specifically, in terms of the wind speed, HY-2A is slightly better than ERA5, ERA5 is slightly better than CFOSAT. Although there is little difference among the three, wave glider's results are worse than those of other platforms. It should be pointed out that after 6 years of extended service, HY-2A has a larger proportion of excluded data in the quality control stage (Table 2), and the 12.5-km product of CFOSAT has a lower quality compared to the 25-km product (Lin et al., 2019); thus, the evaluation results may fluctuate within a relatively short period. In terms of the wind direction, CFOSAT is slightly better than HY-2A, HY-2A is slightly better than ERA5, and both are better than wave glider. The causes of the wave glider's relatively poor performance will be examined in the next section.
3.3 Analysis of the wave glider resultsAs mentioned above, the quality assessment of the wave glider observations was unsatisfactory. The reasons for this outcome were analyzed. According to the observation of the wave glider, the virtual anchorage phase of the wave glider lasted from June 15 to July 17, 2019, and the navigation observation phase of the wave glider spanned from July 17 to August 30, 2019. Due to poor continuity of observations from the wave glider between June 15 and June 30, 2019, the period from July 1 to August 30, 2019, was selected for analysis, and the trajectory of the wave glider during this interval is shown in Fig. 7. In Fig. 7, the arrows represent the daily wind velocity (red arrows represent the wave glider, green arrows represent HY-2A, cyan arrows represent CFOSAT, and dark blue arrows represent ERA5). During this period, the starting point is located in the dense trajectory area (approximately 117°E). After sailing west to 115.5°E, the ship sailed east and turned northwest at approximately 119°E. It is obvious from Fig. 7 that the quality of wave glider observations is poor and the wind speed is lower than those of the observations from other platforms during this period, which supports the above evaluation results. Furthermore, after heading east to 117.5°E, wind direction of the wave glider was relatively consistent with those determined by the other three platforms. However, due to the unavailability of suitable buoys and other in-situ observations for calibration, these glider-determined wind directions cannot be reflected in the results.

|
| Fig.7 Daily mean SSW based on the HY-2A, CFOSAT, wave glider and ERA5 data from July to August 2019 |
The above experiments demonstrate that there are few differences in the accuracy evaluations among HY-2A, CFOSAT, and ERA5 in the SCS. A more appropriate SSW dataset should be selected according to the requirements, such as the temporal resolution and spatial resolution. Among the above datasets, the time interval of the ERA5 data is 1 h, which is suitable for research and applications requiring a high temporal resolution. The entire ERA5 dataset from 1950 to the present is expected to be available for use in 2020. The low antenna rotation speed on CFOSAT helps to ensure high redundancy for the back-scattering coefficient in azimuth data, which can further improve the spatial resolution of the measured unit to 12.5 km by employing the resolution enhancement technique (Wang et al., 2019); therefore, CFOSAT is more suitable for research and applications that demand relatively small-scale information. Additionally, compared with HY-2A, CFOSAT is more suitable for near-shore SSW measurements. However, since buoy SF304 is far from the coast, the advantage of CFOSAT for near-shore measurements was not reflected in the results. Of course, the combination of observations from CFOSAT, HY-2A/B, ASCAT-A/B/C, and other scatterometers would greatly improve the observation frequency and help meet the demands for a better temporal resolution. At this stage, the quality of wave glider data is not stable enough because the comparison is constructed between a moving platform and a fixed buoy location. However, the platform of wave glider has numerous advantages, including excellent maneuverability, a long operating duration, and a controllable flight path. In addition, wave gliders can track and observe phenomena under extreme sea conditions such as TCs.
5 CONCLUSIONSSW data from HY-2A, CFOSAT, ERA5 and a wave glider were evaluated and analyzed in reference to a buoy in the SCS during summer and autumn in 2019. The main conclusions are as follows. After quality control, the wind speed RMSEs of the HY-2A and CFOSAT scatterometer data are less than 2 m/s, and the wind direction RMSE is less than 20°, which meet the requirements of satellite missions. According to a wind speed evaluation, HY-2A is slightly better than ERA5 and CFOSAT, and CFOSAT shows different qualities for unknown reasons, which will be further diagnosed. According to a wind direction evaluation, CFOSAT is slightly better than HY-2A, and HY-2A is better than ERA5. HY-2A, CFOSAT, and ERA5 all have similar performances in the SSW data evaluation, and the wind speeds and directions have similar statistical results, which are consistent with the seasonal characteristics of the SCS. Buoys are generally regarded as one of the most reliable observation platforms, although they are limited in the number and distribution of stations. ERA5 provides hourly SSW data over long time series, which can meet the increasing demands of ongoing climate research. However, it lacks the ability to analyze small-scale phenomena. Scatterometers have a higher spatial resolution and have advantages in large-scale ocean phenomena observations, but because the diurnal variation information cannot be captured effectively by a single satellite, network observations with multiple scatterometers will compensate for the inadequate temporal resolution, thereby enabling more practical needs to be satisfied. Wave gliders can track ocean phenomena at long temporal and spatial scales; however, as a new type of observation device, the high-frequency SSW observations of wave gliders are less accurate compared to the buoy measurements. Gliders need to be used with strict quality control at present, but these devices will no doubt have great application prospects in the future.
In summary, calibration is an important and key step in promoting the application of marine data. This study can be regarded as the first step in performing wind data comparisons in China's marginal seas. Through the validation in this paper, the spatial and temporal distribution and accuracy of the SSW characteristics and the generality of the SSW observations from a multiplatform in the SCS were evaluated within a limited time of about 6 months. However, in future studies, long-term comparisons of SSW and calibration of the satellite data in this region will be further conducted with the accumulation of satellite achievement and in-situ observations. Due to the limited availability and effectiveness of in-situ observations, such as those provided by buoys, the evaluation results are inevitably affected by representative errors in the data. There are inevitable systematic observational uncertainties because of the sensor accuracies on buoys; therefore, the quality of the buoy data has a great influence on the validation results. In addition, the difficulty of matching the wave glider observations with the buoy observations indicates that more attention should be paid to the quality control and manual verification processes using the limited collected data. At a scale of 10 km, serious errors may occur in the reanalysis data. In this case, the buoy and satellite observation data can be used as a reference for the validation, as a supplement to the reanalysis data, and as a method for correcting errors in the reanalysis data.
Chinese scientists have made great efforts towards wave glider advancements so that this technology can be used in marginal seas (e.g., SCS, Sun et al., 2019). In this paper, the comparisons demonstrate that the observed SSW quality based on the wave glider information is sufficient relative to the buoy observations, although the observation positions change over time. This study found that wave glider-based observations require additional improvements. In the future, wave gliders will be designed with more accurate sensors that can coordinate with the attitudes of the moving trajectory. An improved accuracy of air-sea variables can be obtained with more accurate sensors and equipment that present reliable stability and long survivability. For a better understanding of the observational uncertainties of wave gliders, a comprehensive comparison project that includes a combination of the satellite retrievals, buoy observations, and atmospheric and oceanic reanalysis data will be promoted. In the next step, the air-sea variables in cooperative multiple wave gliders will be compared with those based on the Bailong buoy (Freitag et al., 2016), which is already planned and under construction. It is expected that the wave glider air-sea observations will provide a stable and comprehensive data source for marine studies and for forecasting and prediction.
6 DATA AVAILABILITY STATEMENTThe datasets generated and/or analyzed during the current study are available from the corresponding author on reasonable request.
7 ACKNOWLEDGMENTThe authors would like to thank National Satellite Ocean Application Service (NSOAS) for HY-2A and CFOSAT scatterometer data, the National Marine Environmental Forecasting Center (NMEFC) for buoy data, and the European Centre for Medium-Range Weather Forecasts (ECMWF) for ERA5 reanalysis data.
Bentamy A, Quilfen Y, Queffeulou P, Cavanie A. 1994. Calibration of the ERS-1 scatterometer C-band model. Ifremer Tech. Rep. DRO/OS 94.0.1.
|
Bingham B, Kraus N, Howe B, Freitag L, Ball K, Koski P, Gallimore E. 2012. Passive and active acoustics using an autonomous wave glider. Journal of Field Robotics, 29(6): 911-923.
DOI:10.1002/rob.21424 |
Bourassa M A, Freilich M H, Legler D M, Liu W T, O'Brien J J. 1997. Wind observations from new satellite and research vessels agree. Eos, Transactions American Geophysical Union, 78(51): 597-602.
DOI:10.1029/97EO00357 |
Carbone R E, Li Y P. 2015. Tropical oceanic rainfall and sea surface temperature structure: parsing causation from correlation in the MJO. Journal of the Atmospheric Sciences, 72(7): 2703-2718.
DOI:10.1175/JAS-D-14-0226.1 |
Cayan D R. 1992. Latent and sensible heat flux anomalies over the northern oceans: driving the sea surface temperature. Journal of Physical Oceanography, 22(8): 859-881.
DOI:10.1175/1520-0485(1992)022<0859:LASHFA>2.0.CO;2 |
Chelton D B, Freilich M H. 2005. Scatterometer-based assessment of 10-m wind analyses from the operational ECMWF and NCEP numerical weather prediction models. Monthly Weather Review, 133(2): 409-429.
DOI:10.1175/MWR-2861.1 |
Daniel T, Manley J, Trenaman N. 2011. The Wave Glider: enabling a new approach to persistent ocean observation and research. Ocean Dynamics, 61(10): 1509-1520.
DOI:10.1007/s10236-011-0408-5 |
Dickinson S, Kelly K A, Caruso M J, McPhaden M J. 2001. Comparisons between the TAO buoy and NASA scatterometer wind vectors. Journal of Atmospheric and Oceanic Technology, 18(5): 799-806.
DOI:10.1175/1520-0426(2001)018<0799:CBTTBA>2.0.CO;2 |
Ebuchi N, Graber H C, Caruso M J. 2002. Evaluation of wind vectors observed by QuikSCAT/SeaWinds using ocean buoy data. Journal of Atmospheric and Oceanic Technology, 19(12): 2049-2062.
DOI:10.1175/1520-0426(2002)019<2049:EOWVOB>2.0.CO;2 |
Ebuchi N. 1999. Statistical distribution of wind speeds and directions globally observed by NSCAT. Journal of Geophysical Research: Oceans, 104(C5): 11393-11403.
DOI:10.1029/98JC02061 |
Ekman V W. 1905. On the influence of the Earth's rotation on ocean-currents. Arkiv för Matematik, Astronomi Och Fysik, 2(11): 1-52.
|
ESA Earth Observation Portal. 2020. CFOSAT (Chinese-French Oceanography Satellite). https://directory.eoportal.org/web/eoportal/satellite-missions/c-missions/cfosat. Accessed on 2020-05-10.
|
Fairall C W, Bradley E F, Hare J E, Grachev A A, Edson J B. 2003. Bulk parameterization of air-sea fluxes: updates and verification for the COARE algorithm. Journal of Climate, 16(4): 571-591.
DOI:10.1175/1520-0442(2003)016<0571:BPOASF>2.0.CO;2 |
Freitag H P, Ning C, Berk P L, Dougherty D M, Marshall R F, Strick J M, Zimmerman D K. 2016. ATLAS, T-Flex, Bailong Meteorological Sensor Comparison Test Report. NOAA Tech. Memo. OAR PMEL-148, NOAA/Pacific Marine Environmental Laboratory, Seattle WA. 40p.
|
Hersbach H, Bell B, Berrisford P, Horányi A, Sabater J M, Nicolas J, Radu R, Schepers D, Simmons A, Soci C, Dee D. 2019. Global Reanalysis: Goodbye ERA-Interim, Hello ERA5. ECMWF, UK, 159. p. 17-24.
|
Hine R, Willcox S, Hine G, Richardson T. 2009. The wave glider: a wave-powered autonomous marine vehicle. In: Proceedings of Oceans 2009. IEEE, Biloxi. p. 1-6.
|
Höglund A, Meier H E M, Broman B, Kriezi E. 2009. Validation and Correction of Regionalised ERA-40 Wind Fields Over the Baltic Sea Using the Rossby Centre Atmosphere Model RCA3.0. Rapport Oceanografi No 97, Swedish Meteorological and Hydrological Institute, Norrköping, Sweden. 29p.
|
Huang R X. 2010. Ocean Circulation: Wind-Driven and Thermohaline Processes. Cambridge University Press, Cambridge. 828p.
|
Jiang X W, Lin M S, Liu J Q, Zhang Y G, Xie X T, Peng H L, Zhou W. 2012. The HY-2 satellite and its preliminary assessment. International Journal of Digital Earth, 5(3): 266-281.
DOI:10.1080/17538947.2012.658685 |
Jones W I, Schroeder L C, Boggs D H, Bracalente E M, Brown R A, Dome G J, Pierson W J, Wentz F J. 1982. The SEASAT—a satellite scatterometer: the geophysical evaluation of remotely sensed wind vectors over the ocean. Journal of Geophysical Research: Oceans, 87(C5): 3297-3317.
DOI:10.1029/JC087iC05p03297 |
Kim H G, Kim J Y, Kang Y H. 2018. Comparative evaluation of the third-generation reanalysis data for wind resource assessment of the southwestern offshore in South Korea. Atmosphere, 9(2): 73.
DOI:10.3390/atmos9020073 |
Ladd C, Bond N A. 2002. Evaluation of the NCEP/NCAR reanalysis in the NE Pacific and the Bering Sea. Journal of Geophysical Research: Oceans, 107(C10): 3158.
DOI:10.1029/2001JC001157 |
Li C, Sang H Q, Sun X J, Qi Z H. 2017. Hydrographic and meteorological observation demonstration with wave glider "Black Pearl". In: Proceedings of the 10th International Conference on Intelligent Robotics and Applications. Springer, Wuhan. p. 790-800, https://doi.org/10.1007/978-3-319-65289-4_73.
|
Li D W, Shen H. 2015. Evaluation of wind vectors observed by HY-2A scatterometer using ocean buoy observations, ASCAT measurements, and numerical model data. Chinese Journal of Oceanology and Limnology, 33(5): 1191-1200.
DOI:10.1007/s00343-015-4136-4 |
Li Y P, Carbone R E. 2012. Excitation of rainfall over the tropical western Pacific. Journal of the Atmospheric Sciences, 69(10): 2983-2994.
DOI:10.1175/JAS-D-11-0245.1 |
Lin W M, Dong X L, Portabella M, Lang S Y, He Y J, Yun R S, Wang Z X, Xu X G, Zhu D, Liu J Q. 2019. A perspective on the performance of the CFOSAT rotating fan-beam scatterometer. IEEE Transactions on Geoscience and Remote Sensing, 57(2): 627-639.
DOI:10.1109/TGRS.2018.2858852 |
Liu W T, Katsaros K B, Businger J A. 1979. Bulk parameterization of air-sea exchanges of heat and water vapor including the molecular constraints at the interface. Journal of the Atmospheric Sciences, 36(9): 1722-1735.
DOI:10.1175/1520-0469(1979)036<1722:BPOASE>2.0.CO;2 |
Madden R A, Julian P R. 1971. Detection of a 40-50 day oscillation in the zonal wind in the tropical Pacific. Journal of the Atmospheric Sciences, 28(5): 702-708.
DOI:10.1175/1520-0469(1971)028<0702:DOADOI>2.0.CO;2 |
Madden R A, Julian P R. 1972. Description of global-scale circulation cells in the tropics with a 40-50 day period. Journal of the Atmospheric Sciences, 29(6): 1109-1123.
DOI:10.1175/1520-0469(1972)029<1109:DOGSCC>2.0.CO;2 |
Manley J, Willcox S. 2010. The Wave Glider: a persistent platform for ocean science. In: Proceedings of OCEANS'10 IEEE SYDNEY. IEEE, Sydney. p. 1-5, https://doi.org/10.1109/OCEANSSYD.2010.5603614.
|
National Satellite Ocean Application Service. 2020a. CFOSAT. http://www.nsoas.org.cn/eng/item/207.html. Accessed on 2020-05-10.
|
National Satellite Ocean Application Service. 2020b. HY-2A. http://www.nsoas.org.cn/eng/item/205.html. Accessed on 2020-05-10.
|
Pedlosky J. 1987. Geophysical Fluid Dynamics. 2nd edn. Springer Verlag, New York. 710p.
|
Peng G, Zhang H M, Frank H P, Bidlot J R, Higaki M, Stevens S, Hankins W R. 2013. Evaluation of various surface wind products with oceanSITES buoy measurements. Weather and Forecasting, 28(6): 1281-1303.
DOI:10.1175/WAF-D-12-00086.1 |
Plagge A M, Vandemark D, Chapron B. 2012. Examining the impact of surface currents on satellite scatterometer and altimeter ocean winds. Journal of Atmospheric and Oceanic Technology, 29(12): 1776-1793.
DOI:10.1175/JTECH-D-12-00017.1 |
Price J F, Weller R A, Pinkel R. 1986. Diurnal cycling: observations and models of the upper ocean response to diurnal heating, cooling, and wind mixing. Journal of Geophysical Research: Oceans, 91(C7): 8411-8427.
DOI:10.1029/JC091iC07p08411 |
Song L N, Liu Z L, Wang F. 2015. Comparison of wind data from ERA-interim and buoys in the Yellow and East China Seas. Chinese Journal of Oceanology and Limnology, 33(1): 282-288.
DOI:10.1007/s00343-015-3326-4 |
Song X Z, Yu L S. 2012. High-latitude contribution to global variability of air-sea sensible heat flux. Journal of Climate, 25(10): 3515-3531.
DOI:10.1175/JCLI-D-11-00028.1 |
Sriver R L, Huber M. 2007. Observational evidence for an ocean heat pump induced by tropical cyclones. Nature, 447(7144): 577-580.
DOI:10.1038/nature05785 |
Sun X J, Wang L, Sang H Q. 2019. Application of wave glider "Black Pearl" to typhoon observation in South China Sea. Journal of Unmanned Undersea Systems, 27(5): 562-569.
(in Chinese with English abstract) DOI:10.11993/j.issn.2096-3920.2019.05.012 |
Thompson D W J, Wallace J M. 2000a. Annular modes in the extratropical circulation. Part Ⅰ: month-to-month variability. Journal of Climate, 13(5): 1000-1016.
DOI:10.1175/1520-0442(2000)013<1000:AMITEC>2.0.CO;2 |
Thompson D W J, Wallace J M. 2000b. Annular modes in the extratropical circulation. Part Ⅱ: trends. Journal of Climate, 13(5): 1018-1036.
DOI:10.1175/1520-0442(2000)013<1018:AMITEC>2.0.CO;2 |
Verspeek J, Stoffelen A, Portabella M, Bonekamp H, Anderson C, Saldana J F. 2010. Validation and calibration of ASCAT using CMOD5. n. IEEE Transactions on Geoscience and Remote Sensing, 48(1): 386-395.
DOI:10.1109/TGRS.2009.2027896 |
Wang L L, Ding Z Y, Zhang L, Yan C. 2019. Cfosat-1 realizes first joint observation of sea wind and waves. Aerospace China, 20(1): 20-27.
|
Yu L S, Weller R A. 2007. Objectively analyzed air-sea heat fluxes for the global ice-free oceans (1981-2005). Bulletin of the American Meteorological Society, 88(4): 527-540.
DOI:10.1175/BAMS-88-4-527 |
Yu L S. 2019. Global air-sea fluxes of heat, fresh water, and momentum: energy budget closure and unanswered questions. Annual Review of Marine Science, 11: 227-248.
DOI:10.1146/annurev-marine-010816-060704 |
Zhang H M, Reynolds R W, Bates J J. 2006. Blended and gridded high resolution global sea surface wind speed and climatology from multiple satellites: 1987-present. In: Proceedings of the 14th Conference on Satellite Meteorology and Oceanography. AMS, Atlanta. p. 2-23.
|
Zhao K, Zhao C F. 2019. Evaluation of HY-2A scatterometer ocean surface wind data during 2012-2018. Remote Sensing, 11(24): 2968.
DOI:10.3390/rs11242968 |