 2021, Vol. 39
Institute of Oceanology, Chinese Academy of Sciences
Article Information
- WANG Chaofeng, LI Haibo, DONG Yi, ZHAO Li, GREGORI Gérald, ZHAO Yuan, ZHANG Wuchang, XIAO Tian
- Planktonic ciliate trait structure variation over Yap, Mariana, and Caroline seamounts in the tropical Western Pacific Ocean
- Journal of Oceanology and Limnology, 39(5): 1705-1717
- http://dx.doi.org/10.1007/s00343-021-0476-4
Article History
- Received Dec. 15, 2020
- accepted in principle Feb. 27, 2021
- accepted for publication Apr. 14, 2021


2 Laboratory for Marine Ecology and Environmental Science, Pilot National Laboratory for Marine Science and Technology (Qingdao), Qingdao 266237, China;
3 Center for Ocean Mega-Science, Chinese Academy of Sciences, Qingdao 266071, China;
4 Aix-Marseille University, Toulon University, CNRS, IRD, Mediterranean Institute of Oceanology UM110, Marseille 13288, France
Planktonic ciliates (Ciliophora, Spirotrichea, Oligotrichia, and Choreotrichia) are small (size range of 10-200 μm) protists with cilia around the body, including aloricate ciliates and tintinnids (Lynn, 2008; Zhang et al., 2012, 2015). Planktonic ciliates are ubiquitous and important consumers of pico- (0.2-2 μm) and nano- (2-20 μm) sized phytoplankton, and are important food sources for metazoan and fish larvae (Stoecker et al., 1987; Dolan et al., 1999; Gómez, 2007). As the dominant component of the microzooplankton, the marine planktonic ciliate compartment is a key medium through microbial food web to classical food chain, which plays an important role in material circulation and energy flow in the marine ecosystem (Azam et al., 1983; Pierce and Turner, 1992; Calbet and Saiz, 2005).
Trait based approaches was proposed to describe plankton communities in a simple manner (Litchman et al., 2013; Kiørboe et al., 2018). The existence of lorica provide some protection as well as additional weight to drag for tintinnids (Capriulo et al., 1982). Tintinnids had a higher proportion in total ciliates in turbulent waters (Yu et al., 2016) and waters with higher chlorophyll concentration (Wang et al., 2020). Size classes of ciliate are important trait as in other plankton (Pomerleau et al., 2015; Brun et al., 2016). Arctic waters had a higher proportion of larger cells of aloricate ciliates and of tintinnids with larger lorica opening diameter (LOD) (Wang et al., 2020). LOD size classes were also used to estimate tintinnid functional redundancy (Dolan et al., 2016). Plankton in different depth experiences different temperature, food items, and metabolic rate and, therefore, shows different functional traits (Prowe et al., 2019; Teuber et al., 2019). Several types of vertical distribution pattern were reported for tintinnids (Kršinić, 1982; Wang et al., 2019a).
In the Western Pacific, the trait structures of aloricate size fraction, tintinnid proportion, tintinnid vertical distribution groups, and LOD size-classes were studied by Wang et al.(2019a, 2020). However, we still know very little about their variations in different hydrographic situations. Previous studies showed that seamount with abrupt structure could alter hydrological conditions at surrounding stations than that off sea areas, such as upwelling (Rogers, 1994, 2018; Ma et al., 2019). The response of planktonic ciliate trait structure to these hydrological variations needs to be elaborated. In this paper, we present the variation of planktonic ciliates trait structure in relation to the hydrological characteristics such as the depth of deep Chlorophyll a maximum (DCM) layers, surface temperature, and upwelling during three cruises in the tropical Western Pacific Ocean.
2 MATERIAL AND METHODSampling was conducted during three cruises performed from December 3, 2014 to January 8, 2015 (Yap seamount, transects A and B, winter), March 4 to April 3, 2016 (Mariana seamount, transects C and D, spring) and August 3 to September 7, 2017 (Caroline seamount, transects E and F, summer) aboard R/V Kexue (Science in Chinese) (Fig. 1) in the Western Pacific Ocean where depth was about 5 000 m. The depths at the top of the three seamounts were 300, 30, and 50 m over Yap, Mariana, and Caroline seamounts, respectively. For each seamount, the sampling stations were aligned into two approximately perpendicular transects (Fig. 1).

|
| Fig.1 Survey stations and transects over Yap (a), Mariana (b), and Caroline (c) seamounts in the tropical Western Pacific Ocean Red dashed box means transects A, C and E. |
For each station, vertical profiles of temperature, salinity (conductivity), and chlorophyll a in vivo fluorescence were obtained from the surface down to 200-m depth (or bottom with depth < 200 m) using a conductivity-temperature-pressure sensor (CTD; Sea-Bird Electronics, Bellevue, WA, USA). Water samples were collected at 3 to 7 depths using 12-L Niskin bottles attached to a rosette. The depths sampled were 3 m (surface), 30 m, 50 m (not for Yap seamount), 75 m, 100 m, 150 m, and 200 m (or bottom with depth < 200 m). Around the DCM, the sampling depths were adapted to sample the DCM if it was within 10 m of any neighbor sampling depth. All water samples (1 L) were fixed with 1% acid Lugol's iodine and stored at < 4 ℃ in the dark.
Each water sample was subsequently concentrated to about 100 mL by gently siphoning out supernatant water after at least a 48-h sedimentation in the laboratory. The settling and siphoning processes were repeated to concentrate each sample to a final volume of 20 mL (concentrated sample), then settled in an Utermöhl counting chambers (Utermöhl, 1958) for at least 24 h.
For each concentrated sample, the entire volume was examined using an Olympus IX 71 inverted microscope (100× or 400×). The statistical method of counting according to Lund et al. (1958), and the counting of 10-15 individuals in a sample volume of 1 L implies a counting error higher than 50% (Lund et al., 1958). Some loricae might have been empty when sampled (Kato and Taniguchi, 1993; Dolan and Yang, 2017). Because mechanic and chemical disturbance associated with collection and fixation procedures could provoke detachment of the protoplasma from the loricae (Paranjape and Gold, 1982; Alder, 1999), empty loricae of tintinnids were considered as living cells in our study.
For each species, size (length, width according to the shape) of the cells (for aloricate ciliates) or of the loricae (for tintinnids, especially length and oral diameter) were measured for at least 20 individuals when possible. According to lorica morphology and size, tintinnids were identified to the species level according to references (Kofoid and Campbell, 1929; Lynn, 2008; Zhang et al., 2012; Wang et al., 2019a). Ciliate volumes were estimated by using appropriate geometric shapes (cone, ball, and cylinder). Tintinnid carbon biomass was estimated using the equation: C=Vl (μm3, lorica volume)×0.053+444.5 (Verity and Lagdon, 1984). The conversion factor of carbon biomass for aloricate ciliates used in this study was 0.19 pg C/μm3 as defined by Putt and Stoecker (1989).
The size of the aloricate ciliates was divided into fractions of 10 μm according to the longest length, according to Lessard and Murrell (1996), Sohrin et al. (2010), and Wang et al. (2020). The size-fractions were further clustered into small (10-20 μm), medium (20-30 μm), and large (> 30 μm) (Sohrin et al., 2010). The vertical distribution of tintinnid species was defined according to Kršinić (1982). According to the sampling depth, four groups were classified: group Ⅰ (species in waters from 0- to 100-m depth), Ⅱ (species in waters from 50- to 200-m depth), Ⅲ (species in waters deeper than 100 m) and Ⅳ (species throughout the water column, which belong to group Ⅴ in Kršinić (1982)). The biogeography of tintinnid genera (e.g. neritic, cosmopolitan, and warm water types) were derived from Dolan et al. (2013). The tintinnids LOD were divided into different size classes, which are 4-μm apart (12-16 μm, 16-20 μm, and so on) according to Dolan et al. (2016). Redundant tintinnid species and proportion of redundant species calculation also followed Dolan et al. (2016).
3 RESULT 3.1 HydrographyHydrological characteristics over the three seamounts were different (Fig. 2). Horizontally, surface waters over Mariana seamount had a lower temperature (27.7-28.6 ℃, average 28.1±0.2 ℃) and a higher salinity (34.5-34.7, average 34.7±0.1) than surface waters over Yap (temperature 28.9-29.3 ℃, average 29.1±0.1 ℃, salinity 33.2-34.0, average 33.8±0.2) and Caroline (temperature 29.8-30.1 ℃, average 30.5±0.2 ℃, salinity 33.0-33.8, average 33.6±0.2) seamounts. The depths of 28 ℃ isotherm appeared at upper 100 m, 30 m, and 50 m over the Caroline, Mariana, and Yap, respectively. The chlorophyll a (Chl a) in vivo fluorescence values were less than 0.1 at surface layers over the three seamounts (Fig. 2).

|
| Fig.2 Vertical distribution of temperature (T), salinity (S), and chlorophyll a (Chl a) in vivo fluorescence from surface down to 200-m depth Black dots are the sampling points. St. means station. |
Water column was stratified according to temperature, salinity, and Chl a vertical distribution (Fig. 2). There was a weak upwelling in Mariana seamount at the top 50 m with temperature higher than 27.7 ℃, salinity lower than 34.7. The halocline and DCM layers were in about the same depths over three seamounts (Fig. 2). Compared to the DCM depths, Caroline (ranged from 120-150 m, average 126.7±8.3 m) and Mariana (80-110 m, average 107.5±5.6 m) seamounts were deeper than Yap (60-90 m, average 76.1±3.6 m) seamount (Fig. 2). The depth of weak upwelling around the top of Mariana seamount was shallower than 50 m, which had no effect on the DCM depths (average 107.5±5.6 m).
3.2 Ciliate abundance and biomassThe vertical profiles of ciliate average abundance showed bimodal (in the surface and at the DCM layers) patterns over Yap, Mariana, and Caroline seamounts (Figs. 3-4). However, there were some differences in some details.

|
| Fig.3 Vertical distribution of ciliate abundance and biomass from the surface down to 200-m depth Black dots are the sampling points. St. means station. |

|
| Fig.4 Vertical distribution of the average planktonic ciliate (aloricate ciliates and tintinnids) abundance in every sampling layers (a), with a zoom for tintinnids (b), and contribution of the two groups to the total ciliate abundance (c) DCM: deep chlorophyll a maximum layer (black dashed box). |
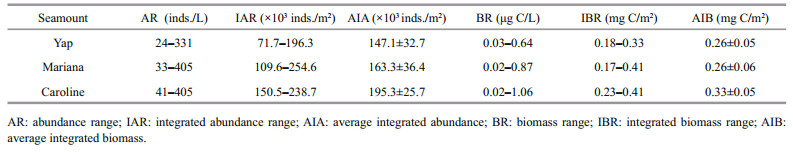
Ranges of ciliate abundance and biomass at surface (130-323 inds./L, 0.24-0.57 μg C/L) and DCM layers (130-331 inds./L, 0.17-0.64 μg C/L) over Yap seamount were lower than Mariana (surface 103- 384 inds./L, 0.11-0.87 μg C/L, DCM 161-405 inds./L, 0.17-0.72 μg C/L) and Caroline (surface 174-380 inds./L, 0.23-1.06 μg C/L, DCM 141-405 inds./L, 0.14-0.77 μg C/L) seamounts. The integrated abundance (the upper 200 m or bottom when depth < 200 m) over Yap ((71.7-196.3)×103 inds./m2, average (147.1±32.7)×103 inds./m2) was lower than Mariana ((109.6-254.6)×103 inds./m2, average (163.3±36.4)×103 inds./m2) and Caroline ((150.5-238.7)×103 inds./m2, average (195.3±25.7)×103 inds./m2) seamounts (Table 1), but the integrated biomass over Yap (0.18-0.33 mg C/m2, average 0.26±0.05 mg C/m2) seamount was similar to Mariana (0.17-0.41 mg C/m2, average 0.26±0.06 mg C/m2) seamount, which both lower than Caroline (0.23-0.41 mg C/m2, average 0.33±0.05 mg C/m2) seamount (Table 1).
|
Vertically, the highest tintinnid abundance appeared at DCM layers over Yap and Mariana seamounts. While over Caroline seamount with the deepest DCM (average 126.7±8.3 m), the highest tintinnid abundance occurred at 100-m depth instead of the DCM layer. Yap seamount had the lowest value of tintinnid average abundance proportion to total ciliates (average 4.8%±2.9%) compared to Mariana (average 6.6%±3.9%) and Caroline (average 6.4%±3.1%) seamounts. Although the highest tintinnid abundance proportion to total ciliates appeared at around 100-m depth over all three seamounts, this value over Mariana (12.0%) and Caroline (11.5%) seamounts were about twice higher than Yap (6.4%) seamount (Fig. 4).
3.3 Aloricate ciliate size-fractionAbundance proportion of different size-fractions of aloricate ciliates from surface to 200-m depth revealed that individuals of 10-20-μm size-fraction occupied more percentage (larger than 30% at each depth) over the three seamounts (Fig. 5). Vertically, the abundance proportion of aloricate ciliates in the small size-fraction (10-20 μm) increased from surface down to 200-m depth, and the medium size-fraction (20-30 μm) abundance proportion was relatively constant throughout the water column over the three seamounts (Fig. 5). Despite the above-mentioned similarities, there were also some dissimilarities. First, at the surface layer of Yap seamount, the large size-fraction (> 30 μm) aloricate ciliate abundance proportion (44.4%) were higher than that of Mariana (32.8%) and Caroline (36.1%) seamounts. Second, at surface and 30-m depth of Yap seamount area, the large size-fraction (> 30 μm) abundance proportion was larger than the small size-fraction (10-20 μm). While over both Mariana and Caroline seamounts, the large size-fraction (> 30 μm) abundance proportion was lower than the small size-fraction (10-20 μm) (Fig. 5).

|
| Fig.5 Average abundance proportion (AP) of the different sized aloricate ciliates in every sampling layers Aloricate ciliate size fraction were divided into 10 μm increments (a), which further classified into small (10-20 μm), medium (20-30 μm) and large (> 30 μm) (b). |
Range of tintinnid abundance over Yap (0-26 inds./L) seamount was lower than Mariana (0-33 inds./L) and Caroline (1-76 inds./L) seamounts. Totally, 89 tintinnid species from 32 genera were found in all stations over three seamounts (Fig. 6; Supplementary Fig.S1; Table 2). Among them, 64 tintinnid species from 28 genera, 73 tintinnid species from 31 genera and 76 tintinnid species from 33 genera were recorded over Yap, Mariana, and Caroline seamounts, respectively (Table 2). Fifty tintinnid species appeared in all three seamounts areas. Salpingella faurei was the top dominant species over Mariana and Caroline seamounts. Abundance over Mariana (ranged from 0-11 inds./L) and Caroline (ranged from 0-5 inds./L) seamounts were higher than Yap (ranged from 0-3 inds./L) seamount.

|
| Fig.6 Photomicrographs of several tintinnid species found in this study a. Steenstrupiella steenstrupi; b. Steenstrupiella intumescens; c. Cyttarocylis eucecryphalus; d. Salpingella faurei; e. Epiplocylis constricta; f. Canthariella brevis; g. Steenstrupiella gracilis, h. Ascampbelliella armilla; i. Eutintinnus hasleae. |
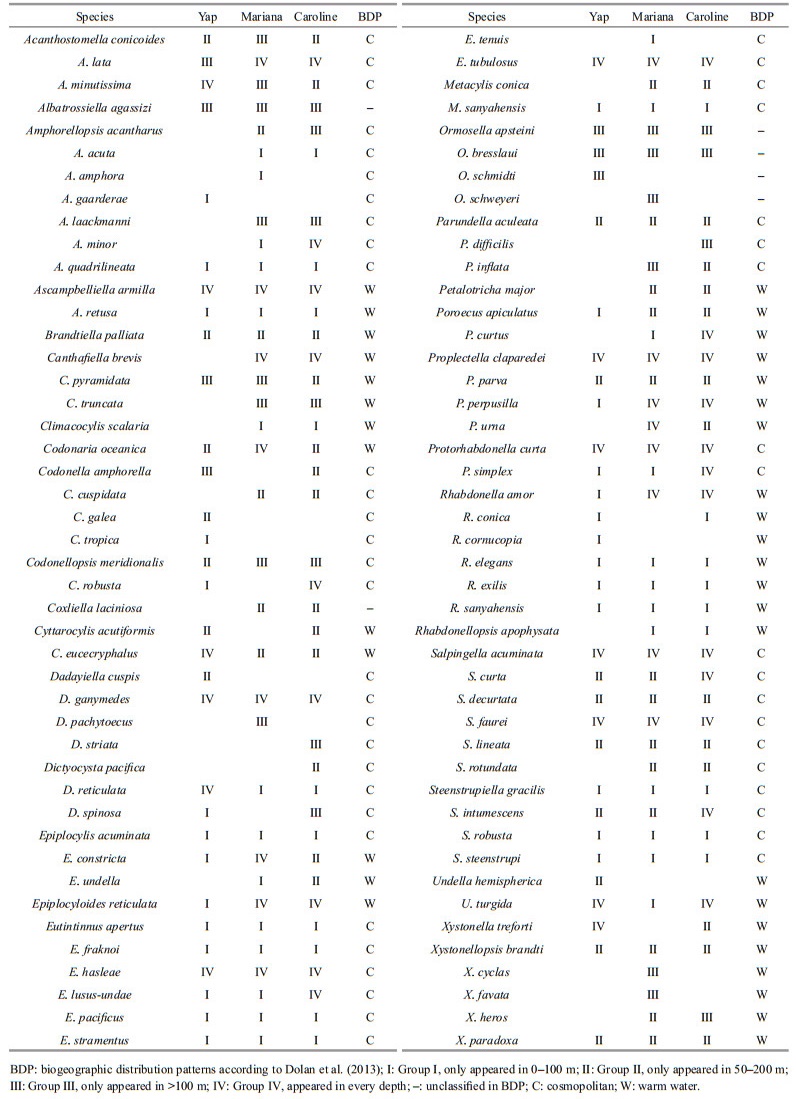
Based on the vertical distribution of abundance, tintinnid species were divided into four groups over every seamount (Table 2). Groups Ⅰ and Ⅳ were dominant component from surface to 100 m contributing to more than 60% of the total tintinnid abundance proportion over all three seamounts. Group Ⅰ species abundance was high in surface, and then decreased to 100-m depth. Group Ⅳ species abundance increased from surface to DCM (Yap and Mariana seamounts) or 100 m (Caroline seamount), then decreased to 200-m depth (Fig. 7). The group Ⅳ abundance and abundance proportion at surface layer over Mariana (3.9 inds./L; 36.9%) seamount were higher than Yap (1.6 inds./L; 14.9%) and Caroline (3.2 inds./L; 28.7%) seamounts (Fig. 7). At 30-m depth, group Ⅳ species abundance was higher than group Ⅰ over Mariana seamount (Fig. 7), while over Yap and Caroline seamounts, group Ⅳ species abundance was lower than group Ⅰ.

|
| Fig.7 Vertical distribution of different types of tintinnid abundances and its abundance proportion (AP) in every sampling layers Group Ⅰ: only appeared in 0-100 m; Group Ⅱ: only appeared in 50-200 m; Group Ⅲ: only appeared in > 100 m; Group Ⅳ: appeared in every depth. |
The number of size-classes for the tintinnid species LOD over Yap (13), Mariana (15), and Caroline (16) seamounts were similar (Fig. 8). The LOD size-class with a maximum species richness (28-32 μm) was also same over the three seamounts. Although the number of redundant species over Caroline seamount (61 species) was higher than Yap (50 species) and Mariana (59 species) seamounts, the proportion of redundant species was similar over Yap (79.4%), Mariana (79.7%), and Caroline (79.2%) seamounts.

|
| Fig.8 Number of species (N) and its abundance proportion (AP) for each lorica oral diameter (LOD) size-class of tintinnid species |
The LOD size-class with the highest abundance proportion was 24-28 μm over the three seamounts (Fig. 8). Steenstrupiella gracilis, Canthariella brevis, and Ascampbelliella armilla were the main contributors to the higher abundance proportion of the 24-28-μm LOD size-class for the three seamounts (Fig. 6).
The abundance proportion of 12-16-μm LOD size-class was much higher over Mariana and Caroline seamounts compared to Yap seamount. Salpingella faurei was the main contributor of the 12-16-μm LOD size-class (Figs. 6 & 8). Average maximum abundance of Salpingella faurei in DCM layer over Caroline (2.1 inds./L) seamount or at 150-m depth for Mariana (3.3 inds./L) seamount were higher than at Yap (0.9 inds./L, 100-m depth) seamount.
3.5 Correlation between ciliate abundance and environmental factorsDifferent ciliate group (aloricate ciliates, tintinnids, and total ciliates) abundances had different correlation with environment factors (depth, temperature, salinity, and Chl a) (Table 3). The total ciliate abundance had a positive correlation with temperature and Chl a in vivo fluorescence, but negative correlation with depth over the three seamounts (Table 3). Ciliate abundance had negative correlation with salinity over Yap and Caroline seamounts, but a positive correlation over Mariana seamount. Aloricate ciliate and tintinnid abundance had significant positive correlation with temperature over the three seamounts (Table 3). Over Mariana seamount, aloricate ciliate and tintinnid had significant positive correlation with salinity, while it changed into a significant negative correlation over Caroline seamount (Table 3). Tintinnid abundance over Yap, Mariana, and Caroline seamounts had significant positive correlation with Chl a (Table 3).

|
The ciliate vertical distribution patterns were the same over three seamounts with abundance peaks in surface and DCM layers. The food items of the ciliate might be the reason for the two groups: Prochlorococcus and picoeukaryotes had maximum abundance in DCM, Synechococcus and heterotrophic bacteria had maximum abundance in upper 50-m depth (Zhao et al., 2017, 2020).
Although ciliates trait structure was proposed by previous studies (Kršinić, 1982; Dolan et al., 2016; Yu et al., 2016; Wang et al., 2020), there were few studies on their variations. The variations of size classes and tintinnid proportion were compared through a large space scale in the Arctic, Subarctic, and tropical waters (Wang et al., 2020). The present study contributed to the study on ciliate trait structure variations in the tropical waters with different hydrological conditions.
4.1 Large ciliates in the surface layer over waters with shallow DCM depthThe DCM depth over Yap seamount was shallower than other two seamounts, and the integrated abundance over Yap seamount was lower than Mariana seamount, while the integrated biomass over Yap seamount was similar to Mariana seamount (Table 2). The large size-fraction (> 30 μm) abundance proportion was also higher than Mariana and Caroline seamounts. For tintinnids, the 12-16-μm LOD size-class had low abundance proportion in the shallow DCM depth water over Yap seamount. These results indicate that the largest aloricate ciliates and tintinnids were dominant component over waters with a shallow DCM depth. This phenomenon also occurred over Cobb seamount where the ciliate trait structure showed a low abundance but a large size (Sime-Ngando et al., 1992).
4.2 Relationships between tintinnids and upwellingA weak upwelling was put in evidence over Mariana seamount. Previous studies showed that nutrients (e.g., NO3-N, dissolved inorganic nitrogen (DIN), PO4-P, and SiO3-Si)) had obvious uplifts around this seamount (Ma et al., 2019). However, no seamount effect was evidenced on phytoplankton (Zhao et al., 2017; Dai et al., 2020). The reason might be the shallowness of the weak upwelling. The nutrient concentrations were high in waters deeper than 100 m over three seamounts (Ma et al., 2019). Therefore, the weak upwelling in the upper 50 m could not cause a strong increase of nutrient concentration in surface water, which could not eventually enhance phytoplankton growth significantly. Aloricate ciliate group also did not have any obvious increase around the seamount compared to off seamount. For tintinnids, group Ⅳ (deep-water dweller) had a higher abundance proportion than group Ⅰ (surface water dweller) at 30-m depth. This observation was different for Yap and Caroline seamounts, and along a transect in the tropical Western Pacific Ocean (Wang et al., 2019a). This might reflect a seamount effect over Mariana seamount.
4.3 Tintinnids and DCM depthOur results showed that DCM depth influenced tintinnid trait structure. When the DCM depths were shallower than 100 m, the tintinnid highest abundances appeared at these DCM depths. While when DCM depths were deeper than 100 m, they were in about 100-m depth (Fig. 4). This result was consistent with a transect in the tropical Western Pacific Ocean described in Wang et al. (2019a). The around 100-m depth might be a deepest boundary for tintinnid maximum abundance. In the tropical seas, DCM is a common feature, with depths varied from 50 to 150 m (Martin et al., 2006). Whether these relationships reoccur in different parts of the oceans need more investigations.
Salpingella faurei is a cosmopolitan deep water species and abundant when DCM was deeper than 100-m depth over Mariana and Caroline seamounts. This species distributed from tropical seas to Arctic Oceans (Dolan et al., 2013; Li et al., 2018; Wang et al., 2019a, b). In the Bering Sea and the Arctic Ocean, S. faurei mainly distributed in the DCM layers. While at two stations with temperature and salinity well mixed in the Bering Sea, this species could also be brought to surface waters (Wang et al., 2019b).
5 CONCLUSIONIn this study, we compared the planktonic ciliate trait structure over Yap, Caroline, and Mariana seamounts. We evidenced that weak upwelling and DCM depths influence the planktonic ciliate trait structure. At the surface layer with shallower DCM, the large size-fraction (> 30 μm) abundance proportion to aloricate ciliates increased. The weak upwelling evidenced on Mariana seamount could take group Ⅳ tintinnid species into surface waters, which lead to a higher abundance of this group compared to group Ⅰ at 30-m depth. The depths of maximum tintinnid abundance were around 100 m even when DCM deeper than 100 m. Despite of the depth variation of DCM, tintinnid abundance proportion to total ciliate was highest at about 100-m depth. Our results represent a snapshot influence of the upwelling and the deeper DCM to ciliate trait structure. It constitutes a baseline for further comparative studies on the temporal and spatial environmental influence on ciliate in other seas.
6 DATA AVAILABILITY STATEMENTThe datasets generated and/or analyzed during the current study are available from the corresponding author on reasonable request.
7 ACKNOWLEDGMENTSpecial thanks to the great efforts of the captain and crew of R/V Kexue during the cruises over Yap, Mariana, and Caroline seamounts.
Electronic supplementary materialSupplementary material (Supplementary Fig.S1) is available in the online version of this article at https://doi.org/10.1007/s00343-021-0476-4.
Alder V A. 1999. Tintinnoinea. In: Boltovskoy D ed. South Atlantic Zooplankton. Backhuys Publishers, Leiden, Netherlands. p. 321-384.
|
Azam F, Fenchel T, Field J G, Gray G S, Meyer-Reil L A, Thingstad F. 1983. The ecological role of water-column microbes in the sea. Marine Ecology-Progress Series, 10(3): 257-263.
DOI:10.3354/meps010257 |
Brun P, Payne M R, Kiørboe T. 2016. Trait biogeography of marine copepods-an analysis across scales. Ecology Letters, 19(12): 1 403-1 413.
DOI:10.1111/ele.12688 |
Calbet A, Saiz E. 2005. The ciliate-copepod link in marine ecosystems. Aquatic Microbial Ecology, 38(2): 157-167.
DOI:10.3354/ame038157 |
Capriulo G M, Gold K, Okubo A. 1982. Evolution of the lorica in tintinnids: a possible selective advantage. Annales de L'Institut Océanographique, 58(Suppl): 319-323.
|
Dai S, Zhao Y F, Li X G, Wang Z Y, Zhu M L, Liang J H, Liu H J, Tian Z Y, Sun X X. 2020. The seamount effect on phytoplankton in the tropical western Pacific. Marine Environmental Research, 162: 105094.
DOI:10.1016/j.marenvres.2020.105094 |
Dolan J R, Montagnes D J S, Agatha S, Coats D W, Stoecker D K. 2013. The Biology and Ecology of Tintinnid Ciliates: Models for Marine Plankton. John Wiley & Sons, Chichester. p. 1-296.
|
Dolan J R, Vidussi F, Claustre H. 1999. Planktonic ciliates in the Mediterranean Sea: longitudinal trends. Deep Sea Research Part Ⅰ. Oceanographic Research Papers, 46(12): 2 025-2 039.
DOI:10.1016/S0967-0637(99)00043-6 |
Dolan J R, Yang E J. 2017. Observations of apparent lorica variability in Salpingacantha (Ciliophora: tintinnida) in the Northern Pacific and Arctic Oceans. Acta Protozoologica, 56(3): 217-220.
DOI:10.4467/16890027AP.17.019.7500 |
Dolan J R, Yang E J, Kang S H, Rhee T S. 2016. Declines in both redundant and trace species characterize the latitudinal diversity gradient in tintinnid ciliates. The ISME Journal, 10(9): 2 174-2 183.
DOI:10.1038/ismej.2016.19 |
Gómez F. 2007. Trends on the distribution of ciliates in the open Pacific Ocean. Acta Oecologica, 32(2): 188-202.
DOI:10.1016/j.actao.2007.04.002 |
Kato S, Taniguchi A. 1993. Tintinnid ciliates as indicator species of different water masses in the western North Pacific Polar Front. Fisheries Oceanography, 2(3-4): 166-174.
DOI:10.1111/j.1365-2419.1993.tb00132.x |
Kiørboe T, Visser A, Andersen K H. 2018. A trait-based approach to ocean ecology. ICES Journal of Marine Science, 75(6): 1 849-1 863.
DOI:10.1093/icesjms/fsy090 |
Kofoid C A, Campbell A S. 1929. A conspectus of the marine and fresh-water Ciliata belonging to the suborder Tintinnoinea, with descriptions of new species principally from the Agassiz Expedition to the Eastern Tropical Pacific, 1904-1905. University of California Publications in Zoology, 34: 1-403.
|
Kršinić F. 1982. On vertical distribution of tintinnines (Ciliata, Oligotrichida, Tintinnina) in the open waters of the South Adriatic. Marine Biology, 68(1): 83-90.
DOI:10.1007/BF00393145 |
Lessard E J, Murrell M C. 1996. Distribution, abundance and size composition of heterotrophic dinoflagellates and ciliates in the Sargasso Sea near Bermuda. Deep Sea Research Part Ⅰ: Oceanographic Research Papers, 43(7): 1 045-1 065.
DOI:10.1016/0967-0637(96)00052-0 |
Li H B, Zhang W C, Zhao Y, Zhao L, Dong Y, Wang C F, Liang C, Xiao T. 2018. Tintinnid diversity in the tropical west pacific ocean. Acta Oceanologica Sinica, 37(10): 218-228.
DOI:10.1007/s13131-018-1148-x |
Litchman E, Ohman M D, Kiørboe T. 2013. Trait-based approaches to zooplankton communities. Journal of Plankton Research, 35(3): 473-484.
DOI:10.1093/plankt/fbt019 |
Lund J W G, Kipling C, Le Cren E D. 1958. The inverted microscope method of estimating algal numbers and the statistical basis of estimations by counting. Hydrobiologia, 11(2-3): 143-170.
DOI:10.1007/BF00007865 |
Lynn D H. 2008. The Ciliated Protozoa: Characterization, Classification, and Guide to the Literature. 3th edn. Springer, Dordrecht. p. 1-455.
|
Ma J, Song J M, Li X G, Yuan H M, Li N, Duan L Q, Wang Q D. 2019. Environmental characteristics in three seamount areas of the tropical Western Pacific Ocean: focusing on nutrients. Marine Pollution Bulletin, 143: 163-174.
DOI:10.1016/j.marpolbul.2019.04.045 |
Martin E S, Harris R P, Irigoien X. 2006. Latitudinal variation in plankton size spectra in the Atlantic Ocean. Deep Sea Research Part Ⅱ. Topical Studies in Oceanography, 53(14-16): 1 560-1 572.
DOI:10.1016/j.dsr2.2006.05.006 |
Paranjape M A, Gold K. 1982. Cultivation of marine pelagic protozoa. Annales de L'Institut Océanographique, 58(Suppl): 143-150.
|
Pierce R W, Turner J T. 1992. Ecology of planktonic ciliates in marine food webs. Reviews in Aquatic Sciences, 6(2): 139-181.
|
Pomerleau C, Sastri A R, Beisner B E. 2015. Evaluation of functional trait diversity for marine zooplankton communities in the northeast subarctic Pacific Ocean. Journal of Plankton Research, 37(4): 712-726.
DOI:10.1093/plankt/fbv045 |
Prowe A E F, Visser A W, Andersen K H, Chiba S, Kiørboe T. 2019. Biogeography of zooplankton feeding strategy. Limnology and Oceanography, 64(2): 661-678.
DOI:10.1002/lno.11067 |
Putt M, Stoecker D K. 1989. An experimentally determined carbon: volume ratio for marine "oligotrichous" ciliates from estuarine and coastal waters. Limnology and Oceanography, 34(6): 1 097-1 103.
DOI:10.4319/lo.1989.34.6.1097 |
Rogers A D. 1994. The biology of seamounts. Advances in Marine Biology, 30: 305-350.
DOI:10.1016/S0065-2881(08)60065-6 |
Rogers A D. 2018. The biology of seamounts: 25 Years on. Advances in Marine Biology, 79: 137-224.
DOI:10.1016/bs.amb.2018.06.001 |
Sime-Ngando T, Juniper K, Vézina A. 1992. Ciliated protozoan communities over Cobb Seamount: increase in biomass and spatial patchiness. Marine Ecology-Progress Series, 89(1): 37-51.
DOI:10.3354/meps089037 |
Sohrin R, Imazawa M, Fukuda H, Suzuki Y. 2010. Full-depth profiles of prokaryotes, heterotrophic nanoflagellates, and ciliates along a transect from the equatorial to the subarctic central Pacific Ocean. Deep Sea Research Part Ⅱ. Topical Studies in Oceanography, 57(16): 1 537-1 550.
DOI:10.1016/j.dsr2.2010.02.020 |
Stoecker D K, Michaels A E, Davis L H. 1987. Grazing by the jellyfish, Aurelia aurita, on microzooplankton. Journal of Plankton Research, 9(5): 901-915.
DOI:10.1093/plankt/9.5.901 |
Teuber L, Hagen W, Bode M, Auel H. 2019. Who is who in the tropical Atlantic? Functional traits, ecophysiological adaptations and life strategies in tropical calanoid copepods. Progress in Oceanography, 171: 128-135.
DOI:10.1016/j.pocean.2018.12.006 |
Utermöhl H. 1958. Zur vervollkommnung der quantitativen phytoplankton-Methodik: mit 1 Tabelle und 15 abbildungen im Text und auf 1 Tafel: methods of collecting plankton for various purposes are discussed. SIL Communications, 1953-1996: Internationale Vereinigung für Theoretische und Angewandte Limnologie: Mitteilungen, 9(1): 1-38.
DOI:10.1080/05384680.1958.11904091 |
Verity P G, Lagdon C. 1984. Relationships between lorica volume, carbon, nitrogen, and ATP content of tintinnids in Narragansett Bay. Journal of Plankton Research, 6(5): 859-868.
DOI:10.1093/plankt/6.5.859 |
Wang C F, Li H B, Xu Z Q, Zheng S, Hao Q, Dong Y, Zhao L, Zhang W C, Zhao Y, Grégori G, Xiao T. 2020. Difference of planktonic ciliate communities of the tropical West Pacific, the Bering Sea and the Arctic Ocean. Acta Oceanologica Sinica, 39(4): 9-17.
DOI:10.1007/s13131-020-1541-0 |
Wang C F, Li H B, Zhao L, Zhao Y, Dong Y, Zhang W C, Xiao T. 2019a. Vertical distribution of planktonic ciliates in the oceanic and slope areas of the western Pacific Ocean. Deep Sea Research Part Ⅱ: Topical Studies in Oceanography, 167: 70-78.
DOI:10.1016/j.dsr2.2018.08.002 |
Wang C F, Xu Z Q, Liu C G, Li H B, Liang C, Zhao Y, Zhang G T, Zhang W C, Xiao T. 2019b. Vertical distribution of oceanic tintinnid (Ciliophora: Tintinnida) assemblages from the Bering Sea to Arctic Ocean through Bering Strait. Polar Biology, 42(11): 2 105-2 117.
DOI:10.1007/s00300-019-02585-2 |
Yu Y, Zhang W C, Feng M P, Zhao Y, Zhang C X, Zhou F, Xiao T. 2016. Differences in the vertical distribution and response to freshwater discharge between aloricate ciliates and tintinnids in the East China Sea. Journal of Marine Systems, 154: 103-109.
DOI:10.1016/j.jmarsys.2015.02.005 |
Zhang W C, Feng M P, Yu Y, Zhang C X, Xiao T. 2012. An Illustrated Guide to Contemporary Tintinnids in the World. Science Press, Beijing, China. p. 1-499.
(in Chinese)
|
Zhang W C, Yu Y, Xiao T. 2015. An Illustrated Guide to Marine Planktonic Aloricate Oligotrich Ciliates. Science Press, Beijing, China. p.1-135.
(in Chinese)
|
Zhao L, Zhao Y C, Wang C F, Zhang W C, Sun X X, Li X G, Zhao Y, Xiao T. 2017. Comparison in the distribution of microbial food web components in the Y3 and M2 seamounts in the tropical western Pacific. Oceanologia et Limnologia Sinica, 48(6): 1 446-1 455.
(in Chinese with English abstract) |
Zhao Y C, Zhao Y, Zheng S, Zhao L, Li X G, Zhang W C, Grégori G, Xiao T. 2020. Virioplankton distribution in the tropical western Pacific Ocean in the vicinity of a seamount. MicrobiologyOpen, 9(6): 1 207-1 224.
DOI:10.1002/mbO3.1031 |