 2021, Vol. 39
Institute of Oceanology, Chinese Academy of Sciences
Article Information
- MA Jun, SONG Jinming, LI Xuegang, WANG Qidong, YUAN Huamao, LI Ning, DUAN Liqin
- Analysis of differences in nutrients chemistry in seamount seawaters in the Kocebu and M4 seamounts in Western Pacific Ocean
- Journal of Oceanology and Limnology, 39(5): 1662-1674
- http://dx.doi.org/10.1007/s00343-020-0239-7
Article History
- Received Jun. 22, 2020
- accepted in principle Oct. 23, 2020
- accepted for publication Dec. 8, 2020


2 Laboratory for Marine Ecology and Environmental Science, Qingdao National Laboratory for Marine Science and Technology, Qingdao 266237, China;
3 University of Chinese Academy of Sciences, Beijing 100049, China;
4 Center for Ocean Mega-Science, Chinese Academy of Sciences, Qingdao 266071, China
Nutrients are the material basis of marine ecosystems, and their concentrations directly affect the primary productivity in the ocean, causing a profound impact on the structure and composition of marine biological community (Song, 2010; Ma et al., 2019b, 2020b). In the marine ecosystem, nutrients areclosely related to marine biological activities and environmental factors, and the related researches are always important in marine ecology (Song and Yuan, 2017; Xing et al., 2017; Ma et al., 2019a).
Seamount refers to an uplift that lies below sea level and protrudes more than 1 000 m above the seafloor (Epp and Smoot, 1989; Ma et al., 2018), and there are about 30 000 seamounts in the world (Yesson et al., 2011). Although they have different shapes and sizes, as prominent terrains, seamounts are natural obstacles for the current and have a profound impact on the surrounding hydrological environment. For example, upwelling due to the "seamount-current" interaction is the most common hydrological phenomenon around the seamount. The Taylor columns may generate under the certain shapes, latitudes, and current speed. Various hydrological phenomena such as ocean current acceleration, internal waves, and vortices could also be generated around the seamount (Genin, 2004; Read and Pollard, 2017; Ma et al., 2018). Meanwhile, changes in hydrological environment further affect the biological community and other environmental factors, resulting in the formation of relatively isolated ecosystems around seamounts, which often have high primary productivity and biodiversity, and this phenomenon is known as a "seamount effect" (Clark et al., 2010; ça et al., 2012).
The Western Pacific Ocean, a typical oligotrophic ocean, is known for its intricate hydrological environment and significant impact on the global climate, which is always a hotspot in the world's ocean research (Messié and Radenac, 2006; Ma et al., 2019b). Meanwhile, the Western Pacific Ocean is also one of the important areas where seamounts mainly distributed, and a large number of seamounts exacerbate the complexity of hydrological environment to make the ecosystem more complex in this region (Yesson et al., 2011; Ma et al., 2019a). The study of nutrients is vital to understand the ecosystem structure in seamount areas and to clarify the "seamount effect" (Dower and Mackas, 1996; Ma et al., 2019b); however, only few studies on nutrients in the seamount areas of the Western Pacific Ocean are available at present. Specially, the euphotic zone is often located at the water layers within 200 m in the ocean (Ma et al., 2018), which is the most active area of marine life, and the content of biogenic elements in this area directly controls the primary productivity. Therefore, the euphotic zone is an ideal area to explore the "seamount effect" on the nutrients cycle.
In this paper, the Kocebu and M4 seamount areas in the Western Pacific Ocean were investigated, the distribution characteristics of nutrients in the euphotic zone of the two seamount-areas clarified, the "seamount effect" on nutrients distribution analyzed, the similarities and differences in nutrients distribution between the two seamounts compared, and the controlling factors causing the differences discussed. This article provided a reference for understanding the nutrients distribution in seamount area and the comparative study of nutrients in different seamount areas.
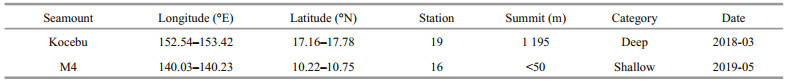
2 MATERIAL AND METHOD 2.1 Study areaThe Kocebu and M4 seamounts are located in the Western Pacific Ocean. There is the North Equatorial Current (NEC) in the upper water (0–200 m) in this region (Toole et al., 1988; Hu et al., 2015). In March 2018 and May 2019, two comprehensive surveys were carried out in the two seamount-areas on board the R/V Science, respectively. The Kocebu seamount is located at the edge position of the Western Pacific Warm Pool (125°E–165°E, 0°N–16°N) (Sun et al., 2013; Zhan et al., 2013), with the peak depth of 1 195 m, which is a typical deep seamount (Genin, 2004; Ma et al., 2018). There were 19 stations above it, divided into sections A and B (named station K-A and K-B), which intersected at station O (named station K-O). The M4 seamount is located at the core of Western Pacific Warm Pool, with a peak depth of < 50 m, which is a typical shallow seamount (Genin, 2004; Ma et al., 2018). There were 16 stations above it, also divided into A and B (named station M-A and M-B), which intersected at station O (named station M-O) (Fig. 1, Table 1). The Kocebu and M4 seamounts are deep seamount and shallow seamount, respectively, which are located in the adjacent seas and are ideal areas for exploring the difference between deep and shallow seamounts.

|
| Fig.1 Sampling stations in the Kocebu and M4 seamount areas a. locations of Kocebu and M4 seamount areas; b. location and topography of Kocebu seamount (the red rectangle represents section A); c. location and topography of M4 seamount (the red rectangle represents section A). NEC: North Equatorial Current. |
During sampling, the dynamic positioning system of the R/V Science was turned on to ensure the hull position. At each station, CTD (Sea-bird SBE911, USA) was used to measure temperature and salinity, and Niskin water sampler (KC-Denmark, Denmark) was used to collect water samples at depths of 0, 30, 50, 75, 100, 150, and 200 m. Nutrients and chlorophyll-a (Chl a) samples were collected in accordance with the National Specification for Oceanographic Survey (GB12763.6-2007, China).
Nutrients: collect 250 mL of water samples in each water layer, filter them with Whatman GF/F filter (Whatman GF/F, UK) (a high temperature burn and 1% hydrochloric acid wash before using it), put them into 250-mL high density polyethylene bottles, fix them with chloroform (final concentration 2‰) to obtain nitrate (NO3-N), nitrite (NO2-N), phosphate (PO4-P), and silicate (SiO3-Si) samples, store the samples in the refrigerator at -20 ℃, and bring them to laboratory for measurement. During the measurement, the nutrients concentrations were determined using an automatic nutrients analyzer (SEAL QuAAtro, Germany), and the dissolved inorganic nitrogen concentration (DIN) was obtained by summing NO3-N and NO2-N. The detection limits of NO3-N, NO2-N, PO4-P, and SiO3-Si concentrations were 0.02, 0.01, 0.01, and 0.01 μmol/L, respectively (Xing et al., 2017; Ma et al., 2019b). Meanwhile, to determine the precision of analysis, China's national standard references were used, and all the nutrients had the qualified precisions (better than 3%) and recoveries (between 97.2% and 103.5%).
Chl a: collect 2 000 mL of water samples in each water layer, filter them with 200-μm sieve to remove zooplankton in the water, and filter with 0.7-μm Whatman GF/F filter to obtain Chl-a samples, and then store the samples in the refrigerator at -20 ℃ in the dark and take it back to the laboratory for measurement. During the measurement, the samples were extracted with 90% acetone for 12–24 h, and then the concentration of Chl a (mg/m3) was measured using a Turner fluorescence photometer (Turner Designs, USA) (Zhang et al., 2016; Ma et al., 2020a), setting the excitation wavelength as 436 nm, the emission wavelength is 670 nm, and the calculation formula is based on Parsons et al. (1984).
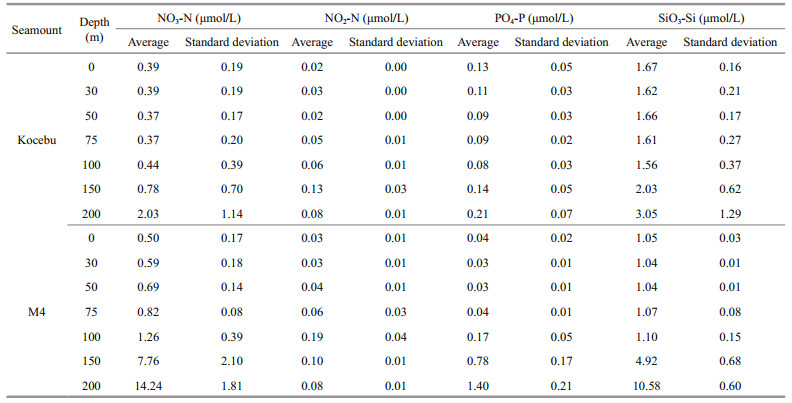
3 RESULT AND DISCUSSION 3.1 Vertical distribution of nutrients in the Kocebu and M4 seamount areasThe vertical distributions of NO3-N, PO4-P, and SiO3-Si in euphotic zone of the Kocebu and M4 seamount areas were similar in pattern, and they gradually increased with the increase of water depth (Fig. 2; Table 2). In water layers within 100 m, concentrations of NO3-N, PO4-P, and SiO3-Si in the two seamount-areas were extremely low. The average concentrations of them in the Kocebu seamount area were 0.39, 0.10, and 1.64 μmol/L, while those in the M4 seamount area were 0.77, 0.06, and 1.06 μmol/L, respectively. The vertical distribution of nutrients in euphotic zone of the two seamount areas accorded with the general law of oligotrophic ocean in the Western Pacific Ocean, i.e., due to the depletion of phytoplankton in the euphotic zone and lack of supplement, the concentrations of NO3-N, PO4-P, and SiO3-Si are at very low levels (Messié and Radenac, 2006; Salihoglu et al., 2008). Li et al. (2016), Ma et al. (2019a), and Ma et al. (2019b) also found similar vertical distribution characteristics of nutrients in relevant waters of the Western Pacific Ocean.

|
| Fig.2 Vertical distribution of nutrients in the Kocebu and M4 seamount areas |
|
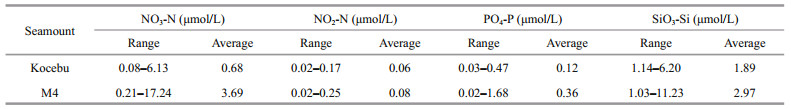
There were also some differences in the vertical distribution of nutrients between Kocebu and M4 seamount areas. In depth below 100 m, concentrations of NO3-N, PO4-P, and SiO3-Si in the M4 seamount area increased rapidly, e.g., reaching 7.76, 0.78, and 4.92 μmol/L in water layer of 150 m, respectively, which were 9.9, 5.7, and 2.4 times as those in the Kocebu seamount area. In the water layer of 200 m, these parameters were 14.24, 1.40, and 10.58 μmol/L, respectively, which were 7.0, 6.6, and 3.5 times as those in the Kocebu seamount area. Differences in nutrient change in water layers below 100 m in the two seamount areas led directly to that the concentrations of NO3-N, PO4-P, and SiO3-Si in the M4 seamount in the euphotic zone were much higher than those in the Kocebu seamount area, being 3.69, 0.36, and 2.97 μmol/L, which were 5.4, 3.0, and 1.57 times as those in the Kocebu seamount area, respectively (Table 3). In addition, although the NO2-N in the two seamount-areas increased first and then decreased, the NO2-N in the Kocebu seamount area reached the maximum (0.13 μmol/L) in water layer of 150 m, while it reached the maximum (0.19 μmol/L) in water layer of 100 m in the M4 seamount area (Fig. 2).
|
The Kocebu and M4 seamount areas were located at the core and edge of the Western Pacific Warm Pool, respectively, and there were some differences in the characteristics of water masses, which may directly affect the distribution of nutrients (Sylaios et al., 2006; Nishino et al., 2008). In the M4 seamount area, the temperature at the water layers between 0 to 75 m was higher than 28.00 ℃, and the thermocline occurred at the water layer of 75 m. In the Kocebu seamount area, the temperature was below 28.00 ℃ at each layer, and the thermocline occurred at the water layer of 100 m. At the water layer of 200 m, the temperature quickly dropped to 13.34 ℃ in the M4 seamount area, while it was still relatively high at 21.19 ℃ in the Kocebu seamount area (Fig. 3). The salinity at each layer in the Kocebu seamount area was higher than that in the M4 seamount area, and the high-salt area was located at the water layers between 150 to 200 m, while it was at the water layers between 100 to 150 m in the M4 seamount area. Ma et al. (2019a) pointed out that thermocline and high-salt area hindered the upward transport of high- concentration nutrients at the bottom, which was an important reason for the oligotrophic characteristics of upper waters in the study of the Y3 seamount area in the Western Pacific Ocean. Ma et al. (2019b) also found that seasonal changes of North Pacific Tropic Water with high-salt characteristics were the controlling factors leading to differences in nutrients distribution of the Western Pacific Ocean. In this study, the thermocline and the high-salt area in the Kocebu seamount area were deeper than those in the M4 seamount area, which were located in the lower part of the euphotic zone. The thermocline and the high-salt hindered the exchange of nutrients between waters in the euphotic zone and deeper waters, causing the concentrations of NO3-N, PO4-P, and SiO3-Si at the water layers below 100 m in the Kocebu seamount area were generally lower than those in the M4 seamount area.

|
| Fig.3 Vertical distribution of temperature (T), salinity, and Chl-a concentrations in the Kocebu and M4 seamount areas |
Nutrients in seawater are the material basis for the growth of phytoplankton, and the phytoplankton would directly affect the distribution of nutrients (Song, 2010; Song and Yuan, 2017). Due to the high temperature in the upper waters, strong light, and low nutrients concentrations, the Deep Chlorophyll Maximum Layer (DCML) in the Western Pacific Ocean is always located in the subsurface layer, in which the phytoplankton accumulate largely and consume a large amount of nutrients (Bricaud et al., 1995; Li et al., 2016; Zhang et al., 2016). In this study, the DCML in the Kocebu seamount area was deeper and was located at the water layer of 150 m, while that in the M4 seamount area was at the water layer of 100 m (Fig. 3). At the water layers of 150 and 200 m, the Chl-a concentrations in the Kocebu seamount area were 2.8 and 2.2 times as those in the M4 seamount area, respectively, indicating that the Chl-a concentrations in the lower part of the euphotic zone in the Kocebu seamount area was more abundant, which is an important reason for the lower nutrients concentrations in the region. Interestingly, the high- value areas of NO2-N in the two seamount-areas were highly consistent with DCML, which might be caused by the close relationship between NO2-N and phytoplankton metabolism. Zhang et al. (2016) found that NO2-N was the intermediate products of phytoplankton metabolism, and there was strong phytoplankton metabolism to produce a large amount of NO2-N in the DCML. Song (2010) pointed out that as an intermediate product of phytoplankton's absorption and utilization of NO3-N, NO2-N could diffuse into the seawater through the cell membrane, thus leading to the high-value areas overlapping of NO2-N and Chl a. The phytoplankton have an assimilation on NO3-N, and the NO3-N is reverted to NO2-N in the cell, resulting in that the rate of NO2-N escape is proportional to the rate of NO3-N utilizing by phytoplankton. In this study, the NO3-N at the water layer where DCML is located gradually increased, and the phytoplankton actively absorbs NO3-N and releases NO2-N, which is the main reason for the significant increase in NO2-N in this area. Thus, the difference in the distribution of DCML in the two seamount-areas directly caused the high-value areas of NO2-N being located in water layers of 150 and 100 m, respectively.
3.2 Distribution of nutrients in sections of the Kocebu and M4 seamount areasKocebu seamount was a typical deep seamount, and the relationship among temperature, nutrients, and seamount position in the euphotic zone are shown in Fig. 4. In section A, there was an uplift of 25 ℃ isotherm in water layers between 125 and 175 m on stations K-A10, K-A6, K-O, K-A4, and K-A3. Meanwhile, there were similar uplifts of concentrations isolines of NO3-N, PO4-P, and SiO3-Si in water layers between 125 and 200 m in stations K-A8 and K-A2. The concentration of NO2-N exceeded 0.15 μmol/L in water layers between 125 and 175 m in stations K-A9, K-A7, K-A6, K-A5, and K-A3. In section B, there was also an uplift of 25 ℃ isotherm in water layers from 125 to 200 m in stations except for K-B8, K-B4, and K-B1. Meanwhile, there were also similar uplifts of concentrations isolines of NO3-N, PO4-P, and SiO3- Si at the bottom of euphotic zone in stations K-B7, K-O, and K-B2. The concentration isoline of NO2-N exceeded 0.10 μmol/L in water layers between 125 and 175 m in stations except for K-B1.

|
| Fig.4 Distribution of temperature (T) and nutrients in sections A (a, c, e, g, i) and B (b, d, f, h, j) of the Kocebu seamount area |
M4 seamount is a typical shallow seamount, and the relationship among temperature, nutrients, and seamount position in euphotic zone are shown in Fig. 5. The isotherms and nutrients concentrations isolines in the M4 seamount area were sharper than those in the Kocebu seamount area. In section A, there was an uplift of 17.5 ℃ isotherm in water layers between 125 and 175 m in stations M-A6, M-A3, and M-A1, and there was also an uplift of 22.5 ℃ isotherm in water layers between 100 and 125 m in station M-A2. In water layers below 125 m, the nutrient concentration isolines showed consistent uplifts with the isotherms on stations M-A6, M-A3, M-A2, and M-A1. In section B, the isotherms and nutrient concentration isolines showed similar changes, i.e., they were gentle at stations M-B9 and M-B1 far away from the seamounts, while they fluctuated sharply in other stations, among which the sharpest one was in stations M-B8, M-B4, and M-B3. In sections A and B, the NO2-N concentration in water layers about 100 m all exceeded 0.20 μmol/L in stations M-A4, M-A3, M-B7, M-B6, M-B5, and M-B4 near the seamount summit. Meanwhile, there were uplifts of isotherms and concentration isolines of NO3-N, PO4-P, and SiO3-Si in water layers between 25 and 75 m in station M-O above the seamount summit.

|
| Fig.5 Distribution of temperature (T) and nutrients in sections A (a, c, e, g, i) and B (b, d, f, h, j) of the M4 seamount area |
As prominent terrains, seamounts are natural obstacles for ocean current, causing a series of changes in the surrounding hydrological environment, which in turn affect the distribution of nutrients and biological community around seamounts, forming a "seamount effect" (Dower and Mackas, 1996; Genin, 2004; Clark et al., 2010). Isotherm is commonly used to reflect the fluctuation of current, and is a common reference for studying hydrological changes around seamount (Read and Pollard, 2017; Sonnekus et al., 2017). Nutrient concentration isolines frequently caused hydrological changes in the M4 seamount area. Upwelling carried nutrients and other substances upward, which was often indicated by the uplifts of isotherms and isolines of other parameters in the study of seamounts (Genin, 2004; Ma et al., 2019b). In this study, there were similar uplifts of isotherms and nutrients concentrations isolines at the same position in sections A and B of the M4 seamount area, and these uplifts were more obvious in stations near seamount, indicating that there was upwelling near the M4 seamount. However, although there were also uplifts of isotherms and nutrient concentration isolines in the Kocebu seamount area, the positions and amplitudes of them were different, indicating these uplifts might be caused by the short-term fluctuations of the current, and it was difficult to prove the existence of upwelling in the Kocebu seamount area. This result might also be an important reason for much lower concentrations of NO3-N, PO4-P, and SiO3-Si in the lower part of euphotic zone in the Kocebu seamount area than those in the M4 seamount area. de Souza et al. (2013) confirmed that the interaction between seamount and current caused an upwelling in the Fernando de Noronha Chain in the southwest Atlantic, resulting in the uplifts of isotherms and nutrient concentration isolines at the same time. Ma et al. (2019b) also pointed out that consistent changes in isotherms and nutrient concentration isolines around seamount indicated the intense upwelling in this region in the study of three seamounts in the Western Pacific Ocean. The summit of the shallow seamount enters the euphotic zone, which is more likely to produce the "seamount-current" interaction in this region (Genin, 2004; Ma et al., 2018), while the summit of the deep seamount is located at the water layers below 400 m. Even if upwelling occurs near summit of the seamount, it is difficult to rise up to the euphotic zone. In this study, the summit depth of Kocebu seamount is 1 195 m, thus the influence range of the upwelling was limited. In the past studies of seamounts, the phenomena of upwelling and "seamount effect" in euphotic zone were often found in the shallow seamounts such as the Cobb seamount (Dower and Mackas, 1996), the Great Meteor seamount (Mouriño et al., 2001), and the Komahashi No. 2 (Odate and Furuya, 1998); however, they were not found in deep seamounts such as Jasper seamount (Genin, 2004) and Sedlo seamount (Mendonça et al., 2012). It is worth noting that there was a high-value area of NO2-N concentration in the stations near the summit of M4 seamount, indicating that there was an accumulation of phytoplankton near the summit of M4 seamount, forming the "seamount effect" with high biomass. The reasons causing the "seamount effect" have always been controversial (Rowden et al., 2010; Frederick et al., 2018). This result indicates that the "seamount effect" in the M4 seamount might originate from local production, and the upwelling carried the nutrients at the bottom upwards entering the euphotic zone, which promoted the growth and reproduction of phytoplankton around the seamount.
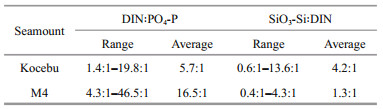
3.3 Distribution of nutrient structure in the Kocebu and M4 seamount areasThe vertical distribution of DIN: PO4-P and SiO3- Si: DIN in the two seamount-areas was quite different. In the Kocebu seamount area, the DIN: PO4-P in each water layer was lower than 10.0:1, and was gradually close to the Redfield ratio (16:1) with the increase of water depth. However, in the M4 seamount area, it increased first and then decreased with the increase of water depth, which was close to the Redfield ratio (16:1) in water layers of 0 and 30 m (Fig. 6). In the Kocebu seamount area, SiO3-Si: DIN in each water layer was greater than 1.0:1, and was close to the Redfield ratio (0.93:1) gradually with the increase of water depth. In the M4 seamount area, it was closer to the Redfield ratio (0.93:1) (Fig. 6). Overall, DIN: PO4-P and SiO3-Si: DIN in the M4 seamount area were closer to the Redfield ratio than those in the Kocebu seamount area, which had average values of 16.5:1 and 1.3:1 in the euphotic zone, respectively (Table 4).

|
| Fig.6 Vertical distribution of DIN: PO4-P (a) and SiO3-Si: DIN (b) in the Kocebu and M4 seamount areas |
|
In the upper waters of oligotrophic ocean, the nitrogen deficiency is common (Falkowski, 1997; Ma et al., 2019b). In this study, there was a significant nitrogen limit in the euphotic zone of the Kocebu seamount area, which was accorded with the general law of upper waters in the oligotrophic ocean, while the nitrogen limit was not significant in the M4 seamount area, even there was a phosphate limit at the water layers of 50 and 75 m. This phenomenon may be caused by the composition of biological community in euphotic zone of the M4 seamount area. There is a complex interaction between nutrients and biological community in the ocean. Distribution and structure of nutrients directly control the composition and structure of biological community, which in turn have an effect on the distribution and structure of nutrients (Song, 2010; Brauer et al., 2012). There are massive plankton that are closely related to nutrients metabolism such as Synechococcus, Prochlorococcus, diatom, and heterotrophic bacteria in the euphotic zone of the ocean. For example, the growth and reproduction of Synechococcus and Prochlorococcus exacerbate the lack of nutrients in the upper waters (Ma et al., 2019a; Zhao et al., 2020). The Diatom could use more SiO3-Si than other phytoplankton in the ocean, causing lower SiO3-Si: DIN in the seawater. When the C: N ratio in the seawater is relatively high, Heterotrophic bacteria can directly absorb nutrients, thereby exacerbating the lack of nutrients and nitrogen in this region (Goldman et al., 1987; Caron, 1994). It is known to us that each seamount is a relatively isolated ecosystem (Clark et al., 2010), Kocebu and M4 seamounts were far away, and the differences in number and composition of these organisms in the two seamount-areas may have an important impact on nutrient structure. These results indicated that huge differences in species of different seamounts affected the nutrient structure to some extent. In addition, it has been confirmed above that the "seamount effect" existed in the M4 seamount, and the "seamount effect" promoted the upwelling of nutrients at the bottom, which might also change the nutrient structure in the upper waters to some extent. In this study, the nutrient structure approached the Redfield ratio at the water layer of 200 m in the two seamount-areas, and the upwelling in the M4 seamount area transported nutrients with stable structure at the bottom upward to affect the nutrient structure in the upper waters. However, there is no report about the relationship between nutrient structure and "seamount effect", and its related mechanism needs further study.
4 CONCLUSIONThe Kocebu seamount was a typical deep seamount, while the M4 seamount was a typical shallow seamount. The distribution characteristics of nutrients in the euphotic zone of the two seamount-areas were controlled by various factors, which not only had similarities, but also had many differences.
The vertical distribution characteristics of nutrients in the two seamount-areas were accorded with the general law of oligotrophic ocean. The concentrations of NO3-N, PO4-P, and SiO3-Si generally increased gradually with the increase of water depth, the concentrations were extremely low at the water layers within 100 m, and the high-value area of NO2-N concentration and the DCML were highly consistent.
Influenced by the distribution of water masses, phytoplankton and upwelling, the concentrations of NO3-N, PO4-P, and SiO3-Si at the water layers below 100 m in the Kocebu seamount area were lower than those in the M4 seamount area, and due to the influence of phytoplankton, the NO2-N mainly distributed at the water layers of 150 and 100 m, respectively. Affected by the "seamount-current" interaction, there was upwelling in the euphotic zone of the M4 seamount area, forming the "seamount effect", while the Kocebu seamount area did not have the "seamount effect". Affected by the composition of the biological community and the "seamount effect", the nitrogen limitation in the M4 seamount area was not significant, and the DIN: PO4-P, and SiO3-Si: DIN were closer to the Redfield ratios, which had a huge difference from the Kocebu seamount area.
5 DATA AVAILABILITY STATEMENTThe datasets generated during the current study are available from the corresponding author on reasonable request.
6 ACKNOWLEDGMENTThe Chl-a data in this study was provided by Professor Xiaoxia SUN of the Institute of Oceanology, Chinese Academy of Sciences. The authors thank the crews in R/V Science for their support in data collection and help in the cruise.
Brauer V S, Stomp M, Huisman J. 2012. The nutrient-load hypothesis: patterns of resource limitation and community structure driven by competition for nutrients and light. The American Naturalist, 179(6): 721-740.
DOI:10.1086/665650 |
Bricaud A, Babin M, Morel A, Claustre H. 1995. Variability in the chlorophyll-specific absorption coefficients of natural phytoplankton: analysis and parameterization. Journal of Geophysical Research: Oceans, 100(C7): 13 321-13 332.
DOI:10.1029/95JC00463 |
Caron D A. 1994. Inorganic nutrients, bacteria, and the microbial loop. Microbial Ecology, 28(2): 295-298.
DOI:10.1007/BF00166820 |
Clark M R, Rowden A A, Schlacher T, Williams A, Consalvey M, Stocks K I, Rogers A D, O'Hara T D, White M, Shank T M, Hall-Spencer J M. 2010. The ecology of seamounts: structure, function, and human impacts. Annual Review of Marine Science, 2: 253-278.
DOI:10.1146/annurev-marine-120308-081109 |
de Souza C S, da Luz J A G, Macedo S, de Jesus Flores Montes M, Mafalda P. 2013. Chlorophyll a and nutrient distribution around seamounts and islands of the tropical south-western Atlantic. Marine and Freshwater Research, 64(2): 168-184.
DOI:10.1071/MF12075 |
Dower J F, Mackas D L. 1996. "Seamount effects" in the zooplankton community near Cobb Seamount. Deep Sea Research Part I: Oceanographic Research Papers, 43(6): 837-858.
DOI:10.1016/0967-0637(96)00040-4 |
Epp D, Smoot N C. 1989. Distribution of seamounts in the North Atlantic. Nature, 337(6204): 254-257.
DOI:10.1038/337254a0 |
Falkowski P G. 1997. Evolution of the nitrogen cycle and its influence on the biological sequestration of CO2 in the ocean. Nature, 387(6630): 272-275.
DOI:10.1038/387272a0 |
Frederick L, Escribano R, Morales C E, Hormazabal S, Medellín-Mora J. 2018. Mesozooplankton respiration and community structure in a seamount region of the eastern south pacific. Deep Sea Research Part I: Oceanographic Research Papers, 135: 74-87.
DOI:10.1016/j.dsr.2018.03.008 |
Genin A. 2004. Bio-physical coupling in the formation of zooplankton and fish aggregations over abrupt topographies. Journal of Marine Systems, 50(1-2): 3-20.
DOI:10.1016/j.jmarsys.2003.10.008 |
Goldman J C, Caron D A, Dennett M R. 1987. Regulation of gross growth efficiency and ammonium regeneration in bacteria by substrate ON ratio. Limnology and Oceanography, 32(6): 1 239-1 252.
DOI:10.4319/lo.1987.32.6.1239 |
Hu D X, Wu L X, Cai W J, Gupta A S, Ganachaud A, Qiu B, Gordon A L, Lin X P, Chen Z H, Hu S J, Wang G J, Wang Q Y, Sprintall J, Qu T D, Kashino Y, Wang F, Kessler W S. 2015. Pacific western boundary currents and their roles in climate. Nature, 522(7556): 299-308.
DOI:10.1038/nature14504 |
Li J L, Sun X X, Zhang W J, Chen Y Y. 2016. Photosynthetic characteristics of phytoplankton in the Western Pacific in winter 2014. Oceanologia et Limnologia Sinica, 47(5): 935-944.
(in Chinese with English abstract) DOI:10.11693/hyhz20160300062 |
Ma J, Song J M, Li X G, Li N, Wang Q D. 2018. Research progress on oceanic seamounts and their eco-environmental characteristics. Marine Sciences, 42(6): 150-160.
(in Chinese with English abstract) DOI:10.11759/hykx20180222001 |
Ma J, Song J M, Li X G, Yuan H M, Li N, Duan L Q, Wang Q D. 2019a. Effects of Y3 seamount on nutrients influencing the ecological environment in the Western Pacific Ocean. Earth Science Frontiers, 27(4): 322-321.
(in Chinese with English abstract) DOI:10.13745/j.esf.sf.2019.8.16 |
Ma J, Song J M, Li X G, Yuan H M, Li N, Duan L Q, Wang Q D. 2019b. Environmental characteristics in three seamount areas of the tropical Western Pacific Ocean: focusing on nutrients. Marine Pollution Bulletin, 143: 163-174.
DOI:10.1016/j.marpolbul.2019.04.045 |
Ma J, Song J M, Li X G, Yuan H M, Li N, Duan L Q, Wang Q D. 2020a. Control factors of DIC in the Y3 seamount waters of the Western Pacific Ocean. Journal of Oceanology and Limnology, 38(4): 1 215-1 224.
DOI:10.1007/s00343-020-9314-3 |
Ma J, Song J M, Li X G, Yuan H M, Li N, Duan L Q, Wang Q D. 2020b. The change of nutrient situation in the Prydz Bay waters along longitude 73°E, Antarctica, in the context of global environmental change. Marine Pollution Bulletin, 154: 111071.
DOI:10.1016/j.marpolbul.2020.111071 |
Mendonça A, Aristegui J, Vilas J C, Montero M F, Ojeda A, Espino M, Martins A M. 2012. Is there a seamount effect on microbial community structure and biomass? the case study of seine and sedlo seamounts (Northeast Atlantic). PLoS One, 7(1): e29526.
DOI:10.1371/journal.pone.0029526 |
Messié M, Radenac M H. 2006. Seasonal variability of the surface chlorophyll in the western tropical pacific from SeaWIFS data. Deep Sea Research Part I: Oceanographic Research Papers, 53(10): 1 581-1 600.
DOI:10.1016/j.dsr.2006.06.007 |
Mouriño B, Fernández E, Serret P, Harbour D, Sinha B, Pingree R. 2001. Variability and seasonality of physical and biological fields at the Great Meteor Tablemount (subtropical NE Atlantic). Oceanologica Acta, 24(2): 167-185.
DOI:10.1016/S0399-1784(00)01138-5 |
National Standard of the People's Republic of China, the National Specification for Oceanographic Survey, GB12763.6-2007.
|
Nishino S, Shimada K, Itoh M, Yamamoto-Kawai M, Chiba S. 2008. East-west differences in water mass, nutrient, and chlorophyll a distributions in the sea ice reduction region of the Western Arctic Ocean. Journal of Geophysical Research: Oceans, 113(C1): C00A01.
DOI:10.1029/2007jc004666 |
Odate T, Furuya K. 1998. Well-developed subsurface chlorophyll maximum near Komahashi No. 2 seamount in the summer of 1991. Deep Sea Research Part I: Oceanographic Research Papers, 45(10): 1 595-1 607.
DOI:10.1016/S0967-0637(98)00031-4 |
Parsons T R, Maita Y, Lalli C M. 1984. Fluorometric determination of chlorophylls. In: Parsons T R, Maita Y, Lalli C M eds. A Manual of Chemical and Biological Methods for Seawater Analysis. Pergamon Press, Oxford. p. 107–109, https://doi.org/10.1016/B978-0-08-030287-4.50034-7.
|
Read J, Pollard R. 2017. An introduction to the physical oceanography of six seamounts in the southwest Indian Ocean. Deep Sea Research Part Ⅱ: Topical Studies in Oceanography, 136: 44-58.
DOI:10.1016/j.dsr2.2015.06.022 |
Rowden A A, Dower J F, Schlacher T A, Consalvey M, Clark M R. 2010. Paradigms in seamount ecology: fact, fiction and future. Marine Ecology, 31(S1): 226-241.
DOI:10.1111/j.1439-0485.2010.00400.x |
Salihoglu B, Garçon V, Oschlies A, Lomas M W. 2008. Influence of nutrient utilization and remineralization stoichiometry on phytoplankton species and carbon export: a modeling study at BATS. Deep Sea Research Part I: Oceanographic Research Papers, 55(1): 73-107.
DOI:10.1016/j.dsr.2007.09.010 |
Song J M, Yuan H M. 2017. Exchange and ecological effects of biogenic elements between Kuroshio and adjacent East China Sea. Oceanologia et Limnologia Sinica, 48(6): 1 169-1 177.
(in Chinese with English abstract) DOI:10.11693/hyhz20170900234 |
Song J M. 2010. Biogeochemical Processes of Biogenic Elements in China Marginal Seas. Zhejiang University Press, Hangzhou. p. 1-62.
|
Sonnekus M J, Bornman T G, Campbell E E. 2017. Phytoplankton and nutrient dynamics of six South West Indian Ocean seamounts. Deep Sea Research Part Ⅱ: Topical Studies in Oceanography, 136: 59-72.
DOI:10.1016/j.dsr2.2016.12.008 |
Sun Y, Sun D Z, Wu L X, Wang F. 2013. Western pacific warm pool and ENSO asymmetry in CMIP3 models. Advances in Atmospheric Sciences, 30(3): 940-953.
DOI:10.1007/s00376-012-2161-1 |
Sylaios G, Koutrakis E, Kallianiotis A. 2006. Hydrographic variability, nutrient distribution and water mass dynamics in Strymonikos Gulf (Northern Greece). Continental Shelf Research, 26(2): 217-235.
DOI:10.1016/j.csr.2005.11.002 |
Toole J M, Zou E, Millard R C. 1988. On the circulation of the upper waters in the western equatorial Pacific Ocean. Deep Sea Research Part A. Oceanographic Research Papers, 35(9): 1 451-1 482.
DOI:10.1016/0198-0149(88)90097-0 |
Xing J W, Song J M, Yuan H M, Li X G, Li N, Duan L Q, Kang X M, Wang Q D. 2017. Fluxes, seasonal patterns and sources of various nutrient species (nitrogen, phosphorus and silicon) in atmospheric wet deposition and their ecological effects on Jiaozhou Bay, North China. Science of the Total Environment, 576: 617-627.
DOI:10.1016/j.scitotenv.2016.10.134 |
Yesson C, Clark M R, Taylor M L, Rogers A D. 2011. The global distribution of seamounts based on 30 arc seconds bathymetry data. Deep Sea Research Part I: Oceanographic Research Papers, 58(4): 442-453.
DOI:10.1016/j.dsr.2011.02.004 |
Zhan R F, Wang Y Q, Wen M. 2013. The SST gradient between the southwestern Pacific and the Western Pacific Warm Pool: a new factor controlling the northwestern Pacific tropical cyclone genesis frequency. Journal of Climate, 26(7): 2 408-2 415.
DOI:10.1175/JCLI-D-12-00798.1 |
Zhang W J, Sun X X, Chen Y Y, Li J L, Du J. 2016. Chlorophyll a concentration and size structure of phytoplankton at Yarp Y3 seamount in tropical west Pacific in winter 2014. Oceanologia et Limnologia Sinica, 47(4): 739-747.
(in Chinese with English abstract) DOI:10.11693/hyhz20160100020 |
Zhao Y C, Zhao Y, Zheng S, Zhao L, Li X G, Zhang W C, Grégori G, Xiao T. 2020. Virioplankton distribution in the tropical western Pacific Ocean in the vicinity of a seamount. Microbiology Open, 9(6): 1 207-1 224.
DOI:10.1002/mbo3.1031 |