 2021, Vol. 39
Institute of Oceanology, Chinese Academy of Sciences
Article Information
- REN Weixiang, WU Xiaodong, GE Xuguang, LIN Guiying, ZHOU Mengdie, LONG Zijie, YU Xinhui, TIAN Wei
- Characteristics of dissolved organic matter in lakes with different eutrophic levels in southeastern Hubei Province, China
- Journal of Oceanology and Limnology, 39(4): 1256-1276
- http://dx.doi.org/10.1007/s00343-020-0102-x
Article History
- Received Feb. 26, 2020
- accepted in principle Apr. 18, 2020
- accepted for publication Aug. 25, 2020


2 Huangshi Key Laboratory of Soil Pollution and Control, Huangshi 435002, China
Dissolved organic matter (DOM) is present in waters as a class of mixtures with highly complex structure and composition (Coble et al., 1998; Liu et al., 2019b). DOM is mainly composed of humic compounds, proteins, carbohydrates, and aromatic compounds (Zhou et al., 2016b; Liu et al., 2020). The chromophoric component (CDOM) is an optical component of DOM, and is one of the important factors influencing the distribution of the underwater light field (Coble, 2007; Zhou et al., 2015; Gerea et al., 2017). DOM can be produced by either microbial secretion or photosynthesis and decomposition of plant material in water, or degradation of terrestrial organic matter that is then transported by runoff (Wang et al., 2007a; Murphy et al., 2008; Zhang et al., 2009). DOM plays a crucial role in the global carbon cycle (Zhang et al., 2010; Zhou et al., 2020). Moreover, its generation, migration, and transformation have a profound influence on the geochemical cycles of elements important as nutrient sources, such as nitrogen and phosphorus, as well as the migration of some heavy metals and organic pollutants (Spencer et al., 2008; Patidar et al., 2015; Wang et al., 2019). Therefore, the study of DOM is of great significance to the management and protection of aquatic environments.
The Changjiang (Yangtze) River basin runs west to east in China and serves as an important economic area. However, most of the lakes in the basin have experienced varying degrees of eutrophication, with intense enrichment of organic matter in the lakes from human activities in recent decades. These have a profound influence on the cycling of materials and energy flow via the lake ecosystem (Zhang et al., 2011). The majority of Hubei Province is located in the middle reaches of the Changjiang River, which covers a dense lake network and plays a pivotal role for the entire basin. Southeastern Hubei possesses the highest lake network density in the province (Compilation Committee for the Records of Lakes in Hubei Province, 2015). The characteristics of DOM in this region have rarely been reported. Therefore, research into the composition and transformation of DOM in the typical lakes in southeastern Hubei significantly helps our understanding of the biogeochemical characteristics of the Changjiang River basin and for the governance of lakes in general.
At present, it is not easy to use only one certain method to the identification of all chemical components of DOM owing to its complex composition (Sharpless and Blough, 2014). Currently, ultraviolet-visible (UV-Vis) absorption spectroscopy and three-dimensional excitation-emission matrix (EEM) spectroscopy are commonly used to acquire information, including the composition and source of DOM. These two methods are considered time-saving, highly efficient, and sensitive (Yu et al., 2015; Song et al., 2019). However, fluorophore signals can overlap in EEM spectra, because of the complex DOM composition. To address this issue, Stedmon et al. (2003) for the first time applied parallel factor analysis (PARAFAC), a mathematical modeling method, to decompose the EEM spectral data and obtain individual fluorescent components. So far, this method has had wide applications in DOM analysis in aquatic environments, such as lakes, reservoirs, and oceans (Stedmon et al., 2003; Zhou et al., 2016a). For example, Zhou et al. (2018) used PARAFAC to perform a comprehensive analysis on the publicly available DOM data worldwide, including 97 lakes and major rivers in China, and the test report of mesoscale climate in a shallow lake. They found that while eutrophication promoted DOM production, climate warming might inhibit the accumulation of endogenous DOM in inland waters. Moreover, Zhu et al. (2020) revealed the general variation patterns in DOM composition and characteristics of six freshwater lakes at different latitudes in northeastern China. In this study, we selected four typical lakes with differing levels of eutrophication in southeastern Hubei to analyze annual characteristics of UV-Vis absorption and EEM fluorescence spectra. We used PARAFAC to separate the fluorescent DOM components and then examined the differences in DOM distribution and sources among the lakes. Understanding the associated characteristics of DOM in lakes with different eutrophic levels can facilitate the development of relevant management and restoration strategies that are more closely targeted to the needs of various types of lakes, which in turn improves efficiency and limits the cost of restoring aquatic ecology. Exploring the associated characteristics of DOM in the water bodies in the study area and comparing them with other studies in the Changjiang River basin also provides a fundamental reference for more comprehensive understanding of this area.
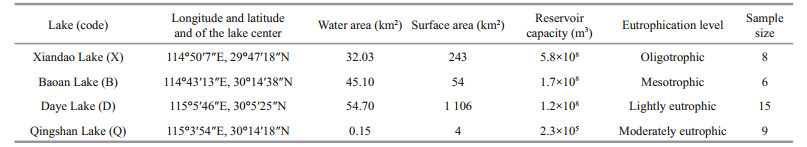
2 MATERIAL AND METHOD 2.1 Study areaThis study selected Xiandao (X), Baoan (B), Daye (D), and Qingshan (Q) lakes in southeastern Hubei Province, China for investigation (Fig. 1). The water volume, surface area, and reservoir capacity of each lake are provided in Table 1 (Compilation Committee for the Records of Lakes in Hubei Province, 2015). The eutrophication levels in these lakes were: X (oligotrophic), B (mesotrophic), D (lightly eutrophic), and Q (moderately eutrophic). X is an alternate source of drinking water for the city of Huangshi, and its water quality has long been maintained at or above the national class Ⅱ water standard. Water flows out of X from its northeastern part and connects to Fushui River, then runs into the Changjiang River through Fushui River. B generally has good water quality, with a small amount of cyanobacteria occurring in parts of the lake in summer. This lake is primarily fed by surface runoff and lake surface precipitation; the major rivers flowing into it are Baoan Eastport, Westport, Huandiqiao Port, and Hejing Port. The water of B passes through Changgang and enters into the Changjiang River through Fankou. To the west of D is the urban area of Daye, so cyanobacteria often bloom in the western part of this lake. The water source of D is mainly precipitation and the eastern part of the lake connects directly to the Changjiang River. Q represents urban eutrophic water, with frequent occurrences of cyanobacterial blooms in summer and autumn. The water in Q originates from the northern foot of Luoshi Mountain and runs into the Changjiang River through Daisiwan Gate. In recent years, with the development of society and cities, the volume of water in Q has been shrinking and is currently divided into five scattered parts.

|
| Fig.1 Location and sampling sites of typical lakes in southeastern Hubei Province, China |
Water samples were collected from each lake in autumn (October 2017), winter (January 2018), spring (April 2018), and summer (July–August 2018). Water depth and Secchi depth (SD) were measured in-situ at the time of water sampling. SD was measured using a 30-cm black-white Secchi disk. Mixed water samples were obtained at 0.5 m below the water surface with a 1.5-L gravitational sampler. All samples were contained in acid-rinsed 2.5-L polyethylene flasks and immediately transported to the laboratory for the analysis of water quality indicators. Aliquots of the samples was filtered and stored. The filtrates were kept at a low temperature (-22 ℃), and DOM optical measurements were completed within a week.
2.3 DOM absorption and fluorescence measurementsWater samples were passed through a 0.45-μm GF/C filter membrane that had been pre-combusted at 550 ℃ for 6 h. The first 20 mL of the filtrate was discarded to prevent organic carbon on the filter membrane from interfering with subsequent measurements. The filtrates were stored in 60-mL polyethylene flasks that had been soaked in diluted nitric acid overnight. A 30-mL aliquot of the filtrates was used for the analysis of dissolved organic carbon (DOC), and the remainder was used to measure DOM absorption and fluorescence.
Absorption spectra of DOM were obtained using a UV-Vis spectrophotometer (UV2700; Shimadzu, Kyoto, Japan). The cuvette had an optical path of 0.01 m. Sample absorbance was scanned over a range of 200–800 nm at an interval of 1 nm, with ultrapure water as a reference. The spectral absorption coefficient is usually calculated using the equation (Wang et al., 2007b):
 (1)
(1)where a(λ') is the uncorrected absorption coefficient at a wavelength of λ (/m); A(λ) is the absorbance at a wavelength of λ (abs); and r is the optical path of the cuvette (m). The filtrate may retain some fine particles, which could affect the absorption measurement. Thus, the absorption coefficient needs to be corrected. Generally, the absorption at 700 nm is used for scattering correction:
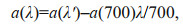 (2)
(2)where a(λ) is the corrected absorption coefficient at a wavelength of λ (/m); and λ is the wavelength (nm). The relative content of DOM is usually approximated by the absorption coefficient at 350 nm, a(350) (Bricaud et al., 1981; Green and Blough, 1994; Keith et al., 2002; Cárdenas et al., 2017).
Study of the spectral slope of the DOM absorption curve is important for the analysis of DOM compositional characteristics and sources (Helms et al., 2008). Here, the spectral slope was calculated through nonlinear regression using the exponential equation proposed by Markager and Vincent (2000). The general formula of fitting model is:
 (3)
(3)where R is the result, y0 is the correction parameter, λ should use 280 nm (S275–295) or 350 nm (S350–400), A is the absorbance at a wavelength of 280 nm (S275–295) or 350 nm (S350–400), abs. The ratio of spectral slopes over 275–295 nm and 350–400 nm, known as spectral slope ratios (SR), can be used to indicate phytoplankton activity and is related to the relative molecular mass of DOM (Markager and Vincent, 2000; Chen et al., 2010). Similarly, S275–295 (i.e., spectral slope of the DOM absorption curve at 275–295 nm) and M (the ratio of DOM absorption coefficients at 250 and 365 nm) are also correlated with the relative molecular mass of DOM. Both S275–295 and M decrease with increasing relative molecular mass of DOM (Helms et al., 2008).
The EEM spectra of DOM were scanned using a fluorescence spectrophotometer (Fluorolog-3; HORIBA, France). The light source was a 450-W xenon lamp, in excitation wavelength range of 250– 450 nm and emission wavelength of 250–580 nm. The slit width was set at 5 nm for diffraction gratings of both excitation and emission monochromators, and a 0.2-s integration time was chosen. Ultrapure water was used as a blank control to eliminate the Raman scattering of water. Raman scanning was performed at an excitation wavelength of 350 nm and emission wavelength of 365–450 nm, at 1-nm intervals (Murphy et al., 2010). Rayleigh scattering correction was performed using an EEM decomposition toolbox, and data errors caused by instrumental differences were corrected manually.
EEM spectra can also be used to calculate other parameters, such as the humification index (HIX), index of recent autochthonous biological activity (BIX), and fluorescence index (FI). HIX is the ratio of integrals of fluorescence over the emission wavelengths of 435–480 nm compared to 300–345 nm, at an excitation of 254 nm, and indicates the degree of DOM humification. It has been shown that HIX values < 4 suggest DOM with weak humification and a dominant endogenous source; when HIX reaches 10, DOM is derived mainly from terrestrial sources. BIX is the ratio of fluorescence intensity at the emission wavelength of 380–430 nm, at an excitation of 310 nm. BIX indicates the proportion of endogenous substances in DOM. Generally, BIX values > 1 suggest a higher contribution of new endogenous substances produced by microbial activity; BIX values of 0.6–0.7 suggest weak autochthonous production of DOM in water. FI is the ratio of fluorescence intensities at emission wavelengths of 470 and 520 nm, at an excitation of 370 nm. FI indicates the origin of humic substances in DOM. Generally, FI values < 1.4 suggest a predominant terrestrial source of DOM; when FI values > 1.9, DOM is derived mainly from the activities of microorganisms and algae (Huguet et al., 2009; Hur et al., 2009; Chen et al., 2010; Wang et al., 2018).
2.4 PARAFAC model constructionPARAFAC is an alternating least-squares method that can effectively analyze the EEM spectra of DOM and separate the DOM components. It has been widely used in the analysis of DOM fluorescence spectra (Stedmon and Markager, 2005; Zhu et al., 2020). The PARAFAC model was constructed using the drEEM and N-way toolboxes for MATLAB (http://www.models.life.ku.dk/). In total, there were 40 excitation wavelengths, 330 emission wavelengths, and 143 sample values in the EEM data matrix. The constructed model was tested by a split-half analysis. In this study, the EEM spectra were decomposed into four components, which yielded six combinations and were subjected to three groups of tests (S4C6T3) (Murphy et al., 2013). After testing, the model explained > 99% of the variables in the original EEM spectra. Additionally, the maximum fluorescence intensity (Fmax) of each component was used to indicate the actual concentration of fluorescent DOM (FDOM) in this component (Zhou et al., 2016a).
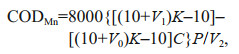
2.5 Measurement of other water quality indicatorsThe DOC concentration was measured using a total organic carbon analyzer (TOC-V CPN; Shimadzu); the standard deviation of the instrument was < 2%. The permanganate index (CODMn) was determined using the acid method CODMn indicates the quantity of organics and a portion of oxygen-consuming inorganics in the water body. One of the methods previously used to measure chemical oxygen demand, CODMn is now often used as an independent indicator. The calculation method is:
 (4)
(4) (5)
(5)where K is correction factor; V is the consumption of KMnO4 solution in secondary titration; V1 is the consumption of KMnO4 solution in the first titration; V2 is the volume of the original water sample; P is concentration of Na2C2O4 solution; C is the proportion of water in the diluted water sample.
Total nitrogen (TN) was determined by the potassium persulfate digestion method. Total phosphorus (TP) and soluble orthophosphate (PO43-) were determined by molybdenum antimony spectrophotometry. Nitrate nitrogen (NO3--N) was determined by UV spectrophotometry and ammonia nitrogen (NH3-N) was determined by Nessler's reagent spectrophotometry. Chlorophyll a (chl a) was determined using the 90% acetone method. All methods have been described in the literature (Editorial Board of Water and Wastewater Monitoring and Analysis Methods and State Environmental Protection Administration of China, 2002).
2.6 Statistical data analysisSampling site maps and spatial distribution interpolation maps were drawn using ArcGIS 10.1 (ESRI Inc., Redlands, CA, USA). PARAFAC analysis of EEM data was performed using MATLAB 2012a (MathWorks Inc., Natick, MA, USA) with the drEEM_010 data package. Means, variances, standard deviations, normality text, t-tests and linear and nonlinear fitting of other data were analyzed using SPSS 21.0 (IBM Corp., Armonk, NY, USA) and Origin 8.5 (OriginLab Corp., Northampton, MA, USA) software programs. In the reporting of significance levels, P < 0.010 indicates highly significant, 0.010 < P < 0.050 indicates significant, and P > 0.050 indicates not significant.
3 RESULT 3.1 Characteristics of water quality indicatorsTable 2 lists the results of SD, CODMn, TN, TP, chl a, and DOC corresponding to seasonal sampling of the lakes. CODMn values in the lakes were ranked as X < B < D < Q. The CODMn in X was significantly lower compared with the other three lakes, while the CODMn in Q was significantly higher (P < 0.010). There were significant differences in TN concentrations only between B and Q (P=0.000). TP concentrations differed significantly between Q and the other lakes (P=0.001), but not among X, B, and D. Chl-a concentrations occurred at significantly lower levels in X and B compared with D and Q (P < 0.010). DOC concentrations in Q were significantly higher than in other lakes (P < 0.010), reaching a maximum of 32.83 mg/L.

With regard to seasonal variation in the lakes, CODMn values did not change significantly in X. However, CODMn values in B and Q were significantly higher in summer than other seasons (P < 0.010). In D, CODMn values were significantly higher in summer and autumn compared with winter and spring (autumn and spring: P=0.017; other comparisons: P < 0.010).
TN concentrations in winter of X were significantly lower than in spring of X (P=0.036), while TN concentrations in winter of B were significantly lower than in summer (P=0.015). Additionally, TN concentrations in both summer and autumn of D were significantly higher than in spring (summer: P=0.048; autumn: P=0.003). In Q, with the exception of spring and autumn, there were significant differences in TN concentrations (P < 0.010). TP concentrations did not differ significantly between various seasons in X and B. However, TP concentrations were significantly higher in winter compared with spring and autumn in D (spring: P=0.001; autumn: P=0.000). In Q, with the exception of summer and winter, there were significant differences in TP concentrations (P=0.048 for spring and autumn; P < 0.010 for the other seasons).
Chl-a concentrations did not differ significantly seasonally in X. However, they were significantly higher in summer of B, reaching a maximum of 55.14 μg/L, compared with other seasons (spring: P=0.000; autumn: P=0.003; winter: P=0.002). In D, there were significant differences in seasonal chl-a concentrations (P < 0.010), ranging from 3.67 to 94.57 μg/L. Additionally, chl-a concentrations in autumn of Q (up to 82.28 μg/L) were significantly higher than in other seasons (spring and winter: P=0.000; summer: P=0.007).
In X, DOC concentrations in spring and summer appeared to be significantly higher than in autumn and winter (P < 0.010). Similar seasonal variations in DOC were found in B (P < 0.010). Moreover, DOC concentrations in spring of D were significantly higher than in the other seasons of this lake (summer: P=0.001; autumn and winter: P=0.000), with a maximum of 19.41 mg/L. DOC concentrations in spring and autumn of Q were significantly lower than in summer and winter (P < 0.010), ranging between 4.56 and 32.83 mg/L.
3.2 UV-Vis spectral parameters and their spatiotemporal distributionsWe found that the SR values in B were significantly lower than in the other lakes (X: P=0.000; D: P=0.008; Q: P=0.003), while the M values in B were significantly higher (P=0.000). No significant differences were found in the SR or M values among the other lakes. The S275–295 values in B were significantly higher than X (P=0.006) and Q (P=0.017), but no significant differences were found compared with D (P=0.118). The a(350) values varied broadly, with a minimum of 0.81/m in autumn of X and a maximum of 13.12/m in summer of Q. The a(350) values in X and B were significantly lower than in D (X: P=0.000; B: P=0.002), while the a(350) values in D appeared to be lower than Q (P=0.026) (Table 2).
In terms of spatial distribution, a(350) gradually increased from north to south in B (Fig. 2i–l). Particularly in winter of B, the a(350) values measured from the northern sampling sites were significantly lower than in the south (P=0.003). In D, the a(350) values were higher in the west than the east (Fig. 2e–h), with the difference especially significant in spring (P=0.005), whereas in Q, the a(350) values were higher in the east than the west in spring (P=0.035; Fig. 2m). In contrast there was seasonal variation in the spatial distribution of a(350) in X with values that gradually increased from east to west across most of the study period (Fig. 2a), while gradual decreases occurred from east to west in winter (Fig. 2d).

|
| Fig.2 Spatial distribution of dissolved organic matter absorption coefficient at 350 nm (a(350)) in typical lakes in southeastern Hubei Province, China |
In D and Q, there was a significant linear correlation between a(350) and chl a (D: R2=0.38, P=0.000; Q: R2=0.14, P=0.027); however, no significant correlation was found in X or B (X: R2=0.00, P=0.815; B: R2=0.02, P=0.473; Fig. 3a). A similar correlation was found between a(350) and SR (X: R2=0.10, P=0.093; B: R2=0.10, P=0.143; D: R2=0.57, P=0.000; Q: R2=0.75, P=0.000; Fig. 3b). Moreover, a(350) was significantly linear negatively correlated with M (X: R2=0.36, P=0.000; B: R2=0.70, P=0.000; D: R2=0.83, P=0.000; Q: R2=0.73, P=0.000) and S275–295 (X: R2=0.35, P=0.001; B: R2=0.39, P=0.001; D: R2=0.41, P=0.000; Q: R2=0.30, P=0.001) in all four lakes.

|
| Fig.3 Mutual correlations between dissolved organic matter absorption coefficient at 350 nm (a(350)) and chl-a concentration (a), spectral slope ratio (SR) (b), the ratio of DOM absorption coefficients at 250 and 365 nm (M) (c), and spectral slope of the DOM absorption curve at 275–295 nm (S275–295) (d) |
The HIX values in X ranged between 0.46 and 3.37 (mean of 1.52±0.99), which were significantly lower than in D (P=0.049), Q (P=0.001), and B (P=0.000). The HIX values in B varied from 0.69 to 3.62 (mean of 2.42±0.90, Fig. 4a). Regarding the temporal distribution, HIX values in X, D, and Q were significantly lower in spring (P < 0.010), while they were significantly higher in autumn (P < 0.010). The trend in D was summer < spring < winter < autumn (P < 0.010). The BIX values in X were the highest, ranging from 0.92 to 1.32 (mean of 1.03±0.13), and significantly higher than in D (P=0.004) and B (P=0.038). The BIX values in D were the lowest, ranging between 0.80 and 1.18 (mean of 0.89±0.07, Fig. 4b). The BIX values did not differ significantly between various seasons in each lake (P > 0.050).

|
| Fig.4 The distribution of humification index (HIX) (a) and index of recent autochthonous biological activity (BIX) values The centerline in each box represents the median, the small square in the middle of the box represents the mean, the upper and lower borders of the box represent the upper and lower quartiles, the short horizontal lines at the ends of the whiskers represent the upper and lower deciles, and the asterisks represent the maximum and minimum values. |
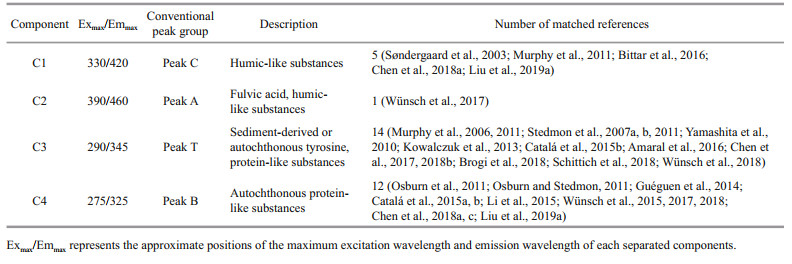
The four FDOM components obtained from PARAFAC were compared with models published in the OpenFluor online database. Only those with a similarity of > 94% between the excitation and emission spectra could be matched (Murphy et al., 2014) (Fig. 5; Table 3). The excitation peak of component 1 (C1) was at ~330 nm and its emission peak was at ~420 nm. The peak of C1 appeared near the humic-like fluorescence peak C in the OpenFluor database (data shown in Table 3 and also from Coble, 1996). This component may be produced autochthonously in the water or as an allochthonous source from the coastal zone, and it is often related to water salinity (Søndergaard et al., 2003; Bittar et al., 2016). Component 2 (C2) had excitation peaks at 270 and 390 nm with an emission peak at 460 nm. The first peak of C2 (270 nm) is near peak A, while the latter peak (390 nm) is not matched to conventional peak values (Table 3). There is a lack of similar studies for this component, but it has been tentatively determined to be fulvic acid and humic-like substances. Component 3 (C3) had an excitation maximum at 290 nm and an emission maximum at 345 nm. The C3 peak is located near peak T with conventional peak values (Table 3). This component is composed mainly of tyrosine and protein-like substances, and is often associated with allochthonous sediment input and autotrophic production; its relative abundance is also influenced by alkaline-phosphatase activity (Yamashita et al., 2010; Chen et al., 2017, 2018b). Component 4 (C4) yielded a characteristic peak at an excitation of 275 nm and an emission of 325 nm, which is similar to conventional peak B (Table 3). This component is composed mainly of protein-like substances and is relatively sensitive to microorganisms.

|
| Fig.5 Fluorescent components separated by the PARAFAC model and split-half analysis The profiles on the left show the shape of the excitation and emission spectra. The graphs on the right correspond to the split-half analysis results for each component. The lines tested in each component almost overlap, indicating that the shapes of the components are quite similar, supporting the fluorescence characteristics. |
|
The Fmax data of FDOM components in the lakes are presented in Fig. 6. The Fmax values of both C1 and C2 were ordered as X < B < D < Q. In particular, the Fmax (C1) in X was significantly lower than in the other lakes (P=0.000), ranging from 0.035 to 0.048 RU (mean of 0.039±0.003 RU). The Fmax (C1) in Q was the highest, ranging from 0.083–0.447 RU (mean of 0.166±0.081 RU), as was the Fmax (C2) (0.049– 0.511 RU, mean of 0.124±0.095 RU), which was significantly higher than in the other lakes (P=0.000). The Fmax (C2) in X was the lowest, varying in the range of 0.019–0.047 (mean of 0.029±0.009 RU). The Fmax (C3) in lake X showed no significant difference compared with B (P=0.136), but was significantly lower than Q and D (Q: P=0.019; D: P=0.033). The range of Fmax (C3) in X was 0.012– 0.028 RU with a mean of 0.014±0.008 RU. The Fmax (C4) in Q showed no significant difference compared with X (P=0.110), but was significantly higher than D and B (D: P=0.036; B: P=0.028). The range of Fmax (C4) in Q was 0.016–0.465 RU with a mean of 0.070±0.033 RU.

|
| Fig.6 Spatial distribution of fluorescent dissolved organic matter components (C1–C4) in Xiandao Lake (a–d), Daye Lake (e–h), and Baoan Lake (i–l), and their seasonal spatial distribution (spring, summer, autumn, winter) in Qingshan Lake (m–p) |
With regard to spatial and temporal (seasonal) variations, there were no distinct differences in the spatial distribution of FDOM components in X. Generally, C2 was high in the west and low in the east (Fig. 6b), while C1, C3, and C4 exhibited an inverse trend (Fig. 6a, c, d). None of the components had obvious seasonal variations (P > 0.050). The spatial variation of these components was relatively uniform in B and D. In B, there was a gradual increase from north to south (Fig. 6i–l); in D, the components gradually increased from east to west (Fig. 6e–h). In both lakes, the components followed a relatively stable trend over time, with no obvious seasonal variation. The distribution of various components in Q was similar in each season, and there were differences among the seasons (Fig. 6m–p). Specifically, high Fmax values in spring were concentrated in the central and northeastern lake areas, which were significantly higher than in other areas (P=0.000). In summer, Fmax exhibited a gradually decreasing trend from west to east, even though the values rebounded in the northeast. The high Fmax values of autumn were concentrated in the southeast where they were significantly higher (P=0.001). In winter, higher Fmax values were mainly found in the central lake area and the southwest (P=0.003), while the northeast, which exhibited high values in other seasons, was a low-value area.
4 DISCUSSION 4.1 Differences in the source of FDOM in southeastern Hubei Province lakesThe different characteristics of four types of FDOM fluorescent chromophores were obtained by the interpretation of DOM in PARAFAC, and some basic characteristics of various components in this study based on the comparison of previous reports have been determined. Accordingly, it is of greater significance to analyze the sources and characteristics of different components. However, the research on DOM fluorescence characteristics of lakes in Southeast Hubei is still under investigation. The analysis of the source characteristics of FDOM in this region will provide effective and detailed data for ecological restoration and FDOM remote sensing inversion. These fluorescent components will be often detected in other areas, providing more comprehensive and accurate characteristics of fluorescent chromophore components, which will contribute to making the later research more accurate, more in-depth, and more efficient. The analysis of the characteristics of the components can also provide a more targeted restoration scheme for lakes damaged by different types.
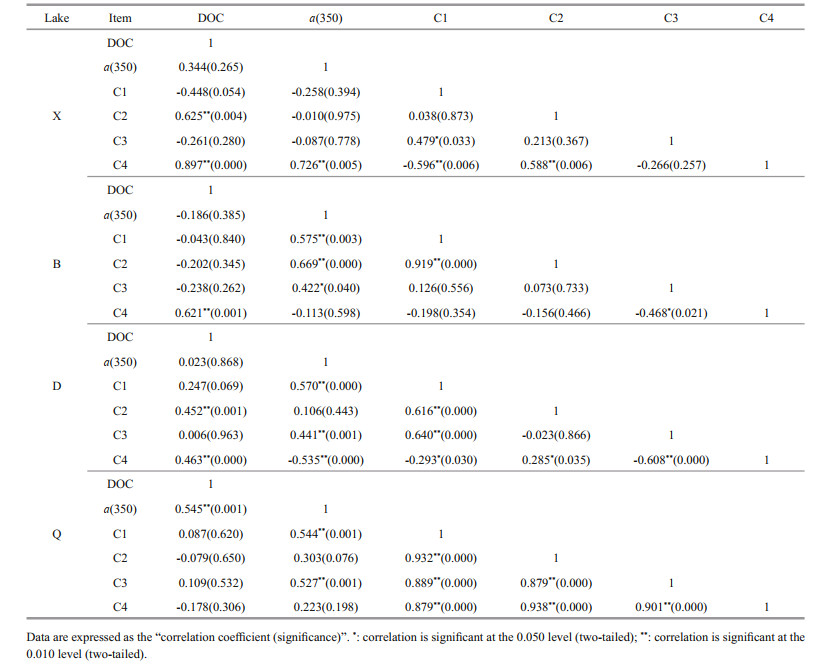
The relationship between DOC and the components of CDOM is shown in Table 4. C1 is more likely to be near-source humic-like substances in areas such as estuaries, while C2 is soil fulvic acid and has often been present for a certain period of time. In the current study, a strong relationship was found between C1 and C2 (R=0.889, P=0.000), both of which made considerable contributions to the absorption coefficient a(350) (C1: R=0.638, P=0.000; C2: R=0.416, P=0.000). This result proves that the sources from which these two components were formed should be relatively close to each other, and that humic-like components are also the main components of FDOM (Yamashita et al., 2010; Bittar et al., 2016; Wünsch et al., 2017). Humic-like C1 and C2 were the major contributors to DOM in lake B, and it has similar origin and impact on B, which is produced autochthonously by microbial metabolism in the water and derived allochthonously from humic substances in the coastal zone (Bittar et al., 2016). Cyanobacteria also reproduced well in B over summer and autumn, which contributed the protein-like C3 in this lake (P=0.035). C3 is considered to comprise protein-like substances, mainly tyrosine, and it exhibits a certain level of hydrophilicity (Xiao et al., 2019). According to the summary by Xiao et al. (2018) and Liu et al. (2011), the fluorescence peak area of C1 is between excitation wavelengths 200 nm and 350 nm with emission wavelengths of 400– 500 nm, and it may be related to moderate pollution intensity. C3 is linked to allochthonous inputs of pollutants and often occurs as a pollution layer on the biofilm surface. On the one hand, this explains the significant correlation between components C1 and C3 (R=0.411, P=0.000), especially in lakes D (R=0.630, P=0.000) and Q (R=0.889, P=0.000) with frequent cyanobacterial blooms and intense exogenous pollution. To the northwest of D and in the surroundings of Q, there were sewage outlets discharging large amounts of domestic and industrial wastewaters. Additionally, C3 made a substantial contribution to C1 and C2 during its transformation process, which is why these humic-like components had relatively high near-source biological characteristics. On the other hand, our investigation showed that C3 had, overall, a high correlation with a(350) (R=0.401, P=0.000), and its fluorescence intensities were significantly higher in lakes D and Q (with frequent cyanobacterial blooms) than in lake X (with no cyanobacterial blooms) (D > X: P=0.011; Q > X: P=0.019). Moreover, other studies have indicated that DOM mainly derived from terrestrial sources has low SR values, while DOM mainly from algal sources has high SR values (Hao et al., 2011; Chen, 2015). Here we found a significant positive correlation between a(350) and SR in lakes D and Q, which had frequent algal blooms (P < 0.01; Fig. 3b). Thus, the pollutant degradation activity by algae microorganisms (including cyanobacteria) was considered to be the primary cause of C3 production (Henderson et al., 2008; Zhang et al., 2013; Chen et al., 2016).
|
C4 also represents protein-like substances, yet its correlation with a(350) was not significant (R=0.007, P=0.938). Additionally, although C4 differed substantially among the lakes in terms of its contribution rate, the differences in fluorescence intensity among the lakes were not evident from a quantitative perspective (only Fmax (C2) < Fmax (C4): P=0.028; Fmax (C3) < Fmax (C4): P=0.036; others, P > 0.110). It seems that the formation of this component had relatively higher independence. In X, C4 was the major contributor to FDOM (P=0.005), and no positive correlations were observed with any other components. This result indicates that DOM in X was dominated by protein-like compounds. Previous studies have shown that protein-like compounds can be produced through biodegradation, especially by microorganisms (Zhang et al., 2013). However, there were almost no algal blooms in X and chl-a concentrations were extremely low in the different seasons (Table 1). Thus, the produce of C4 may be related to the massive submerged plants present at the bottom of the lake. Of the published studies of DOM characteristics in the Changjiang River basin, many have identified components that match C4 in the current study. Those studies were conducted widely throughout the middle and lower reaches of the Changjiang River basin, and included some lakes experiencing profound environmental impacts, such as Chaohu Lake and Taihu Lake (Li et al., 2016; Wang et al., 2016, 2018; Chen et al., 2018a; Liu et al., 2019a). This component is considered to have relatively high biosensitivity and it often occurs as a direct soluble product of microorganisms present in water (Xiao et al., 2018). Chen et al. (2018a) found that the consumption rate of this component was higher in lakes with longer water residence time. In a study conducted in the Changjiang River estuary, Li et al. (2016) also concluded that this component was characterized by relatively rapid biodegradation. Because of this characteristic, the hypothesis that C4 may exist in waterbodies in the Changjiang River basin for a long time cannot be established. This component is more likely to be produced via the metabolic activity of specific microorganisms ubiquitous in the Changjiang River basin. The distribution of these microorganisms is uniform and their contribution to C4 is stable, with no or limited effect resulting from cyanobacterial blooms.
Furthermore, In Q, significant correlations were found between components in each season (P < 0.010), and the distribution of each component was more uniform than in other lakes (Fig. 7). These results might be attributed to the fact that Q is relatively small and has a low reservoir capacity with poor fluidity of the water, but a large amount of sewage is discharged into this lake. This is reflected in the abnormally high-value areas in autumn of Q in the western and southeastern areas (Fig. 6o); all of these areas are associated with dense sewage pipes. Frequent sewage inflow, precipitation process and long-hydraulic retention time accelerate sediment agitation, pore water release and floc degradation (Coble, 1996; Wang et al., 2013; Dong et al., 2014), leading to a complicated mixing process of FDOM in the water column. The protein-like components transformed significantly in this process (C3: P=0.002; C4: P=0.000), while humic-like ones maintained stable. This was in agreement with the findings of Jørgensen et al. (2011) and Li et al. (2015).

|
| Fig.7 Average contributions to total dissolved organic matter fluorescence intensities of the PARAFAC-derived components in typical lakes in southeastern Hubei Province, China |
The biogeochemical characteristics of DOM in lakes have an important impact on their aquatic ecosystems. Through the analysis of a series of indicators, the study of a series of characteristics including humification characteristics, self-production characteristics and photobleaching characteristics can help people understand the basin more systematically and provide theoretical reference for the ecological restoration of the region.
The fluorescence indices HIX and BIX indicate the degree of humification and autotrophic productivity of FDOM in water (Huguet et al., 2009; Yang et al., 2017). Zhang et al. (2010) divided HIX into four levels based on a study of a series of lakes in the Yungui Plateau region, China. These levels were: HIX < 1.5 indicates a biogenic source; 1.5 < HIX < 3 indicates DOM with weak humification characteristics and an important recent autochthonous source; 3 < HIX < 6 indicates DOM with relatively strong humification and weak recent autochthonous characteristics; HIX > 6 indicates strong humification with a high terrestrial contribution. Comparing the seasonal HIX values in various lakes (Fig. 4a), we found that in X an endogenous contribution from biodegradation was dominant in spring, summer, and winter, with some FDOM derived from humic substances in autumn. In general, the FDOM in B and Q was strongly influenced by humic substances. In B, the influence of humic substances was especially prominent in summer and autumn, whereas in Q, endogenous sources were more influential in spring. The FDOM in D was influenced by the input of terrestrial humic substances in most seasons. However, this process was not obvious in summer of D, and there were certain biological characteristics related to the reproduction of Eichhornia crassipes (Mart.) Solms, Potamogeton crispus L., and Cyanobacteria in the central area in summer. In contrast, FDOM in B was characterized by a higher humification degree and aromaticity, with a lower percentage of oxygen-containing functional groups and mineralization rates (Kalbitz et al., 2003).
For BIX, values > 1 indicate a major contribution of FDOM from newly produced endogenous sources whereas BIX < 1 indicates FDOM in water with low biogenic organic matter and limited productivity (Para et al., 2010; Chen et al., 2016). In this study, we found that BIX values exhibited relatively uniform seasonal variations in the different lakes. Among them, X had higher autotrophic productivity.
With increasing M and S275–295 values, the relative molecular mass of DOM and the degree of humification may decrease (Peuravuori and Pihlaja, 1997; Uyguner and Bekbolet, 2005; Li et al., 2016). Here, we found that the DOM absorption coefficient a(350) was negatively correlated with both M and S275–295 in the four lakes (P < 0.002). The relative molecular mass and humification degree of DOM in the lakes were highest in autumn of B, summer of D and Q.
Since DOM and FDOM have different responses to the light environment below water surface, the ratio of FDOM/DOM (Fmax/a(350)) is often used to represent the photobleaching degree of DOM which has been demonstrated to be influenced by numerous factors, such as hydraulic retention time, suspended solids, salinity and turbidity (Li et al., 2015; Stedmon and Nelson, 2015). In this study, there was a significant correlation between photobleaching of humic-like components and the changes of TN and chl a. The photobleaching degree of humic-like components increased gradually with the increase of TN concentration (C1: P=0.016; C2: P=0.001) and the decrease of chl-a concentration (C1: P=0.000; C2: P=0.009), and the photobleaching process between the two components was also very affinity, which was consistent with the intimate source of this two components mentioned above. In contrast, the decrease of CODMn, TP, and chl a facilitated the photobleaching of C4 while had no negligible effects on C3. Although photobleaching is common among lakes, it only accounts for a small part as the fate of FDOM in these four lakes, likewise in the middle and lower reaches of the Changjiang River and the Changjiang River estuary reported by Guo et al. (2007) and Li et al. (2015).
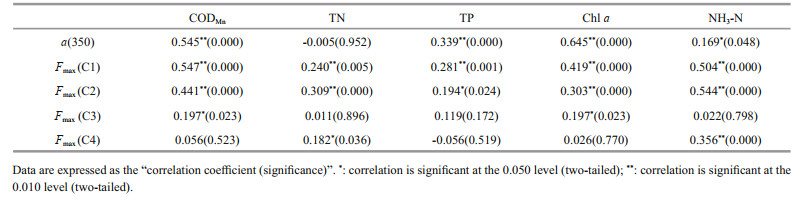
4.3 Responses of DOM and its fluorescent components to eutrophication and seasonal variations in southeastern Hubei lakesGenerally, as the eutrophication level increased, there was an increasing trend in both the absorption coefficient a(350) and the FDOM fluorescence intensity (B < D: P=0.048; D < Q: P=0.041; others, P < 0.008; Fig. 7). This trend is in agreement with the results of current mainstream research (Zhang et al., 2010, 2019; Wang et al., 2018). Specifically, this trend was continued in humic-like components (C1 and C2; P=0.000 in both cases), but it was not significant in protein-like components (C3 and C4; only X < D: P=0.010; X < Q: P=0.003; others, P > 0.100). Correspondingly, humic-like components had good correlations with various eutrophication indicators. Among them, the correlations and significance with CODMn and chl a, which are good representatives of organic matter components in water, were relatively high; the correlations and significance with TN and TP, which indicate nitrogen and phosphorus pollution levels in water, were relatively weak. In contrast, protein-like components had no obvious correlations with these indicators, and only C3 had a weak significant correlation with the organic indicators, including CODMn and chl a (Table 5). On the one hand, this result indicates that the humic-like components from terrestrial inputs and endogenous transformations are a major contributor to the eutrophication of lake water; of course, this process is also related to the input of pollutants. On the other hand, as mentioned above, among the protein-like components identified, C3 is affected mainly by the activity of microorganisms such as algae, while the distribution of C4 is rarely affected by cyanobacterial blooms. Their contribution to the eutrophication process is mainly manifested in the organic matter and productivity indicators such as CODMn and chl a, with C3 being the dominant contributor (Table 5).
|
Previous studies have shown that C3 is closely linked to the change in phosphorus in water (Wang et al., 2016, 2018). However, in the current study, either C3 or all protein-like components had a weak relationship with nitrogen and phosphorus. Nonetheless, C3 had very high correlations with TN in spring (R=0.800, P=0.000) and TP (R=0.698, P=0.000), and these were much higher than the correlations with humic-like components; this phenomenon was not observed in any other seasons. It was clear that, in contrast to the temporal uniformity of the input of terrestrial pollutants, the metabolic activities of microalgae and large aquatic plants are more susceptible to the influence of objective factors including season and weather. In spring, the effect of biological activities on the waterbody is either absent or limited, while the input of nitrogen- or phosphorus-containing pollutants controls the production of C3. In the other seasons, C3 is more closely related to chl a owing to factors such as cyanobacterial blooms in summer and autumn, and the decay and rotting of aquatic organisms in autumn and winter. Moreover, we found that the relationships between humic-like components and the indicators of organic matter and productivity were weak in spring and then gradually strengthened, reaching their highest levels in autumn (C1 vs. CODMn: R=0.879, P=0.000; C1 vs. chl a: R=0.835, P=0.000; C2 vs. CODMn: R=0.807, P=0.000; C2 vs. chl a: R=0.879, P=0.000); thereafter, the relationships were slightly weakened in winter. This trend was also true for changes in the fluorescence intensities of humic-like components, suggesting that spring is the start of the formation of C3 and its transformation into humic-like components. This transformation can reach its highest level in summer and autumn, and then gradually weaken in winter.
From the overall perspective of DOM, DOM had a significant linear correlations with CODMn (R=0.417, P=0.000), TP (R=0.280, P=0.000), and chl a (R=0.497, P=0.000). There were evident responses to CODMn in each season, indicating a relatively uniform contribution of aerobically degraded organic matter to DOM. Other environmental parameters had a more obscure influence on this contribution, and the linear characteristics were significant. With an exception of winter, the seasonal correlation between DOM and chl a was high, especially in D (R=0.747, P=0.000) and Q (R=0.649, P=0.000) where cyanobacteria often bloomed. This exception could be related to the lack of algal blooms in the lakes in winter, because algal reproduction makes a direct contribution to DOM. a significant positive correlation between DOM absorption coefficient and TP concentration has been implicated by a previous study (Zhang et al., 2018), consistent with the results of the present study. However, the relationship between a(350) and PO43- was not significant (P=0.259), indicating an unstable contribution of phosphorus to DOM. Furthermore, It is worth noting that even though DOM lacked a significant linear relationship with TN overall, it showed a good response to TN in each season. These results indicate that the contribution of TN to DOM was influenced substantially by other environmental conditions.
5 CONCLUSIONThis study investigated differences in spatio-temporal DOM characteristics in four typical lakes with different eutrophication levels, X (oligotrophic), B (mesotrophic), D (lightly eutrophic), and Q (moderately eutrophic), in southeastern Hubei Province. Four different fluorescent chromophores were identified, two of which were humic-like components (C1 and C2) and two that were protein-like components (C3 and C4). C3 was mainly produced by the pollutant-degrading activity of microalgae, including cyanobacteria, and this component contributed substantially to C1 and C2 during its transformation. This series of occurrence and transformation processes commenced in spring, boosted in summer and autumn, and then gradually declined. C4 has been widely recognized in the Changjiang River basin and its occurrence was associated with the metabolic activity of specific microorganisms ubiquitous in this river basin. The distribution of these microorganisms and their contribution to C4 were uniform and stable, with no (or limited) effect presented by cyanobacterial blooms and seasonal variation. The mixing effect of lake water made the biological transformation of protein-like components easier. Humic-like components were more susceptible to photodegradation, though the total amount was low. The study on them will be helpful to understand the DOM characteristics, microbial activities, and pollutant transformation laws in the Changjiang River basin.
The overall concentration of DOM and the fluorescence intensity of humic-like components gradually increased as the eutrophication levels of the lakes rose. However, among protein-like components, only C3 had changes along the eutrophication gradient, while the distribution of C4 was not related to the eutrophication level of the lakes. DOM had a strong relationship with phosphorus, but the contribution of phosphorus was unstable. In contrast, DOM was more closely related to CODMn and chl a. FDOM in B showed a higher degree of humification and aromaticity, with a lower percentage of oxygen-containing functional groups and mineralization rates.
6 DATA AVAILABILITY STATEMENTThe datasets generated and/or analyzed during the current study are available from the corresponding author on request.
7 ACKNOWLEDGMENTWe thank Muhua FENG, Fan XUN, and Chuyu LUO for their assistance in sampling.
Amaral V, Graeber D, Calliari D, Alonso C. 2016. Strong linkages between DOM optical properties and main clades of aquatic bacteria. Limnology and Oceanography, 61(3): 906-918.
DOI:10.1002/lno.10258 |
Bittar T B, Berger S A, Birsa L M, Walters T L, Thompson M E, Spencer R G M, Mann E L, Stubbins A, Frischer M E, Brandes J A. 2016. Seasonal dynamics of dissolved, particulate and microbial components of a tidal saltmarsh-dominated estuary under contrasting levels of freshwater discharge. Estuarine, Coastal and Shelf Science, 182: 72-85.
DOI:10.1016/j.ecss.2016.08.046 |
Bricaud A, Morel A, Prieur L. 1981. Absorption by dissolved organic matter of the sea (yellow substance) in the UV and visible domains. Limnology and Oceanography, 26(1): 43-53.
DOI:10.4319/lo.1981.26.1.0043 |
Brogi S R, Ha S Y, Kim K, Derrien M, Lee Y K, Hur J. 2018. Optical and molecular characterization of dissolved organic matter (DOM) in the Arctic Ice Core and the Underlying Seawater (Cambridge Bay, Canada): implication for increased autochthonous DOM during ice melting. Science of the Total Environment, 627: 802-811.
DOI:10.1016/j.scitotenv.2018.01.251 |
Cárdenas C S, Gerea M, Garcia P E, Pérez G L, Diéguez M C, Rapacioli R, Reissig M, Queimaliños C. 2017. Interplay between climate and hydrogeomorphic features and their effect on the seasonal variation of dissolved organic matter in shallow temperate lakes of the Southern Andes (Patagonia, Argentina): a field study based on optical properties. Ecohydrology, 10(7): e1872.
DOI:10.1002/eco.1872 |
Catalá T S, Reche I, Álvarez M, Khatiwala S, Guallart E F, Benítez‐Barrios V M, Fuentes-Lema A, Romera-Castillo C, Nieto-Cid M, Pelejero C, Fraile-Nuez E, Ortega-Retuerta E, Marrasé C, Álvarez‐Salgado X A. 2015a. Water mass age and aging driving chromophoric dissolved organic matter in the dark global ocean. Global Biogeochemical Cycles, 29(7): 917-934.
DOI:10.1002/2014GB005048 |
Catalá T S, Reche I, Fuentes-lema A, Romera-Castillo C, Nieto-Cid M, Ortega-Retuerta E, Calvo E, Álvarez M, Marrasé C, Stedmon C A, Álvarez-Salgado X A. 2015b. Turnover time of fluorescent dissolved organic matter in the dark global ocean. Nature Communications, 6: 5 986.
DOI:10.1038/ncomms6986 |
Chen B F, Feng M H, Shang L X, Ke F, Wu X D, Li Y. 2016. Effects on cyanobacterial growth and water quality after harvesting accumulated cyanobacteria in autumn: an in-situ experiment in Lake Chaohu. Journal of Lake Sciences, 28(2): 253-262.
(in Chinese with English abstract) DOI:10.18307/2016.0203 |
Chen B F, Huang W, Ma S Z, Feng M H, Liu C, Gu X Z, Chen K N. 2018a. Characterization of chromophoric dissolved organic matter in the littoral zones of eutrophic lakes Taihu and Hongze during the algal bloom season. Water, 10(7): 861.
DOI:10.3390/w10070861 |
Chen B F. 2015. Research on Characteristic Variations and the Controll of Contaminants from Accumulative Blue-Green Algae in Lakeshore. Suzhou University of Science and Technology, Suzhou, China. (in Chinese with English abstract)
|
Chen M L, Jung J Y, Lee Y K, Hur J. 2018b. Surface accumulation of low molecular weight dissolved organic matter in surface waters and horizontal off-shelf spreading of nutrients and humic-like fluorescence in the Chukchi Sea of the Arctic Ocean. Science of the Total Environment, 639: 624-632.
DOI:10.1016/j.scitotenv.2018.05.205 |
Chen M L, Kim S H, Jung H J, Hyun J H, Choi J H, Lee H J, Huh I A, Hur J. 2017. Dynamics of dissolved organic matter in riverine sediments affected by weir impoundments: production, benthic flux, and environmental implications. Water Research, 121: 150-161.
DOI:10.1016/j.watres.2017.05.022 |
Chen M L, Park M, Kim J H, Shinn Y J, Lee Y K, Hur J. 2018c. Exploring pore water biogeochemical characteristics as environmental monitoring proxies for a CO2 storage project in Pohang Basin, South Korea. Marine Pollution Bulletin, 137: 331-338.
DOI:10.1016/j.marpolbul.2018.10.036 |
Chen M L, Price R M, Yamashita Y, Jaffé R. 2010. Comparative study of dissolved organic matter from groundwater and surface water in the Florida coastal everglades using multi-dimensional spectrofluorometry combined with multivariate statistics. Applied Geochemistry, 25(6): 872-880.
DOI:10.1016/j.apgeochem.2010.03.005 |
Coble P G, Del Castillo C E, Avril B. 1998. Distribution and optical properties of CDOM in the Arabian Sea during the 1995 Southwest Monsoon. Deep Sea Research Part Ⅱ: Topical Studies in Oceanography, 45(10-11): 2 195-2 223.
DOI:10.1016/S0967-0645(98)00068-X |
Coble P G. 1996. Characterization of marine and terrestrial DOM in seawater using excitation-emission matrix spectroscopy. Marine Chemistry, 51(4): 325-346.
DOI:10.1016/0304-4203(95)00062-3 |
Coble P G. 2007. Marine optical biogeochemistry: the chemistry of ocean color. Cheminform, 38(20): 402-418.
DOI:10.1002/chin.200720265 |
Compilation Committee for the Records of Lakes in Hubei Province. 2015. The Records of Lakes in Hubei Province. Vol. I. Hubei Science & Technology Press, Wuhan, China. 518p. (in Chinese)
|
Dong Q Q, Li P H, Huang Q H, Abdelhafez A A, Chen L. 2014. Occurrence, polarity and bioavailability of dissolved organic matter in the Huangpu River, China. Journal of Environmental Sciences, 26(9): 1 843-1 850.
DOI:10.1016/j.jes.2014.06.020 |
Editorial Board of Water and Wastewater Monitoring and Analysis Methods and State Environmental Protection Administration of China. 2002. Water and Wastewater Monitoring and Analysis Methods. 4th edn. China Environmental Science Press, Beijing, China. 610p. (in Chinese)
|
Gerea M, Pérez G L, Unrein F, Cárdenas C S, Morris D, Queimaliños C. 2017. CDOM and the underwater light climate in two shallow North Patagonian Lakes: evaluating the effects on nano and microphytoplankton community structure. Aquatic Sciences, 79(2): 231-248.
DOI:10.1007/s00027-016-0493-0 |
Green S A, Blough N V. 1994. Optical absorption and fluorescence properties of chromophoric dissolved organic matter in natural waters. Limnology and Oceanography, 39(8): 1 903-1 916.
DOI:10.4319/lo.1994.39.8.1903 |
Guéguen C, Cuss C W, Cassels C J, Carmack E C. 2014. Absorption and fluorescence of dissolved organic matter in the waters of the Canadian Arctic Archipelago, Baffin Bay, and the Labrador Sea. Journal of Geophysical Research: Oceans, 119(3): 2 034-2 047.
DOI:10.1002/2013JC009173 |
Guo W D, Stedmon C A, Han Y C, Wu F, Yu X X, Hu M H. 2007. The conservative and non-conservative behavior of chromophoric dissolved organic matter in Chinese estuarine waters. Marine Chemistry, 107(3): 357-366.
DOI:10.1016/j.marchem.2007.03.006 |
Hao C, Zheng B H, Song Y H, Qin Y W. 2011. Correlation between molecular absorption spectral slope ratios and fluorescence humification indices in characterizing CDOM. Aquatic Sciences, 73(1): 103-112.
DOI:10.1007/s00027-010-0164-5 |
Helms J R, Stubbins A, Ritchie J D, Minor E C, Kieber D J, Mopper K. 2008. Absorption spectral slopes and slope ratios as indicators of molecular weight, source, and photobleaching of chromophoric dissolved organic matter. Limnology and Oceanography, 53(3): 955-969.
DOI:10.4319/lo.2008.53.3.0955 |
Henderson R K, Baker A, Parsons S A, Jefferson B. 2008. Characterisation of algogenic organic matter extracted from cyanobacteria, green algae and diatoms. Water Research, 42(13): 3 435-3 445.
DOI:10.1016/j.watres.2007.10.032 |
Huguet A, Vacher L, Relexans S, Saubusse S, Froidefond J M, Parlanti E. 2009. Properties of fluorescent dissolved organic matter in the Gironde estuary. Organic Geochemistry, 40(6): 706-719.
DOI:10.1016/j.orggeochem.2009.03.002 |
Hur J, Park M H, Schlautman M A. 2009. Microbial transformation of dissolved leaf litter organic matter and its effects on selected organic matter operational descriptors. Environmental Science & Technology, 43(7): 2 315-2 321.
DOI:10.1021/es802773b |
Jørgensen L, Stedmon C A, Kragh T, Markager S, Middelboe M, Søndergaard M. 2011. Global trends in the fluorescence characteristics and distribution of marine dissolved organic matter. Marine Chemistry, 126(1-4): 139-148.
DOI:10.1016/j.marchem.2011.05.002 |
Kalbitz K, Schmerwitz J, Schwesig D, Matzner E. 2003. Biodegradation of soil-derived dissolved organic matter as related to its properties. Geoderma, 113(3-4): 273-291.
DOI:10.1016/S0016-7061(02)00365-8 |
Keith D J, Yoder J A, Freeman S A. 2002. Spatial and temporal distribution of coloured dissolved organic matter (CDOM) in Narragansett Bay, Rhode Island: implications for phytoplankton in coastal waters. Estuarine, Coastal and Shelf Science, 55(5): 705-717.
DOI:10.1006/ecss.2001.0922 |
Kowalczuk P, Tilstone G H, Zabłocka M, Röttgers R, Thomas R. 2013. Composition of dissolved organic matter along an Atlantic meridional transect from fluorescence spectroscopy and parallel factor analysis. Marine Chemistry, 157: 170-184.
DOI:10.1016/j.marchem.2013.10.004 |
Li P H, Chen L, Zhang W, Huang Q H. 2015. Spatiotemporal distribution, sources, and photobleaching imprint of dissolved organic matter in the Yangtze Estuary and its adjacent sea using fluorescence and parallel factor analysis. PLoS One, 10(6): e0130852.
DOI:10.1371/journal.pone.0130852 |
Li S J, Zhang J Q, Mu G Y, Ju H Y, Wang R, Li D J, Shabbir A. 2016. Spatiotemporal characterization of chromophoric dissolved organic matter (CDOM) and CDOM-DOC relationships for highly polluted river. Water, 8(9): 399.
DOI:10.3390/w8090399 |
Liu C, Du Y H, Yin H B, Fan C X, Chen K N, Zhong J C, Gu X Z. 2019a. Exchanges of nitrogen and phosphorus across the sediment-water interface influenced by the external suspended particulate matter and the residual matter after dredging. Environmental Pollution, 246: 207-216.
DOI:10.1016/j.envpol.2018.11.092 |
Liu D, Du Y X, Yu S J, Luo J H, Duan H T. 2020. Human activities determine quantity and composition of dissolved organic matter in lakes along the Yangtze River. Water Research, 168: 115 132.
DOI:10.1016/j.watres.2019.115132 |
Liu T, Chen Z L, Yu W Z, You S J. 2011. Characterization of organic membrane foulants in a submerged membrane bioreactor with pre-ozonation using three-dimensional excitation-emission matrix fluorescence spectroscopy. Water Research, 45(5): 2 111-2 121.
DOI:10.1016/j.watres.2010.12.023 |
Liu Z B, Liang W J, Qin L P, Tang J H. 2019b. Distribution and seasonal variations of chromophoric dissolved organic matter (CDOM) in the Bohai Sea and the North Yellow Sea. Environmental Science, 40(3): 1 198-1 208.
(in Chinese with English abstract) |
Markager S, Vincent W F. 2000. Spectral light attenuation and the absorption of UV and blue light in natural waters. Limnology and Oceanography, 45(3): 642-650.
DOI:10.4319/lo.2000.45.3.0642 |
Murphy K R, Butler K D, Spencer R G M, Stedmon C A, Boehme J R, Aiken G R. 2010. Measurement of dissolved organic matter fluorescence in aquatic environments: an interlaboratory comparison. Environmental Science & Technology, 44(24): 9 405-9 412.
DOI:10.1021/es102362t |
Murphy K R, Hambly A, Singh S, Henderson R K, Baker A, Stuetz R, Khan S J. 2011. Organic matter fluorescence in municipal water recycling schemes: toward a unified PARAFAC model. Environmental Science & Technology, 45(7): 2 909-2 916.
DOI:10.1021/es103015e |
Murphy K R, Ruiz G M, Dunsmuir W T M, Waite T D. 2006. Optimized parameters for fluorescence-based verification of ballast water exchange by ships. Environmental Science & Technology, 40(7): 2 357-2 362.
DOI:10.1021/es0519381 |
Murphy K R, Stedmon C A, Graeber D, Bro R. 2013. Fluorescence spectroscopy and multi-way techniques. PARAFAC. Analytical Methods, 5(23): 6 557-6 566.
DOI:10.1039/c3ay41160e |
Murphy K R, Stedmon C A, Waite T D, Ruiz G M. 2008. Distinguishing between terrestrial and autochthonous organic matter sources in marine environments using fluorescence spectroscopy. Marine Chemistry, 108(1-2): 40-58.
DOI:10.1016/j.marchem.2007.10.003 |
Murphy K R, Stedmon C A, Wenig P, Bro R. 2014. Openfluor-an online spectral library of auto-fluorescence by organic compounds in the environment. Analytical Methods, 6(3): 658-661.
DOI:10.1039/C3AY41935E |
Osburn C L, Stedmon C A. 2011. Linking the chemical and optical properties of dissolved organic matter in the Baltic-North Sea transition zone to differentiate three allochthonous inputs. Marine Chemistry, 126(1-4): 281-294.
DOI:10.1016/j.marchem.2011.06.007 |
Osburn C L, Wigdahl C R, Fritz S C, Saros J E. 2011. Dissolved organic matter composition and photoreactivity in prairie lakes of the U.S. Great Plains. Limnology and Oceanography, 56(6): 2 371-2 390.
DOI:10.4319/lo.2011.56.6.2371 |
Para J, Coble P G, Charrière B, Tedetti M, Fontana C, Sempéré R. 2010. Fluorescence and absorption properties of chromophoric dissolved organic matter (CDOM) in coastal surface waters of the northwestern Mediterranean Sea, influence of the Rhône River. Biogeosciences, 7(12): 4 083-4 103.
DOI:10.5194/bgd-7-5675-2010 |
Patidar S K, Chokshi K, George B, Bhattacharya S, Mishra S. 2015. Dominance of cyanobacterial and cryptophytic assemblage correlated to CDOM at heavy metal contamination sites of Gujarat, India. Environmental Monitoring and Assessment, 187(1): 4 118.
DOI:10.1007/s10661-014-4118-6 |
Peuravuori J, Pihlaja K. 1997. Molecular size distribution and spectroscopic properties of aquatic humic substances. Analytica Chimica Acta, 337(2): 133-149.
DOI:10.1016/S0003-2670(96)00412-6 |
Schittich A R, Wünsch U J, Kulkarni H V, Battistel M, Bregnhøj H, Stedmon C A, McKnight U S. 2018. Investigating fluorescent organic-matter composition as a key predictor for arsenic mobility in groundwater aquifers. Environmental Science & Technology, 52(22): 13 027-13 036.
DOI:10.1021/acs.est.8b04070 |
Sharpless C M, Blough N V. 2014. The importance of charge-transfer interactions in determining chromophoric dissolved organic matter (CDOM) optical and photochemical properties. Environmental Science: Processes & Impacts, 16(4): 654-671.
DOI:10.1039/C3EM00573A |
Søndergaard M, Stedmon C A, Borch N H. 2003. Fate of terrigenous dissolved organic matter (DOM) in estuaries: aggregation and bioavailability. Ophelia, 57(3): 161-176.
DOI:10.1080/00785236.2003.10409512 |
Song K S, Shang Y X, Wen Z D, Jacinthe P A, Liu G, Lyu L L, Fang C. 2019. Characterization of cdom in saline and freshwater lakes across China using spectroscopic analysis. Water Research, 150: 403-417.
DOI:10.1016/j.watres.2018.12.004 |
Spencer R G M, Aiken G R, Wickland K P, Striegl R G, Hernes P J. 2008. Seasonal and spatial variability in dissolved organic matter quantity and composition from the Yukon River Basin, Alaska. Global Biogeochemical Cycles, 22(4): GB4002.
DOI:10.1029/2008GB003231 |
Stedmon C A, Markager S, Bro R. 2003. Tracing dissolved organic matter in aquatic environments using a new approach to fluorescence spectroscopy. Marine Chemistry, 82(3-4): 239-254.
DOI:10.1016/S0304-4203(03)00072-0 |
Stedmon C A, Markager S, Tranvik L, Kronberg L, Kronberg L, Slätis T, Martinsen W. 2007a. Photochemical production of ammonium and transformation of dissolved organic matter in the Baltic Sea. Marine Chemistry, 104(3-4): 227-240.
DOI:10.1016/j.marchem.2006.11.005 |
Stedmon C A, Markager S. 2005. Resolving the variability in dissolved organic matter fluorescence in a temperate estuary and its catchment using PARAFAC analysis. Limnology and Oceanography, 50(2): 686-697.
DOI:10.4319/lo.2005.50.2.0686 |
Stedmon C A, Nelson N B. 2015. The optical properties of DOM in the ocean. In: Hansel D A, Carlson C A eds. Biogeochemistry of Marine Dissolved Organic Matter. 2nd edn. Academic Press, Boston, America. p. 481-508.
|
Stedmon C A, Thomas D N, Granskog M, Kaartokallio H, Papadimitriou S, Kuosa H. 2007b. Characteristics of dissolved organic matter in Baltic Coastal Sea Ice: allochthonous or autochthonous origins?. Environmental Science & Technology, 41(21): 7 273-7 279.
DOI:10.1021/es071210f |
Stedmon C A, Thomas D N, Papadimitriou S, Granskog M A, Dieckmann G S. 2011. Using fluorescence to characterize dissolved organic matter in Antarctic Sea Ice Brines. Journal of Geophysical Research: Biogeosciences, 116(G3): G03027.
DOI:10.1029/2011JG001716 |
Uyguner C S, Bekbolet M. 2005. Implementation of spectroscopic parameters for practical monitoring of natural organic matter. Desalination, 176(1-3): 47-55.
DOI:10.1016/j.desal.2004.10.027 |
Wang Q, Pan J Z, Wu X D, Ma S Z, Chen B F. 2018. Feature distribution and source analysis of chromophoric dissolved organic matter of lake wetlands in Taihu Lake basin. Jiangsu Agricultural Sciences, 46(21): 279-285.
(in Chinese) |
Wang S H, Wang W W, Jiang X, Zhao L, Zhang B. 2016. Distribution of chromophoric dissolved organic matter in Lihu Lake using excitation-emission matrix fluorescence and parallel factor analysis. China Environmental Science, 36(2): 517-524.
(in Chinese with English abstract) |
Wang X C, Litz L, Chen R F, Huang W, Feng P, Altabet M A. 2007a. Release of dissolved organic matter during oxic and anoxic decomposition of salt marsh cordgrass. Marine Chemistry, 105(3-4): 309-321.
DOI:10.1016/j.marchem.2007.03.005 |
Wang X N, Wu Y, Bao H Y, Gan S C, Zhang J. 2019. Sources, transport, and transformation of dissolved organic matter in a large river system: Illustrated by the Changjiang River, China. Journal of Geophysical Research: Biogeosciences, 124(12): 3 881-3 901.
DOI:10.1029/2018JG004986 |
Wang X, Zhang Y L, Zhao Q H. 2007b. On spectral absorption coefficients measurement methods of pure water, CDOM, total particulates, phytoplankton and nonalgal particulates. Journal of Safety and Environment, 7(4): 97-102.
(in Chinese with English abstract) |
Wang Y, Zhang D, Shen Z Y, Feng C H, Chen J. 2013. Revealing sources and distribution changes of dissolved organic matter (DOM) in pore water of sediment from the Yangtze Estuary. PLoS One, 8(10): e76633.
DOI:10.1371/journal.pone.0076633 |
Wünsch U J, Geuer J K, Lechtenfeld O J, Koch B P, Murphy K R, Stedmon C A. 2018. Quantifying the impact of solid-phase extraction on chromophoric dissolved organic matter composition. Marine Chemistry, 207: 33-41.
DOI:10.1016/j.marchem.2018.08.010 |
Wünsch U J, Murphy K R, Stedmon C A. 2015. Fluorescence quantum yields of natural organic matter and organic compounds: implications for the fluorescence-based interpretation of organic matter composition. Frontiers in Marine Science, 2: 98.
DOI:10.3389/fmars.2015.00098 |
Wünsch U J, Murphy K R, Stedmon C A. 2017. The one-sample PARAFAC approach reveals molecular size distributions of fluorescent components in dissolved organic matter. Environmental Science & Technology, 51(20): 11 900-11 908.
DOI:10.1021/acs.est.7b03260 |
Xiao K, Han B J, Sun J Y, Tan J H, Yu J L, Liang S, Shen Y X, Huang X. 2019. Stokes shift and specific fluorescence as potential indicators of organic matter hydrophobicity and molecular weight in membrane bioreactors. Environmental Science & Technology, 53(15): 8 985-8 993.
DOI:10.1021/acs.est.9b02114 |
Xiao K, Liang S, Xiao A H, Lei T, Tan J H, Wang X M, Huang X. 2018. Fluorescence quotient of excitation-emission matrices as a potential indicator of organic matter behavior in membrane bioreactors. Environmental Science: Water Research & Technology, 4(2): 281-290.
DOI:10.1039/C7EW00270J |
Yamashita Y, Scinto L J, Maie N, Jaffé R. 2010. Dissolved organic matter characteristics across a subtropical wetland's landscape: application of optical properties in the assessment of environmental dynamics. Ecosystems, 13(7): 1 006-1 019.
DOI:10.1007/s10021-010-9370-1 |
Yang L Y, Zhuang W E, Chen C T A, Wang B J, Kuo F W. 2017. Unveiling the transformation and bioavailability of dissolved organic matter in contrasting hydrothermal vents using fluorescence EEM-PARAFAC. Water Research, 111: 195-203.
DOI:10.1016/j.watres.2017.01.001 |
Yu H R, Liang H, Qu F S, Han Z S, Shao S L, Chang H Q, Li G B. 2015. Impact of dataset diversity on accuracy and sensitivity of parallel factor analysis model of dissolved organic matter fluorescence excitation-emission matrix. Scientific Reports, 5: 10 207.
DOI:10.1038/srep10207 |
Zhang H, Cui K P, Zhang Q, Ou X, Dong X B, Wu C G. 2019. Spectral analysis and source analysis of dissolved organic matter in Pai River. Research of Environmental Sciences, 32(2): 227-234.
(in Chinese with English abstract) |
Zhang Y L, Liu X H, Wang M Z, Qin B Q. 2013. Compositional differences of chromophoric dissolved organic matter derived from phytoplankton and macrophytes. Organic Geochemistry, 55: 26-37.
DOI:10.1016/j.orggeochem.2012.11.007 |
Zhang Y L, Van Dijk M A, Liu M L, Zhu G W, Qin B Q. 2009. The contribution of phytoplankton degradation to chromophoric dissolved organic matter (CDOM) in eutrophic shallow lakes: field and experimental evidence. Water Research, 43(18): 4 685-4 697.
DOI:10.1016/j.watres.2009.07.024 |
Zhang Y L, Yin Y, Liu X H, Shi Z Q, Feng L Q, Liu M L, Zhu G W, Gong Z J, Qin B Q. 2011. Spatial-seasonal dynamics of chromophoric dissolved organic matter in Lake Taihu, a large eutrophic, shallow lake in China. Organic Geochemistry, 42(5): 510-519.
DOI:10.1016/j.orggeochem.2011.03.007 |
Zhang Y L, Zhang E L, Yin Y, van Dijk M A, Feng L Q, Shi Z Q, Liu M L. 2010. Characteristics and sources of chromophoric dissolved organic matter in lakes of the Yungui Plateau, China, differing in trophic state and altitude. Limnology and Oceanography, 55(6): 2 645-2 659.
DOI:10.4319/lo.2010.55.6.2645 |
Zhang Y L, Zhou Y Q, Shi K, Qin B Q, Yao X L, Zhang Y B. 2018. Optical properties and composition changes in chromophoric dissolved organic matter along trophic gradients: implications for monitoring and assessing lake eutrophication. Water Research, 131: 255-263.
DOI:10.1016/j.watres.2017.12.051 |
Zhou L, Zhou Y Q, Yao X L, Cai J, Liu X, Tang X M, Zhang Y L, Jang K S, Jeppesen E. 2020. Decreasing diversity of rare bacterial subcommunities relates to dissolved organic matter along permafrost thawing gradients. Environment International, 134: 105 330.
DOI:10.1016/j.envint.2019.105330 |
Zhou Y Q, Davidson T A, Yao X L, Zhang Y L, Jeppesen E, De Souza J G, Wu H W, Shi K, Qin B Q. 2018. How autochthonous dissolved organic matter responds to eutrophication and climate warming: evidence from a cross-continental data analysis and experiments. Earth-science Reviews, 185: 928-937.
DOI:10.1016/j.earscirev.2018.08.013 |
Zhou Y Q, Zhang Y L, Jeppesen E, Murphy K R, Shi K, Liu M L, Liu X H, Zhu G W. 2016a. Inflow rate-driven changes in the composition and dynamics of chromophoric dissolved organic matter in a large drinking water lake. Water Research, 100: 211-221.
DOI:10.1016/j.watres.2016.05.021 |
Zhou Y Q, Zhang Y L, Shi K, Niu C, Liu X H, Duan H T. 2015. Lake Taihu, a large, shallow and eutrophic aquatic ecosystem in China serves as a sink for chromophoric dissolved organic matter. Journal of Great Lakes Research, 41(2): 597-606.
DOI:10.1016/j.jglr.2015.03.027 |
Zhou Z Z, Guo L D, Minor E C. 2016b. Characterization of bulk and chromophoric dissolved organic matter in the Laurentian Great Lakes during summer 2013. Journal of Great Lakes Research, 42(4): 789-801.
DOI:10.1016/j.jglr.2016.04.006 |
Zhu L J, Zhao Y, Bai S C, Zhou H X, Chen X M, Wei Z M. 2020. New insights into the variation of dissolved organic matter components in different latitudinal lakes of northeast China. Limnology and Oceanography, 65(3): 471-481.
DOI:10.1002/lno.11316 |