 2021, Vol. 39
Institute of Oceanology, Chinese Academy of Sciences
Article Information
- CHEN Baiyu, KOU Yi, WU Fang, WANG Liping, LIU Guilin
- Study on evaluation standard of uncertainty of design wave height calculation model
- Journal of Oceanology and Limnology, 39(4): 1188-1197
- http://dx.doi.org/10.1007/s00343-020-0327-8
Article History
- Received Aug. 24, 2020
- accepted in principle Sep. 27, 2020
- accepted for publication Oct. 26, 2020


2 Dornsife College, University of Southern California, Los Angeles 90007, USA;
3 Statistics and Applied Probability, University of California Santa Barbara, Santa Barbara 93106, USA;
4 School of Mathematical Sciences, Ocean University of China, Qingdao 266071, China;
5 College of Engineering, Ocean University of China, Qingdao 266071, China
The calculation of marine environmental design parameters has important applications in marine engineering and coastal disaster prevention. The design and construction of marine engineering, the prediction and the early warning of marine disasters all need to calculate the precise recurrence of multiple-year level disasters. The statistical analysis is inseparable from the probability distribution pattern that matches the actual problem and is necessary to accurately calculate the design parameters of the marine environment. In the past, the selection of design parameter estimation models under marine environmental conditions is a mostly human biased process. The commonly used methods include probability paper and suitable line method. Although the measured data in the same group of marine environments can be tested by hypothesis, the calculated results are different in values. More often than not, it is uncertain that which set of calculation results can be used as the design standard, despite its determination has very important practical engineering significance.
The accuracy of the marine environment design parameter estimation is closely related to the distribution function used to study the statistical characteristics of the measured data, and the current research on the marine environment design parameter estimation model worldwide mainly focuses on the determination of the parameters within the model. In fact, this research work is only one side of the uncertainty research of the marine environment parameter estimation model. The uncertainty of the design parameter estimation model under the marine environment will bring uncertainty to the overall estimation results due to the uncertainty of the parameters to be determined by the model and the data sampling threshold. Thus, it affects the design and construction of marine engineering. Therefore, it is necessary to study the uncertainty of the return level for the model projection, find a suitable measure to evaluate the uncertainty of the model, and then find a distribution model structure that can reflect the statistical characteristics of the elements for the marine environment more realistically.
At present, there are relatively few studies on the overall uncertainty evaluation standards of the theoretical model for the marine environment design parameters, and the existing studies mainly focus on the improvement of different theoretical models with the study of the parameters determined in the theoretical model. It is well known that uncertainty can be thought of as the degree of uncertainty for the true value, encompassing some range of the true value in its manifestation, in order to characterize the dispersion reasonably assigned to the measured value (Deng et al., 2019; Liu et al., 2019d; Nabipour et al., 2020). Generally, we will expand the scope of the model and improve the parameter estimation and prediction accuracy of the model that has been seen applied in many various modeling fields such as electronic engineering, computational problems (Chen et al., 2017a, 2019a, b, 2020), and biological structures refinement (Wang et al., 2013, 2016, 2017; Liu et al., 2019a). The larger the uncertainty range, the greater the uncertainty of the data. The refinement generally includes the observation error and the random error, etc. For the same set of data, if the same model is selected, different sampling will bring distinctive uncertainty.
The uncertainty in the choice of the distribution model must be taken carefully in the process of design parameter extrapolation, and additionally, data instability, parameter estimation error, and others will bring internal uncertainty. This part of the uncertainty has often been overlooked in previous statistical analyses, and in fact these should be considered in the analysis of overall system uncertainty (Zeng et al., 2018; Liu et al., 2020a, b).
Based on information entropy, this paper analyzes the data volatility, dispersion degree, sampling error of sample data, and the instability of the overall calculation results caused by the errors from parameter estimation, etc., can construct an evaluation criterion for the overall uncertainty of the distribution model. And the study of the overall uncertainty of different models of the same measured data can be made under this criterion. The study of these theoretical contents will provide new criteria and basis for the selection and evaluation of models.
2 STUDY ON CRITERIA OF UNCERTAINTY EVALUATIONInformation entropy is a measure of the uncertainty of a random event and the amount of information and represents the overall information measure of a source in the sense of average. The higher the degree of disorder, the higher the information entropy. The amount of uncertainty and the amount of information can be expressed by the amount of uncertainty that is eliminated, and the magnitude of the uncertainty of the random event can be described by a probability distribution function.
Definition For a random event A, let's assume it has n independent possible outcomes: a1, a2, …, an, the probabilities of the outcomes are: p1, p2, …, pn, and they satisfy the condition: 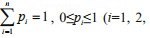


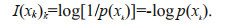 (1)
(1)The information entropy of a random variable X (herein referred to as entropy) is defined as the mathematical expectation of a random variable I(X) in probability space:
 (2)
(2)Recorded as H(X). It is a measure of the uncertainty of the system describing the probability, that is, our measure of the "unknown" of the probability structure of the system.
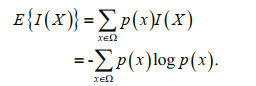
Lemma For a discrete system of n events with information entropy Hn it can be expressed as:
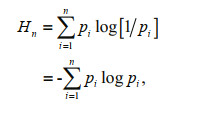 (3)
(3)where pi is the probability of an event i occurring and 
Proof The theoretical distribution model can be abstracted by the information entropy with the specific corresponding events. The following is to take the number of typhoons as an example for derivation:
Suppose the number of typhoons occurring in a station every year is i=0, 1, 2, ∙∙∙, and the total number of typhoons occurring in the station in n year is N. Then, the total number of years during which there are i typhoons is ni, and the frequency of occurring i typhons in every year during n years is ni/n. The satisfying conditions of the occurrence of typhoons are 

Assuming that typhoons occur i times in n years, each macro state marked by (n1, …,
ni,
…) is composed of 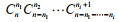
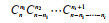
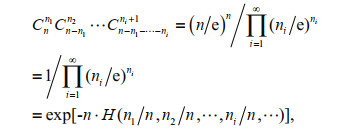 (4)
(4)where 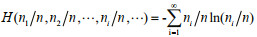
Denote ni/n=p as the frequency of occurring i typhons in every year during n years, therefore,

Namely, 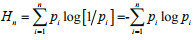
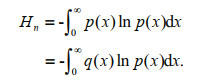
If the event of the system can be described by a continuous random variable X, the information entropy Hn is:
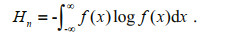 (5)
(5)Among them f (x) is the probability density function of X. The natural logarithm is used as the unit of calculation for entropy.
It can be seen from Eqs.3 & 5 that information entropy is actually a function of the distribution of random variable X. It does not depend on the actual value, but only depends on its probability distribution. It can be said that each probability distribution corresponds to a unique information entropy value, and each distribution function corresponds to a unique information entropy value.
Information entropy is a representation of uncertainty. When the probability of all information appearing equal, we cannot judge which message will appear. At this time, we have the greatest uncertainty about the whole system. Thus, at this time, the information entropy takes the maximum value. On the contrary, if we know that something is an inevitable event and its probability of occurrence is 1, then the probability of other events occurring is 0. Thus, at this moment, our uncertainty about the whole system is the smallest, and the information entropy takes the minimum. From this point of view, the event equal probability takes the largest entropy, and the entropy takes zero value when the event is determined. This indicates that the information entropy is completely correct as a representation of uncertainty, that is, the information entropy is the appropriate measure function of uncertainty. Literature (Chen et al., 2017a) further points out the specific link between information entropy and uncertainty:
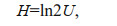 (6)
(6)where H represents information entropy and U represents uncertainty. Equation 6 provides a new method for calculating uncertainty by information entropy. When the uncertainty analysis needs to be performed on the object, to some extent, only the information entropy needs to be studied to reflect the uncertainty of the research object.
At present, the research on the uncertainty of the system model is often limited to determine which type of distribution model is more suitable for the research problem. In fact, the applicability of the model is related to many inputs, such as the number of data samples, the degree of dispersion, and the estimation of model parameters, the sampling error of the quantity, etc. If the uncertainty contained in the information is taken into account in the overall uncertainty of the model, the overall uncertainty thus obtained is more true, accurate, and comprehensive.
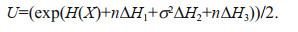
This paper connects the main aspects of the number of data, the degree of dispersion, the sampling error of estimator, to uncertainty through the application of information entropy and gives the formula for estimating the information entropy of the model:
 (7)
(7)In the formula, H(X) is the information entropy of the estimation model itself, n is the number of sample data, σ2 represents the variance of the sample, and ∆H1, ∆H2, and ∆H3 represent the change of the information entropy when the number, variance, and error are changed by one unit respectively.
When conducting uncertainty studies, if it is possible to replace the random variables in previous studies with a family of random variables and add a time perspective on a spatial basis, then it is possible to discuss the uncertainty over different periods and the probability of this uncertainty influencing the future uncertainty.
2.1 Study of data sample capacity on model stabilityConsidering the sample size for the study of model uncertainty, is to consider the change of the uncertainty of the model when the number of samples increases or decreases. When the number of samples increases, the information contained in them increases correspondingly, and thus the entropy as the information metric also shows an upward trend. It is difficult to directly find the increase of entropy in relation to the number of samples. Under the given constraints, the distribution with the largest uncertainty is selected as the distribution of random variables. Therefore, the distribution of the maximum entropy is the most random distribution from the perspective of its uncertainty (Chen et al., 2017b; Deng et al., 2020). The principle of extremum and maximum entropy of entropy tells us that there is always a distribution that maximizes the information entropy in the sample distribution (Liu et al., 2019b, 2020). More often it considers the difference between the entropy of the corresponding distribution and the maximum entropy distribution, if this difference decreases as the sample number increases, then, vice versa, the entropy of the corresponding distribution increases as the number of samples increases.
Let the continuous random variable X reach the maximum entropy Hp when the probability density function is p(x), and the entropy is Hq when the probability density function is q(x) other than p(x), then the difference between the two entropies Hp-Hq can represent the information difference between the two types of density functions, that is, the information change difference. p(x) is the probability density function at the maximum entropy, which is called the maximum entropy density function.
Theorem Let the continuous random variable X(x1, x2, ∙∙∙, xn) reach the maximum entropy Hp when the probability density function is p(x), and the entropy is Hq when any probability density function other than p(x) is q(x), then the information difference change is:
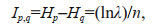 (8)
(8)where n is the number of samples for continuous random variables, λ is the ratio of the likelihood function between q(x) and the maximum entropy density function p(x).
To prove the above theorem, the following lemma is first introduced.
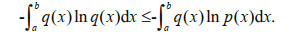
Lemma Under the same constraint condition, let p(x) be the probability density function that maximizes the entropy value Hn, q(x) is the probability density function that also satisfies the constraint condition. Then we have:
 (9)
(9)Theorem proof The information change difference:
 (10)
(10)According to Lemma, and under the same constraints for p(x) and q(x), by substituting Eq.9 into Eq.10, we can have:
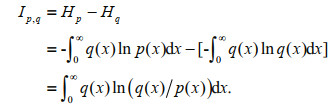 (11)
(11)And the ratio of the likelihood function of p(x) to the maximum entropy density function q(x) is defined by:
 (12)
(12)Among them 

Take the logarithm of both sides of the Eq.12, and from the maximum value of the likelihood function we know:
 (13)
(13)The parameter part in Eq.13 is the value obtained by the maximum likelihood estimation, which is omitted here and is abbreviated as q(x) and p(x).
Multiply both sides of Eq.13 by q(x) and complete the integral, we can have:
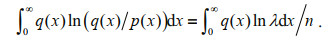 (14)
(14)From Eqs.11 & 14 thus we know:
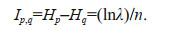
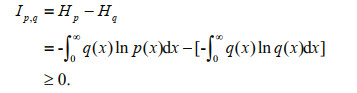
Theorem tells us that the information variation is essentially the logarithmic mathematical expectation of the likelihood function ratio, and thus a very important inference can be obtained:
Inference The entropy difference between the nonmaximum entropy probability density function and the maximum entropy probability density function: Ip, q≥0, and gradually approaches zero as the number of samples n increases.
Inference proof It is known from the literature (Escalante et al., 2016; Deng et al., 2021) that for any p(x) and q(x), there is
The density function set to reach the maximum entropy is p(x), a density function other than the maximum entropy function is set as q(x), as can be seen from Lemma, we have:
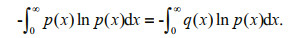
Substitute it in Eq.11
That is, any entropy of q(x) that satisfies the constraint condition other than the entropy density function is less than the maximum entropy. And since when n→∞, the parameter value obtained by the maximum likelihood estimation is the parameter value of the true distribution at that time, thus the values of the likelihood function 

The influence of data samples on the uncertainty of the model is not only reflected in the quantity, the range and dispersion degree of the sample also have certain effects on the uncertainty of the model. This is mainly reflected in the sensitivity of the extreme data to the model and the degree of application for the model. In fact, based on the Chebyshev inequality (Niculescu and Pečarić, 2010; Chen et al., 2016; Shamshirband et al., 2020), a set of observation sequences with the same number and the same mathematical expectation, if one group has a larger range of variation than the other group, then the corresponding variance will also be larger than the other group, that is, the mathematical expectation reflects the distribution center of the random variable, and the variance reflects the degree of dispersion of the random variable and its mean. It is based on variance that the literature (Liu et al., 2018, 2019c; Ponce-López et al., 2016) has proved the relationship between information entropy and the degree of data dispersion.
Let a continuous random variable be X, whose density function, mathematical expectation and standard are f(x), μ, and σ, respectively, we can normalize the set of random variables, i.e.:
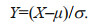
Then the standardized density function is:
The entropy after standardization is:
 (15)
(15)It can be seen from Eq.15 that the information entropy of the random variable is different from the normalized information entropy by a constant. And this constant is exactly equal to the logarithm of the standard deviation, so for the same kind of random variable, its information entropy increases with the increase of the standard deviation. Information entropy measures the uncertainty of random variables. The standard deviation or variance measures the degree of dispersion of random variables. Therefore, the larger the range of data samples, the greater the uncertainty. For example, under the condition that the value range is limited, the maximum entropy value is reached when the probability distribution of the random variable is uniformly distributed, and the variation range of the random variable is reaching the biggest with the entire value interval.
2.3 Research on the overall uncertainty of the modelConsider the impact of data samples on information entropy. Equation 8 shows that as the number of samples increases, the information entropy of the distribution model increases accordingly. Therefore, the ratio of the amount of information entropy increase to the amount of sample increase can be regarded as the rate of change of sample size to information entropy. It is ∆H1 in the Eq.7.
Consider the impact of data dispersion on information entropy. Since the variance can represent the degree of dispersion of the data and the Eq.15 indicates that when the degree of dispersion is larger, the variance is larger, and the information entropy of the model is larger. In fact, the degree of dispersion of the data has the greatest impact on the information entropy of the model and its influence is easy to be understood. Under the principle of maximum entropy, when the value of the data is limited to a certain range, the maximum entropy is reached when the probability density of the data is uniformly distributed; for the same reason, the greater the degree of dispersion of the sample (the larger the variance), the closer it is to the uniform distribution, meaning the closer it is to the maximum entropy. Considering the two sets of different variances but with the same number of samples, the ratio of the increase of information entropy to the increase of variance can be regarded as the rate of change of the sample to the information entropy, which is ∆H2 in Eq.7.
The estimation of the model parameters also affects the uncertainty. In this paper, the information entropy of sampling error based on the Monte Carlo method is used. For the parameter estimator of the distribution model, a large number of random numbers corresponding to the parameter distribution are generated respectively, the estimated value satisfying the design parameters is obtained by using the definition of the empirical distribution function, and then the error between the estimated value and the theoretical value of the distribution is calculated. The information entropy of the error is calculated, and the influence of the sampling error on the information uncertainty and the rate of change for the sample number are obtained as ∆H3.
Based on the information uncertainty such as sample size, dispersion degree, sampling error, etc., this study proposes a formula for calculating the overall uncertainty:
 (16)
(16)The above formula uses information entropy as its measurement tool, because information entropy represents the uncertainty of random variables, thus using information entropy to describe the probability distribution of random variables has its incomparable advantages (Jiang et al., 2019; Song et al., 2019; Xu and Lei, 2019).
3 ENGINEERING EXAMPLEThe uncertainty calculation method described in this paper is of great practical significance for the accurate calculation of the overall uncertainty of different models and the reasonable selection of the type of distribution model, which provides a theoretical basis for the selection of the model with the lowest overall uncertainty so as to reasonably determine the design criteria of the offshore structures under various marine environmental factors.
The application of the model uncertainty study is illustrated by the 26-year extreme wave height data of an island hydrological observation station in the Yellow Sea. First, the data scatter (Fig. 1) of the extreme wave height sequence is given. The set of sequences uses the block maximum (BMM) method, so the data can be regarded as the sample from the Generalized Extreme Value (GEV) distribution (Jaynes, 1957; Zeng et al., 2017).

|
| Fig.1 Extreme wave height of a hydrological observation station in the Yellow Sea for 26 consecutive years |
First, we analyzed the impact of changes in the number of data samples on the uncertainty of the model. Since the estimation model under marine environmental conditions generally considers the data representative with at least 15–20 years of continuous observation, the data is divided into two groups. The first group is the first 20 data points, and the second group is all the 26 data points. Both were used to calculate the information entropy change of the model under the two sets of data. It can be seen from Eq.2 that as the number of sample data increases, the information entropy will gradually increase. Therefore, the small range of information entropy indicates that the model is less affected by the change of the number of data, and its adaptability to the data is better. Otherwise, the model is more sensitive to changes in the number of data points. The calculation results are shown in Table 1.
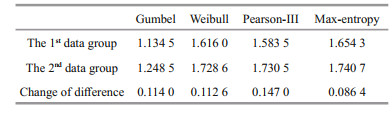
It can be seen from Table 1 that as the number of samples increases, the information entropy of each estimation model also increases. Among them, the maximum entropy model has the smallest change, the Pearson-III model has the largest change, and the change range for the Gumbel and Weibull model is between the two with minimal difference. These reflect the performance of the maximum entropy model in the case of a short data period. Max-entropy model can be chosen since the information entropy has the smallest range of variation, that is to say, the range of uncertainty is the smallest; on the other hand, the maximum entropy model also has greater stability in the case of less data. Meanwhile, we can see from Fig. 2 that the entropy value obtained by calculating the information entropy is always higher than the other models when the data acquiring period is either longer or shorter, which on the other hand shows that the model determined by the maximum entropy of information is the model with the least interference of human subjective factors. From another perspective, it also reflects that the information entropy of various design parameters gradually unify with the increase of the number of data samples.

|
| Fig.2 Information entropy of different models for two groups of data |
Secondly, the influence for the degree of dispersion of the data sample on the uncertainty is analyzed. Since the information entropy of the distribution model has been gradually increased with the increase of the number of samples, in order to avoid the influence of the sample size on the calculation result, we divided the sample data into two consecutive groups, each containing 13 samples. The maximum of the 26-year data appeared in the 16th year, and the minimum appeared in the 26th year. Both are in the second group. It can also be seen from Fig. 3 that the second set of data is significantly more variable than the first set of data. The range of fluctuation is large and the degree of dispersion is higher. Table 2 shows the information entropy values of the two sets of data corresponding to different estimation models.

|
| Fig.3 Sample data divided into two consecutive groups |
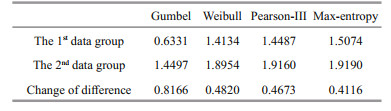
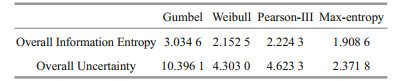
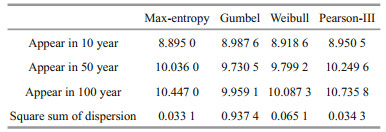
It can be seen from Table 2 that when the degree of dispersion of data increases, that is, when the fluctuation range of data changes is wider and the variance is larger, the information entropy shows a significant increasing trend. By comparing Tables 1 & 2, it can be seen that the information entropy growth caused by variance significantly exceeds the increase in the number of samples and contributes to the growth of information entropy. The information entropy calculated from the data of the last 13 years has even been greatly exceeding the information entropy that can be obtained from all the 26 years of data. Information entropy is a measure of the uncertainty of random events, according to the principle of maximum entropy, for the overall unknown random variables, in the case of insufficient data to solve the distribution function, the first requirement is to match the known data, and at the same time make the least assumptions about the unknown part of the distribution, the more the unknown part is the greater the entropy value. So far, we have calculated the information entropy changes of each distribution model when the number and variance of data samples change have been calculated. At the same time, the information entropy of each distribution model and the information entropy caused by the sampling error of the model parameter estimator are also given. Equations 7 & 16 can calculate the overall information entropy of the model, and then obtain the overall uncertainty of the model. The calculation results of the overall information entropy of each model are shown in Table 3. Table 4 and Fig. 4 show the design wave height values of the different distribution models.
|
|

|
| Fig.4 Horizontal height map for the wave height of different distribution models |
It can be seen from Table 4 that for the commonly used extreme value distribution models for calculating design parameters of marine environment, Gumbel distribution has the largest global information entropy and global uncertainty, while max entropy distribution has the smallest, with values of 1.126 and 7.024 3, respectively. The overall information entropies of Weibull distribution and Pearson-III distribution are close, with a difference of 0.071 8. In addition, the difference between Weibull distribution and Pearson-III distribution, and the max entropy distribution are 0.243 9 and 0.315 7, respectively. In the case of short return period, the design wave heights calculated by different distribution functions have little difference, and the difference between the maximum and minimum return levels of wave height is 0.092 6 (Table 4). With the increase of return period, the difference between the calculated results increases and the difference between the maximum and minimum design wave heights of 100-year return period is 0.776 7. The design wave height of max entropy distribution is lower than that of Pearson-III distribution specified in the hydrological code of the sea port (Table 4). In view of the above discussion, it is recommended to use the max-entropy distribution to calculate the design wave height in the determination of the design standards of breakwater and flood dike.
4 CONCLUSIONThis study provides a method for calculating the overall uncertainty by considering the influence of sample information such as sample size, dispersion degree, and sampling error on the information entropy of the model, and the sampling error caused by the model estimator. The analysis was carried out with more convincing results obtained alongside. Specifically, the following conclusions are made:
(1) As can be seen from Table 3, in the given three alternative models, the overall uncertainty of the maximum entropy distribution model is the smallest for the 26-year continuous wave height data, followed by the Weibull and Pearson-III models, while the overall uncertainty of the Gumbel distribution model is the largest. This shows that we should first choose the maximum entropy distribution model when doing the model selection. The Pearson-III distribution model has little difference with the overall uncertainty of the Weibull distribution model, both of which can be the second alternative model.
(2) When the degree of dispersion of the data is large, that is, the variance of the data is large, the influence of the variance on the overall information entropy should be considered. It can be seen in Tables 1 & 2 that the influence of variance on information entropy is huge. The larger variance of the data in the last 13 years has increased the overall information entropy more than the increase of information entropy in all data in 26 years.
(3) The overall uncertainty of the design parameter estimation model depends on its overall information entropy. For the overall information entropy of the model one can further consider the form of its own component weighting. In addition, the appropriate scaling will increase the weight of the overall information entropy towards approaching the real situation (Zeng et al., 2018; Liu et al., 2020a, b). However, how to determine the weight reasonably and accurately is still a key problem to be solved.
(4) The research of this article shows that the overall uncertainty of the maximum entropy distribution model is the smallest when it is used to calculate the extreme wave height, which is the most consistent one with the actual situation, indicating that the extreme wave height calculated by the maximum entropy distribution model will be more accurate, and the application of this model to the determination of the design standards of offshore engineering will have certain theoretical guiding significance to the statistical prediction of typhoon disasters, the analysis of the power positioning design capability of drilling ships, and the determination of the bottom deck elevation of offshore platforms.
5 DATA AVAILABILITY STATEMENTAll data generated and/or analyzed during this study are not available to public. For readers that are interested, please contact corresponding author for details.
Chen B Y, Escalera S, Guyon I, Ponce-López V, Shah N, Simón M O. 2016. Overcoming calibration problems in pattern labeling with pairwise ratings: application to personality traits. In: Hua G, Jégou H eds. Computer Vision — ECCV 2016 Workshops. Springer, Cham. p. 419-432, https://doi.org/10.1007/978-3-319-49409-8_33.
|
Chen B Y, Kou Y, Zhao D, Wu F, Liu S X, Chia A, Wang L P. 2020. Calculations on stopping time and return period. Natural Hazards, 101(2): 537-550.
DOI:10.1007/s11069-020-03884-2 |
Chen B Y, Liu G L, Wang L P. 2017a. Predicting joint return period under ocean extremes based on a maximum entropy compound distribution model. International Journal of Energy and Environmental Science, 2(6): 117-126.
DOI:10.11648/j.ijees.20170206.11 |
Chen B Y, Liu G L, Wang L P, Zhang K Y, Zhang S F. 2019a. Determination of water level design for an estuarine city. Journal of Oceanology and Limnology, 37(4): 1 186-1 196.
DOI:10.1007/s00343-019-8107-z |
Chen B Y, Yang Z Y, Huang S Y, Du X Z, Cui Z W, Bhimani J, Xie X, Mi N F. 2017b. Cyber-physical system enabled nearby traffic flow modelling for autonomous vehicles. In: Proceedings of the 36th International Performance Computing and Communications Conference (IPCCC), IEEE, San Diego, CA. p. 1-6, https://doi.org/10.1109/PCCC.2017.8280498.
|
Chen B Y, Zhang K Y, Wang L P, Jiang S, Liu G L. 2019b. Generalized extreme value-Pareto distribution function and its applications in ocean engineering. China Ocean Engineering, 33(2): 127-136.
DOI:10.1007/S13344-019-0013-9 |
Deng W, Xu J J, Song Y J, et al. 2019. An effective improved co-evolution ant colony optimisation algorithm with multi-strategies and its application. International Journal of Bio-Inspired Computation, 16(3): 158-170.
|
Deng W, Xu J J, Song Y J, Zhao H M. 2021. Differential evolution algorithm with wavelet basis function and optimal mutation strategy for complex optimization problem. Applied Soft Computing, 100: 106724.
DOI:10.1016/j.asoc.2020.106724 |
Deng W, Xu J J, Zhao H M, Song Y J. 2020. A novel gate resource allocation method using improved PSO-based QEA. IEEE Transactions on Intelligent Transportation Systems, 1-9, https://doi.org/10.1109/TITS.2020.3025796 (electronically published: October 2020).
|
Escalante H J, Ponce-López V, Wan J, Riegler M A, Chen B Y, Clapés A, Escalera S, Guyon I, Baró X, Halvorsen P, Müller H, Larson M. 2016. ChaLearn joint contest on multimedia challenges beyond visual analysis: an overview. In: Proceedings of the 23rd International Conference on Pattern Recognition (ICPR). IEEE, Cancun. p. 67-73, https://doi.org/10.1109/ICPR.2016.7899609.
|
Jaynes E T. 1957. Information theory and statistical mechanics. Physical Review, 106(4): 620-630.
|
Jiang S, Lian M J, Lu C W. 2019. SVM-DS fusion based soft fault detection and diagnosis in solar water heaters. Energy Exploration & Exploitation, 37(3): 1 125-1 146.
DOI:10.1177/0144598718816604 |
Liu G L, Chen B Y, Gao Z K, Fu H L, Jiang S, Wang L P, Yi K. 2019a. Calculation of joint return period for connected edge data. Water, 11(2): 300.
DOI:10.3390/w11020300 |
Liu G L, Chen B Y, Jiang S, Fu H L, Wang L P, Jiang W. 2019b. Double entropy joint distribution function and its application in calculation of design wave height. Entropy, 21(1): 64.
DOI:10.3390/e21010064 |
Liu G L, Chen B Y, Wang L P, Zhang S F, Zhang K Y, Lei X. 2019c. Wave height statistical characteristic analysis. Journal of oceanology and limnology, 37(2): 448-460.
DOI:10.1007/s00343-019-8006-3 |
Liu G L, Gao Z K, Chen B Y, Fu H L, Jiang S, Wang L P, Kou Y. 2019d. Study on threshold selection methods in calculation of ocean environmental design parameters. IEEE Access, 7: 39 515-39 527.
DOI:10.1109/ACCESS.2019.2906935 |
Liu G L, Gao Z K, Chen B Y, Fu H L, Jiang S, Wang L P, Wang G, Chen Z S. 2020. Extreme values of storm surge elevation in Hangzhou Bay. Ships and Offshore Structures, 15(4): 431-442.
DOI:10.1080/17445302.2019.1661618 |
Liu G L, Li X, Wang J H, Kou Y, Wang X P. 2020a. Research on the statistical characteristics of typhoon frequency. Ocean Engineering, 209: 107489.
DOI:10.1016/j.oceaneng.2020.107489 |
Liu G L, Yu Y H, Kou Y, Du X Z, Han L Z, Wu F, Liu S X. 2020b. Joint probability analysis of marine environmental elements. Ocean Engineering, 215: 107879.
DOI:10.1016/j.oceaneng.2020.107879 |
Liu X J, He Y Q, Fu H L, Chen B Y, Wang M M, Wang Z L. 2018. How environmental protection motivation influences on residents' recycled water reuse behaviors: a case study in Xi'an city. Water, 10(9): 1 282.
DOI:10.3390/w10091282 |
Nabipour N, Mosavi A, Hajnal E, Nadai L, Shamshirband S, Chau K W. 2020. Modeling climate change impact on wind power resources using adaptive neuro-fuzzy inference system. Engineering Applications of Computational Fluid Mechanics, 14(1): 491-506.
DOI:10.1080/19942060.2020.1722241 |
Niculescu C P, Pečarić J. 2010. The equivalence of Chebyshev's inequality to the Hermite-Hadamard inequality. Mathematical Reports, 12(62): 145-156.
|
Ponce-López V, Chen B Y, Oliu M, Corneanu C, Clapés A, Guyon I, Baró X, Escalante H J, Escalera S. 2016. ChaLearn LAP 2016: first round challenge on first impressions-dataset and results. In: Hua G, Jégou H eds. Computer Vision — ECCV 2016 Workshops. Springer, Cham. p. 400-418, https://doi.org/10.1007/978-3-319-49409-8_32.
|
Shamshirband S, Mosavi A, Rabczuk T, Nabipour N, Chau K W. 2020. Prediction of significant wave height; comparison between nested grid numerical model, and machine learning models of artificial neural networks, extreme learning and support vector machines. Engineering Applications of Computational Fluid Mechanics, 14(1): 805-817.
DOI:10.1080/19942060.2020.1773932 |
Song J Z, Feng Q, Wang X P, Fu H L, Jiang W, Chen B Y. 2019b. Spatial association and effect evaluation of CO2 emission in the Chengdu-Chongqing urban agglomeration: quantitative evidence from social network analysis. Sustainability, 11(1): 1.
DOI:10.3390/su11010001 |
Wang L P, Chen B Y, Chen C, Chen Z S, Liu G L. 2016. Application of linear mean-square estimation in ocean engineering. China Ocean Engineering, 30(1): 149-160.
DOI:10.1007/s13344-016-0007-9 |
Wang L P, Chen B Y, Zhang J F, Chen Z S. 2013. A new model for calculating the design wave height in typhoon-affected sea areas. Natural Hazards, 67(2): 129-143.
DOI:10.1007/s11069-012-0266-6 |
Wang L P, Xu X, Liu G L, Chen B Y, Chen Z S. 2017. A new method to estimate wave height of specified return period. Chinese Journal of Oceanology and Limnology, 35(5): 1 002-1 009.
DOI:10.1007/s00343-017-6056-y |
Xu J C, Lei B J. 2019. Data interpretation technology of GPR survey based on variational mode decomposition. Applied Sciences, 9(10): 2 017.
DOI:10.3390/app9102017 |
Zeng Y J, Xie Z H, Liu S, Xie J B, Jia B H, Qin P H, Gao J Q. 2018. Global land surface modeling including lateral groundwater flow. Journal of Advances in Modeling Earth Systems, 10(8): 1 882-1 900.
DOI:10.1029/2018MS001304 |
Zeng Y J, Xie Z H, Zou J. 2017. Hydrologic and climatic responses to global anthropogenic groundwater extraction. Journal of Climate, 30(1): 71-90.
DOI:10.1175/JCLI-D-16-0209.1 |