 2021, Vol. 39
Institute of Oceanology, Chinese Academy of Sciences
Article Information
- SHI Honghua, YIN Liting, GAO Meng
- Landscape changes and their ecological effects of Miaodao Archipelago with human disturbances and under natural conditions in the past 30 years
- Journal of Oceanology and Limnology, 39(3): 955-978
- http://dx.doi.org/10.1007/s00343-020-0177-4
Article History
- Received Apr. 28, 2020
- accepted in principle Jun. 8, 2020
- accepted for publication Jul. 20, 2020


2 Laboratory for Marine Geology, Pilot National Laboratory for Marine Science and Technology(Qingdao), Qingdao 266061, China;
3 Key Laboratory of Coastal Environmental Processes and Ecological Remediation, Yantai Institute of Coastal Zone Research, Chinese Academy of Sciences, Yantai 264003, China;
4 Center for Ocean Mega-Science, Chinese Academy of Sciences, Qingdao 266071, China
Landscape pattern are resulted from the combined effect of natural and human factors in the geographic space in the modern time. With the increasingly frequent human activities, the landscape pattern is increasingly affected by human disturbances (Chen et al., 2013). Therefore, the study of landscape pattern evolution and its ecological effects has become an important research direction of landscape ecology for the protection of ecological environments and the planning of regional resources (Cook, 2002), which is of great significance for the sustainable development of human and nature.
An island is a reservoir of important ecological functions, a critical platform for safeguarding the rights and interests of a country, a carrier of human living, and a fulcrum for the protection and utilization of ocean (Jupiter et al., 2014; Chi et al., 2015). Due to its unique conditions and complex external disturbances, the offshore island ecosystem is very vulnerable and more susceptible to the disturbances. Its damage recovery via its own adjustment ability is usually difficult (Qie et al., 2011; Wang et al., 2014; Chi et al., 2015). In recent years, the development and utilization of offshore islands have become more intensive, resulting in the fragmentation of natural landscapes of the offshore islands, more artificial landscapes, and significant changes in landscape patterns (Wang et al., 2008; Lin et al., 2010; Tzanopoulos and Vogiatzakis, 2011; Shi et al., 2017). The landscape pattern has profound effects on the island ecosystem (Sun et al., 2015). The island ecosystem functions, such as vegetation productivity, biodiversity, soil conservation, and so on, are all affected by the changes in landscape pattern (Chi et al., 2015, 2016). Archipelago is a grouping form of adjacent islands in the area. Different islands in an archipelago may exhibit significantly different geographic characteristics, such as area and shape (Vogiatzakis et al., 2008). There are also obvious spatial differences in the terrains of the islands, which, along with the heterogeneous developments of human activities, cause more and more obviously different landscape patterns of the islands.
Ma et al. (2020) evaluated the island ecological vulnerability in four administrative regions of Zhoushan, China during the period of 2012–2017 through the coupled coordination model (CCDM) based on the "exposure (E)-sensitivity (S)-adaptability (A)" framework to determine the overall development level of the E-S-A subsystem in each region. The results showed that the more balanced the coupling coordination (CCD) value between the E-S-A subsystems, the higher the island ecological vulnerability (IEV) values of the four tourist destinations in Zhoushan. Tourism is a double-edged sword for islands, but its overall benefits generally outweigh the negative impacts on island ecological conditions. To quantify the spatial and temporal changes of the ecological environment of Hainan Island, Sun et al. (2020) established the Ecological Environment Quality Index (EQI) of Hainan Island evaluation model using the multi-spectral Landsat data with the spatial resolution of 30 m from 1990 to 2015. It was found that the overall eco-environmental quality of Hainan Island was good, but with obvious spatial variability. From 1990 to 2015, the ecoenvironmental quality of Hainan Island slightly declined, and the regions with higher qualities exceeded those with lower qualities.
In summary, under the influences of natural conditions and human disturbances, the ecological effects of offshore islands tend to be complex, with multiple responses and influencing factors. However, the studies of island landscape pattern and its correlation with ecosystem services have rarely been reported. Therefore, the impacts of the island ecological effects are evaluated by using the human disturbances and natural conditions as the independent variables and ecological effects as the dependent variables in the present work. Because there are different influencing factors in these three variables which interact with each other, the relationships of the variables are very complex, and thus the related study is very challenging.
Structural equation modeling (SEM) is a statistical method for analyzing the relationships between variables by using the covariance matrix of the variables. It is an important tool for multivariate data analysis. It can handle the relationships between multiple independent variables and multiple dependent variables at the same time, and clearly analyze the effect of a single factor on the whole and the relationships between influencing factors. Therefore, based on the characteristics of the SEM, we believe that it is of great help to the study of the impacts of human disturbances and natural conditions on the island ecological effects. The multiple independent variables, which characterize natural conditions and human disturbances, and multiple dependent variables, which characterize ecological effects, can be simultaneously processed, which effectively solves the difficulties in analyzing the multiple response factors of the ecological effects of offshore islands.
In the present work, the changing characteristics of the landscape pattern in the Miaodao Archipelago, Bohai Sea, North China, from 1990 to 2019, were studied and an evaluation index system for the impacts of natural conditions and human disturbances on the ecological effects of the island was constructed based on the pressure-state-response (PSR) model. The relationship between the impacts of human disturbances and natural conditions on the island ecological effects and their intensities was determined by the empirical analysis to explain the variation characteristics of island ecosystem under the influence of natural conditions and human disturbances, to provide a reference for island ecosystem protection, and to enrich the study of landscape pattern characteristics and ecological effects from the regional typicality prospective.
2 MATERIAL AND METHOD 2.1 Evaluation model 2.1.1 Model indexThe islands in China are prone to suffer from geological disasters due to their material composition and topographic features, strong land-ocean interactions, the active geological activities in large areas and increasingly frequent human activities (Du and Li, 2010; Lin et al., 2010). Therefore, we evaluate the impacts of natural condition on the island using terrain factors, such as elevation, slope, aspect, and coastline proximity, which can characterize the distance between islands and continent.
Island ecosystem is a complex coupled naturalhuman ecosystem. With the increases in type, scope, and intensity of human activities, the island ecosystem has been increasingly affected by human disturbances, which in turn exacerbates the ecological vulnerability of the island. Marine and coastal development projects can directly change the island coastline and seafloor topography, and occupy the habitats of biological species which may cause the ecological service value loss. Island tourism imposes great impacts on the island ecosystem. Shipping is an important communication means between island and the outside world, whose pollutants can cause negative impacts if they are not properly treated. Therefore, the shoreline use intensity, land use intensity, and the remoteness of islands are used to characterize the degrees of human disturbances.
The landscape fragmentation analysis can help to understand the landscape evolution characteristics of the island that are subjected to the modern development and provide a theoretical basis for island biodiversity protection and ecological environment maintenance. Due to the geographical locations and climate environments, there are usually freshwater shortages in most islands (Särkinen et al., 2012; Nogué et al., 2013). Analyzing and evaluating the water yield of the ecosystem can not only be in favor of the utilization of local water resources, but also assess the quality of ecological environment and provide a scientific basis for the policy adjustment of local water utilization. Carbon sequestration is an important function of ecosystem service, which is of great significance for maintaining the stability of island ecosystem. Therefore, the net primary productivity (NPP) evaluation of the island ecosystem can provide an important reference and demonstration for studying the carbon sequestration and maintaining the ecological balance of the island (Shi et al., 2017). Soil conservation is one of the most important ecosystem services. Because the island area is small and its ecosystem is fragile, the soil erosion can cause serious threats. Therefore, it is necessary to study the island soil conservation (Li et al., 2011). The unique environmental conditions of island usually result in a limited number of biological species and low biodiversity (Paulay, 1994; Shimizu, 2005; Katovai et al., 2012), yet the island ecosystem possesses independent and complete structure and function, despite its simple structure. The habitat quality can reflect the level of biodiversity. Therefore, landscape fragmentation, water yield, NPP, habitat quality, and soil conservation are used to characterize the ecological effects of island landscape patterns in the present work.
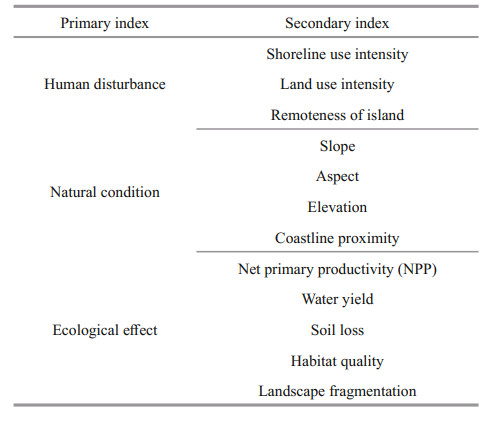
Based on the characteristics of island ecosystem listed above, as well as the system disturbance and data availability, an index system is constructed according to the PSR model as shown in Table 1. "Pressure" refers to the natural conditions and human disturbances, such as shoreline use intensity, land use intensity, island remoteness, slope, aspect, elevation, and coastline proximity. "State" refers to the ecological effects under the above pressures, including NPP, water yield, soil loss, habitat quality, and landscape fragmentation. "Response" is the technological and management measures taken by human beings to restore or protect the ecological environment.
Based on the changes in the landscape pattern of Miaodao Archipelago with different human disturbances and under natural conditions in the past 30 years and their ecological effects, a model is constructed by using the relevant data of 1990, 2000, 2010, and 2019. The specific data sources and processing flow chart are described in details below.
2.1.2 Index evaluation 2.1.2.1 Index standardizationAll levels of human disturbances, natural condition, and ecological effects are normalized as shown in Eq.1. The resultant values are mapped between [0, 1] by the dispersion normalization method.
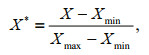 (1)
(1)where X* is the normalized value, X is the input data, Xmax is the maximum value of the data set, and Xmin is the smallest value of the data set.
The original value of aspect increases clockwise from 0 to 360, where 0 represents north and 180 represents south. Aspect is normalized with Eq.2 based on the positivity.
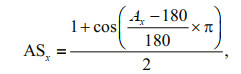 (2)
(2)where ASx is the normalized aspect at point x, and Ax is the original aspect at point x.
Slope is normalized with the equation below:
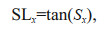 (3)
(3)where SLx is the normalized slope at point x and Sx is the original slope at point x.
2.1.2.2 Calculation of the intensities of human disturbances(1) Shoreline use intensity
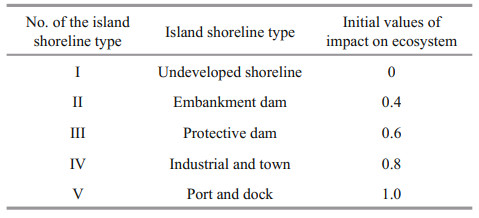
Based on the development and utilization statuses of island coastline, shoreline developments can be classified into different types. The reference values for evaluating the impacts of different shoreline development types on the island ecosystem can be set, usually based on common knowledge of technicians in the field. Specifically, Table 2 lists the initial values of the effects of different types of shoreline developments including the undeveloped shoreline, embankment dam, protective dam, industrial and town, and port and dock on the island ecosystem as 0, 0.4, 0.6, 0.8, and 1.0, respectively.
|
The island shoreline is divided into N segments, and the attenuation distance from the center point of each grid of island to the midpoint of each shoreline segment is measured, which along with the evaluation reference values of the impacts of different shoreline development types on the island ecosystem are used to evaluate impacts of the shoreline development on the island land ecosystem. Specifically, the impact of the development of the ith coastline segment on any grid of ecosystem in the island land can be expressed as:
 (4)
(4)where Ii (x, y) represents the impact of the development of the ith shoreline segment on any grid of ecosystem in the island land, Pi is the reference value for the assessment of the impact of the shoreline type on the island ecosystem, Di (x, y) is the attenuation distance from the central point of any grid to the midpoint of the ith shoreline segment, and w is the half attenuation coefficient. The impact of the development of N shoreline segments on any grid of ecosystem on the island land can be calculated with the equation below:
 (5)
(5)where I (x, y) represents the impact of the development of N shoreline segments on any grid of the island ecosystem. Pi is the reference value for the assessment of the impact of the shoreline type on the island ecosystem. Di (x, y) is the attenuation distance from the central point of any grid to the midpoint of the ith shoreline segment. N is the number of shoreline segments, and w is the half attenuation coefficient. The shoreline use intensity is then normalized.
(2) Land use intensity
The land use intensity (I) is calculated with the equation below:
 (6)
(6)where IC is the scale of the island development and IT is the total area of the island land. IC can be obtained with the equation below:
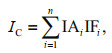 (7)
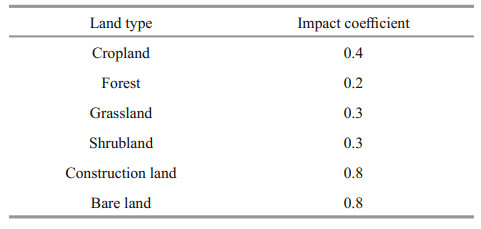
(7)where IAi is the area of the ith utilization type and IFi is the coefficient of impact of the ith utilization type on the ecosystem. Table 3 lists the impact coefficients of different types of island utilizations based on the characteristics of their impacts on the ecosystem (Chi et al., 2017).
|
(3) Remoteness of island
The shortest traffic distances from each grid unit of island to the mainland and to the county government station are calculated using ArcGIS 10.2. These two indicators are normalized and averaged to characterize the remoteness of island.
2.1.2.3 Calculation of natural conditions(1) Landform
The elevation, slope, and aspect are extracted from Global Digital Elevation Model (GDEM) jointly developed and distributed by METI (Japan) and NASA (USA) in 2011 with the horizontal resolution of 30 m and the vertical resolution of 20 m using the ArcGIS 10.2.
(2) Coastline proximity
The coastline proximity in this work refers specifically to the distance from a point on the island land to the nearest coastline in meters.
2.1.2.4 Calculation of ecological effects(1) Net primary productivity (NPP)
The NPP of the studied area is estimated by using the classic Carnegie-Ames-Stanford Approach (CASA) model developed by Potter et al. (1993). The model is a light energy utilization model for estimating the NPP of a certain area. In the classic CASA model, NPP is calculated with two variables, the absorbed photosynthetic active radiation (APAR) by vegetation and light energy utilization rate (ε) as follows:
 (8)
(8)where NPP(x, t) is the NPP at point x of month t and APAR(x, t) is the APAR at point x of month t in MJ/(m2·month).
 (9)
(9)where APAR(x, t) is the APAR at point x of month t in MJ/(m2·month), and FPAR(x, t) is the fractional APAR at point x of month t in %. PAR(x, t) is the photosynthetically active radiation at point x of month t.
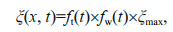 (10)
(10)where ft(t) is the temperature stress factor of the study area in month t in %, fw(t) is the water stress factor of the studied area in month t in %, and ξmax is the maximum light energy utilization rate of vegetation (as carbon) in g/MJ.
The NPP of the study area in four different seasons are estimated, which is then used to calculate the annual NPP using the ArcGIS 10.2. The detailed calculation method can be found in reference (Chi et al., 2015).
(2) Water yield
The water yield is calculated with Eq.11 (Fuh, 1981).
 (11)
(11)where, Yxj is the water yield of the grid x in the jth land type, AETxj is the annual evapotranspiration of the grid x in the jth land type, and Pxj is the annual rainfall of the grid x in the jth land type.
(3) Habitat quality
Habitat quality is used to characterize the status of habitat quality (Wischmeier and Smith, 1958; McKinney, 2002). It can be expressed as:
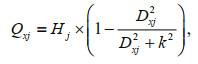 (12)
(12)where, Qxj is the habitat quality of grid x in the land use type j. Dxj is the habitat stress level of grid x in the land use type j. k is the semi-saturation constant, and Hj is the habitat suitability of land use type j.
(4) Soil loss
Soil loss is evaluated with Eq.13 (Universal Soil Loss Equation, USLE), which include the natural and management factors (Wischmeier and Smith, 1958).
 (13)
(13)where USLEx is the amount of soil erosion in grid x. Rx is rainfall erosion. Kx is soil erodibility. LSx is the factor of slope and slope length. Cx is vegetation coverage factor, and Px is management factor.
(5) Landscape pattern
Patch density (PD) reflects landscape pattern fragmentation. The island landscape fragmentation, e.g. the PD, is analyzed by the moving window method in the Fragstats 3.4. The higher the PD value, the more severe the landscape fragmentation, that is, the worse the ecological conditions.
2.2 Structural equation modeling (SEM)The PSR framework is a widely used evaluation model in ecosystem health evaluation. Based on the principle of PSR framework, and considering the main components of the island ecosystem and the availability of data, we use human disturbances and natural conditions as Pressure and the ecological effects as State of the PSR framework for the ecosystem of the Miaodao Archipelago.
Structural equation modeling (SEM) is a statistical method that combines confirmatory factor analysis and path analysis to analyze the relationship between latent and manifest variables and that between latent variables. Manifest variables are also called observable variables or measured variables (Anderson and Gerbing, 1988). There are two types of variables with different properties for SEM, e.g. manifest variables that can be directly observed and latent variables that cannot be directly observed but are reflected by one or more manifest variables (Yang et al., 2016). The variables can also be classified as exogenous variables and endogenous variables based on whether the variables are affected by other variables. Therefore, there are four types of variables for SEM, namely exogenous manifest variables, endogenous manifest variables, exogenous latent variables and endogenous latent variables.
SEM is composed of two parts, the measurement model and structural model (Yang et al., 2016). The former reflects the relationship between the manifest variables X and Y and latent variables ξ and η, and the later characterizes the relationship between the latent variables ξ and η and latent variables ξ and η. The measurement equations can be expressed as:
 (14)
(14)where X is a p×1 dimensional vector composed of p exogenous manifest variables. Y is a q×1 dimensional vector composed of q endogenous manifest variables. Λx is the factor load of exogenous manifest variables X. Λy is the factor load of the endogenous variable Y. ξ is the m×1 dimensional vector composed of m exogenous latent variables. η is the n×1 dimensional vector composed of n endogenous latent variables. δ is the measurement error of the exogenous manifest variable X, and ε is the measurement error of the endogenous manifest variable Y. The structural equation can be expressed as:
 (15)
(15)where B is the n×n dimensional coefficient matrix, representing the relationship between η endogenous latent variables. Γ is the n×m dimensional coefficient matrix, reflecting the effect of exogenous latent variables ξ on the endogenous latent variables η. ζ is n×1 dimensional vector composed of n interpretation errors, reflecting the estimation error of the endogenous latent variable of the structural equation that cannot be fully explained (Yang et al., 2016).
Based on the discussion of the relationships among human disturbances, natural conditions and ecological effects, the initial model is constructed as shown in Fig. 1. Human disturbances, natural conditions, and ecological effects are latent variables, corresponding to their respective observable variables. The overall model is eventually obtained by the normality test, validity test and confirmatory factor analysis of the observable variables selected based on the initial model. Specifically, the shoreline use intensity, land use intensity, and island remoteness listed in Table 1 are selected as the observable variables of human disturbance for the testing. Slope, aspect, elevation, and coast proximity are tested as the observable variables of natural condition. For the ecological effects, NPP, soil loss, habitat quality, water yield and landscape fragmentation are selected as observable variables.

|
| Fig.1 Metamodel for ecological effects in the Miaodao Archipelago |
The Miaodao Archipelago is located on the north side of Shandong Peninsula at the intersection of the Yellow Sea and the Bohai Sea. It is of great importance for the Changdao National Nature Reserve. The area belongs to the East Asian monsoon climate zone with the average annual temperature of 12.0 ℃, average annual rainfall of 537 mm and average annual sunshine time of 2 612 h. The island is a bedrock island with the highest point of 189 m above sea level. Its landform is dominated by the eroded hills composed of poor quality brown sandy and gravel soil (Shi et al., 2013). The southern archipelago is the political, economic, and cultural center of Changdao County with relatively high levels of urban construction, widespread marine aquaculture areas, and heavy transportations. Marine aquaculture, fishing, and tourism are main industries of the five islands in northern side. The socioeconomic developments of different islands in the Miaodao Archipelago are different. The study area of our work includes the 10 islands with residents in the Miaodao Archipelago.
2.3.2 Data sources and processing(1) Remote sensing images
Radiation calibration, band blending, and island contour extraction were conducted on the satellite remote sensing images of 1990 (LANDSAT 5), 2000 (LANDSAT 5), 2010 (LANDSAT 5), and 2019 (LANDSAT 8) with the spatial resolution of 30 m using the ENVI 5.3 and ArcGIS 10.2. Further humancomputer interactive interpretation divides the land cover types into forest, bare land, cropland, construction land, shrubland, and grassland. The coniferous forests and broad-leaved forests are respectively the black pine and black locust dominated artificial forests. The grassland is mainly composed of the natural native herb communities. The cropland is mainly planted with soybeans and corns. Bare land refers to the bare rocks and bare lands on the offshore and inside of the island. Construction land includes the buildings for residential and public utilities on the island.
(2) Meteorological data
Meteorological data including total solar radiation, astronomical radiation, sunshine hours, temperature, rainfall, and humidity are adopted from China Meteorological Data Network (http://data.cma.cn/) and the observation data provided by Changdao County Meteorological Station and Yantai Fushan Meteorological Station.
(3) Landform
The landform data are adopted from the second edition of Aster GDEM data published in 2011. The elevation and slope are extracted from the DEM data with ArcGIS 10.2.
3 RESULT 3.1 Model parameter 3.1.1 Human disturbance 3.1.1.1 Shoreline use intensityFigure 2 shows the normalized shoreline use intensity of Miaodao Archipelago in 1990, 2000, 2010, and 2019. The results show that the intensity of shoreline development increases from land to sea in 1990–2019.

|
| Fig.2 Normalized shoreline use intensity of Miaodao Archipelago in 1990, 2000, 2010, and 2019 |
Figure 3 shows the normalized land use intensity of Miaodao Archipelago in 1990, 2000, 2010, and 2019. The results show that the use intensity of areas, such as construction land, with highly intensive human activities is high, while that of natural environment such as forest land and grassland is low.

|
| Fig.3 Normalized land use intensity of Miaodao Archipelago in 1990, 2000, 2010, and 2019 |
Since the distances between the islands and the county government are fixed values, the normalized remoteness of the Miaodao Archipelago is constant as shown in Fig. 4. The index represents the convenience of transportation and tourism.

|
| Fig.4 Normalized remoteness of the islands in the Miaodao Archipelago |
The elevation, slope, and aspect of the island are extracted from DEM data. The coastline proximity is extracted from the vector data. Since all data above are fixed values and do not vary with time, the normalized results are obtained as shown in Fig. 5.

|
| Fig.5 Normalized natural conditions of Miaodao Archipelago |
(1) Landscape scale
Among different types of landscape, forest accounted for the largest proportion of the landscape in the Miaodao Archipelago, followed by construction land and cropland. There was a certain size of grassland, and the areas of bare land and shrubland were small (Fig. 6). The scales of forest and construction land areas were increasing, and those of cropland and grassland were declining. The scales of other landscape types exhibited no significant changes.

|
| Fig.6 Changes in the landscape pattern of the Miaodao Archipelago |
(2) Island scale
The areas of different islands in the Miaodao Archipelago were obviously different, and the landscape structure of each island was generally similar, yet with some differences. The landscapes of larger islands were more diverse. Croplands were mainly found in Nanchangshan Island, Tuoji Island and Daheishan Island. Miao Island was dominated by forest. The construction lands account for the largest proportion of landscapes in both Beichangshan Island and Nanchangshan Island and exhibit increasing trends. Xiaoqin Island was the with smallest landscape scale (Fig. 7).

|
| Fig.7 Changes in the landscape scales in the each island of Miaodao Archipelago |
(1) Net primary productivity (NPP)
The normalized NPP of the Miaodao Archipelago in 1990, 2000, 2010, and 2019 is shown in Fig. 8. The results show that the NPP of Miaodao Archipelago decreases year by year from 1990 to 2019, mainly due to the increase of construction land and the decrease of natural environment such as forestland.

|
| Fig.8 Normalized NPP of Miaodao Archipelago in 1990, 2000, 2010, and 2019 |
(2) Water yield
The normalized water yield of the Miaodao Archipelago in 1990, 2000, 2010, and 2019 is shown in Fig. 9. The results show that the flow velocity is slow in the low-lying area which is easy to store water and the water yield is high.

|
| Fig.9 Normalized water yield of Miaodao Archipelago in 1990, 2000, 2010, and 2019 |
(3) Soil loss
The normalized soil loss of the Miaodao Archipelago is shown in Fig. 10. The results show that in the low and flat areas of each island, the amount of soil erosion is low. Mountain area is prone to more serious soil loss.

|
| Fig.10 Normalized soil loss of Miaodao Archipelago in 1990, 2000, 2010, and 2019 |
(4) Habitat quality
The normalized habitat quality of the Miaodao Archipelago of different years is shown in Fig. 11. In each island, the habitat quality of the regions where human activities are concentrated, such as cultivated land, tourist sites, and residential areas, is poor, and the habitat quality of the regions where human activities are less disturbed, such as forests and grasslands, is relatively higher.

|
| Fig.11 Normalized habitat quality of the Miaodao Archipelago in 1990, 2000, 2010, and 2019 |
(5) Landscape fragmentation
The normalized landscape fragmentation of Miaodao Archipelago of different years is shown in Fig. 12. Landscape fragmentation is on the rise from 1990 to 2019.

|
| Fig.12 Normalized landscape fragmentation of the Miaodao Archipelago in 1990, 2000, 2010, and 2019 |
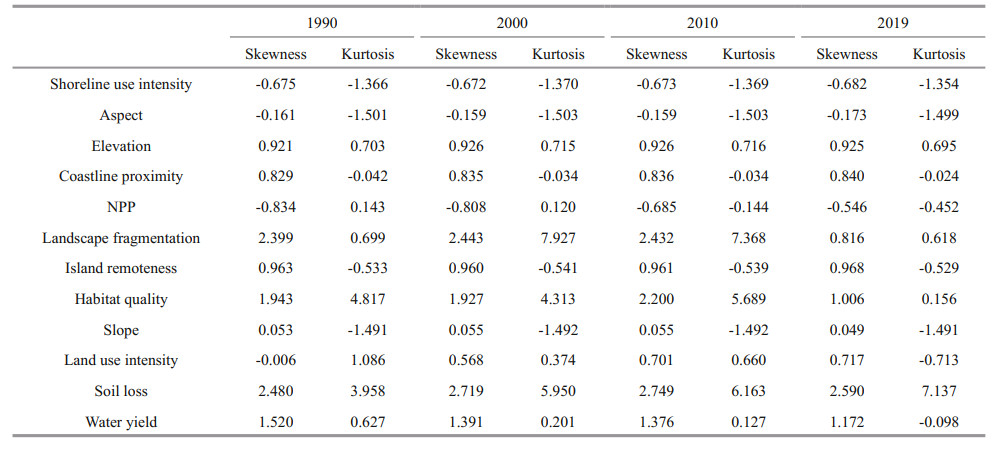
The study area is divided into 12 094 50 m×50 m grids using the Fishnet tool, and the index data of the pixel where the grid center point is located are extracted. The model parameters are examined with the Statistical Product and Service Software Automatically (SPSSAU). The path coefficient of structural equation model is estimated by the maximum likelihood estimation method, which requires the observed variables to follow a multivariate normal distribution. The descriptive statistics of observed variables are given in Table 4. The absolute skewness values of all observed variables are less than 3, and the absolute kurtosis values are less than 8, suggesting that each observed variable approximately follows a normal distribution and meets the test requirements. Therefore, subsequent investigation can be proceeded.
|
Based on the validity test and confirmatory factor analysis of the index system of three types of factor (not presented due to the limited length of manuscript) and the discussion above, we propose the following two hypotheses of the internal structural relationships, H1: the ecological effect responds to the pressure of human disturbances and H2: the ecological effect responds to the pressure of natural conditions.
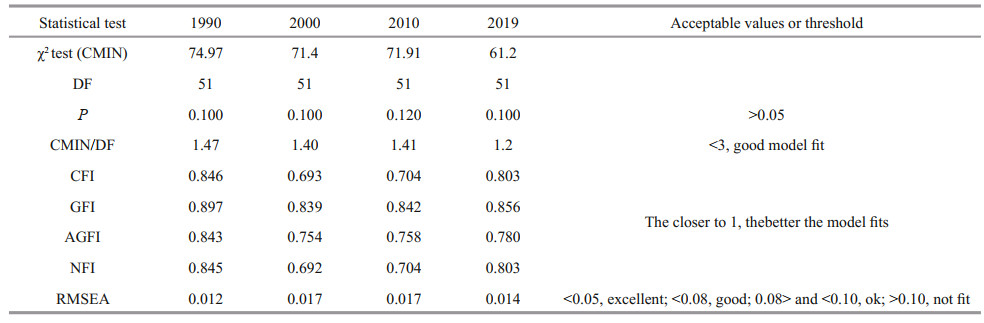
3.2.3 Model constructionThe model is constructed as shown in Fig. 1 with the extracted observed variables by the debugging and fitting. Table 5 lists the model fit indices. Although the fitting results suggest that the model is not the most optimal, it can give explanations to certain degrees. For this reason, the two internal structural relationship hypotheses are discussed in follows. The outputs of the structural equation modeling are obtained as shown in Tables 6 & 7. These results suggest that both hypotheses are valid.
|
|
|
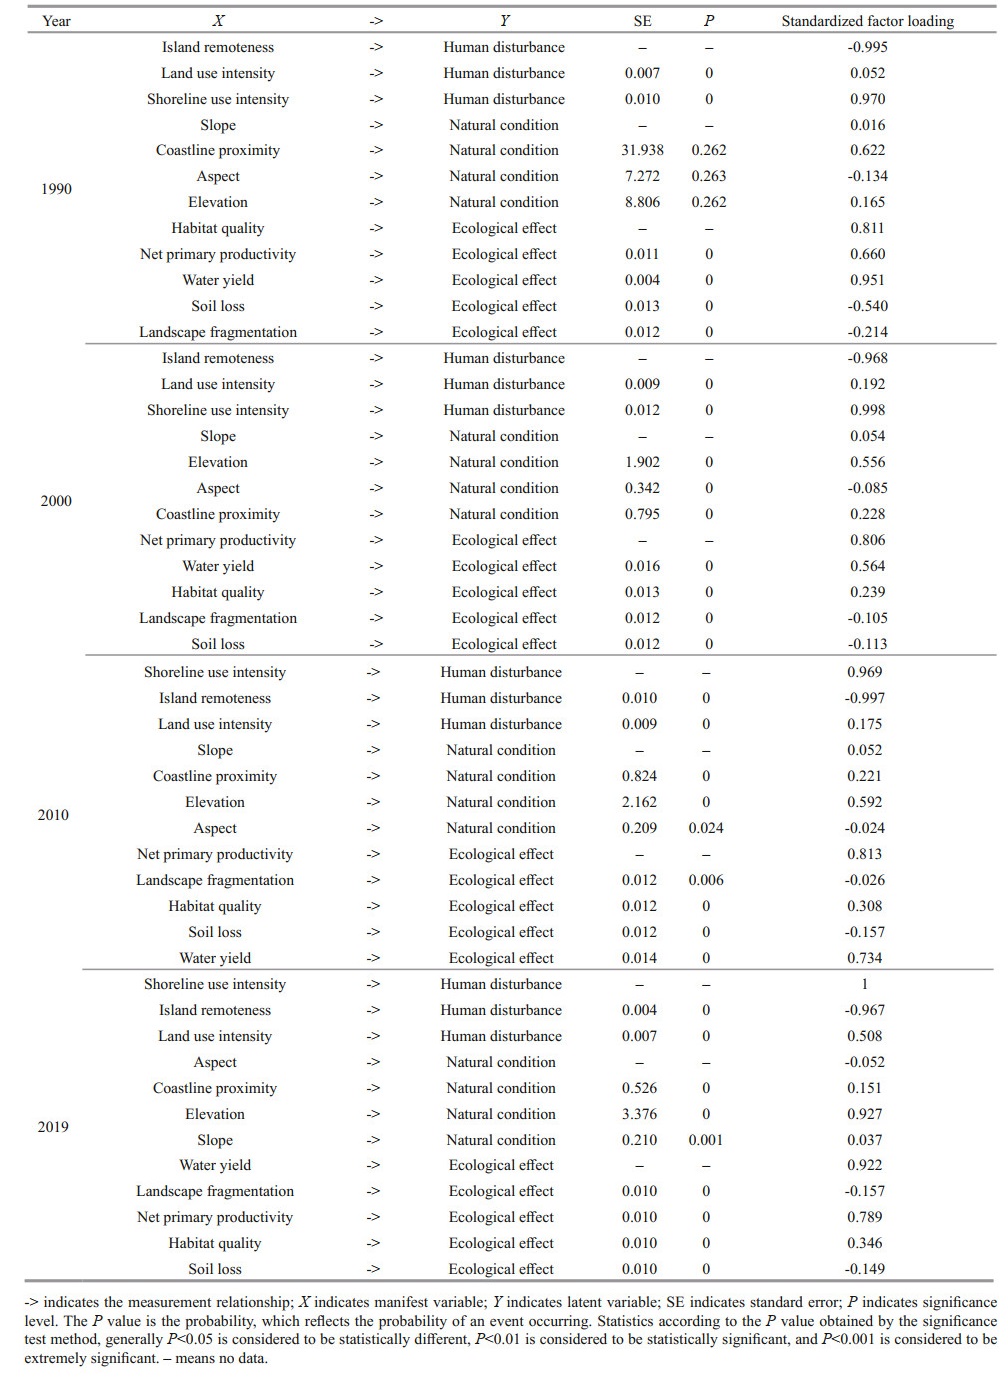
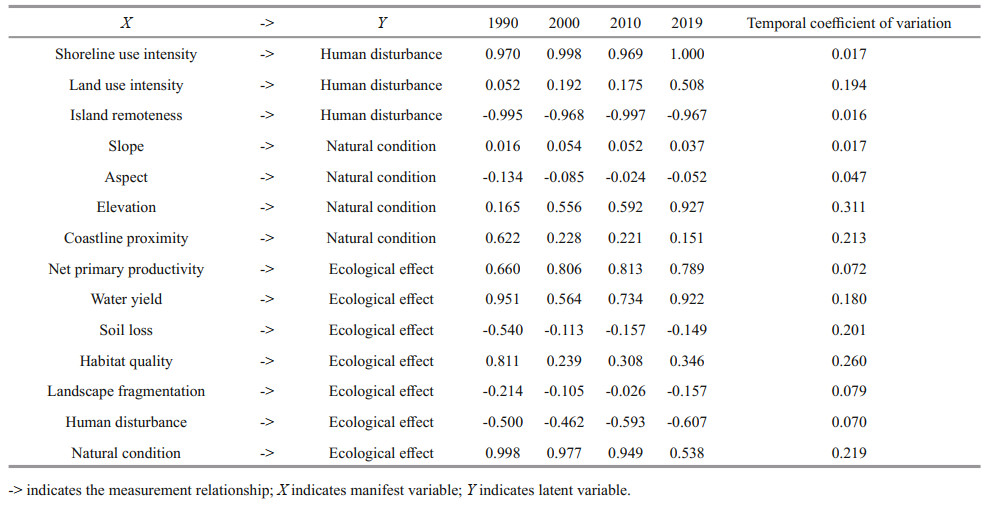
As shown in Fig. 13 for the empirical analysis, each observed variable can reflect its corresponding latent variable well. Among the observed variables for human disturbance, the island remoteness exhibited the greatest influences for the years of 1990, 2000, 2010 and 2019 with the values of -0.995, -0.968, -0.997, and -0.967, respectively, indicating that the geographical location had significant impacts on the island. Among the observed variables of natural condition, The island elevation had greatest influence in 2000, 2010 and 2019 with the values of 0.556, 0.592 and 0.927, respectively, indicating the elevation most thoroughly reflected the natural condition during this period of time. Among the observed variables of ecological effects, water yield exhibited the greatest influences in 1990 and 2019 with the values of 0.951 and 0.922, respectively, suggesting that the water yield most thoroughly could reflect the ecological effect back then. NPP exhibited the greatest influences in 2000 and 2010 with the values of 0.806 and 0.813, indicating that NPP could reflect the quality of ecological effects during these two years.

|
| Fig.13 Overall model path for the modeling of ecological effects in Miaodao Archipelago |
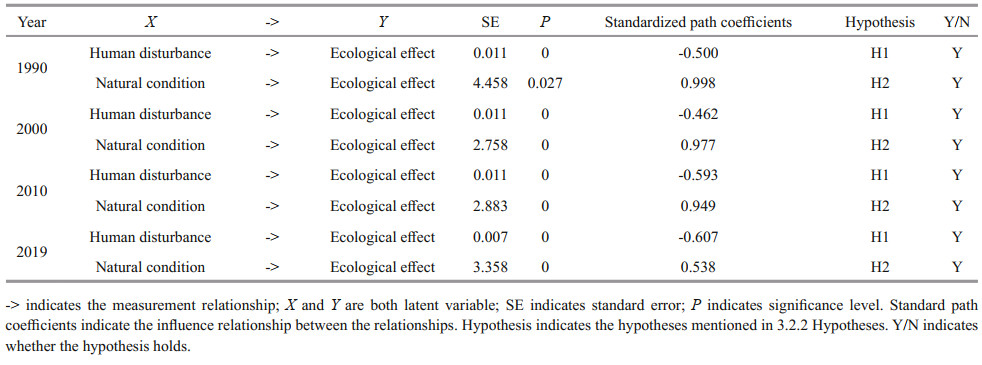
The effect of each latent variable is shown in Table 7. In 1990, the standardized path coefficient value was -0.500 < 0 for the effect of the intensity of human disturbance on the ecological effect at significant level of 0.01 (z=7.146, P=0.000 < 0.01). The standardized path coefficient value was 0.998>0 for the effect of natural condition on the ecological effect at the significance level of 0.05 (z=1.1, P=0.027 < 0.05).
In 2000, the standardized path coefficient was -0.462 < 0 for the effect of human disturbance on the ecological effect at the significance level of 0.01 (z=4.680, P=0.000 < 0.01). The standardized path coefficient value was 0.977>0 for the effect of natural condition on the ecological effect at the significance level of 0.01 (z=5.278, P=0.000 < 0.01).
In 2010, the standardized path coefficient was -0.593 < 0 for the effect of human disturbance on the ecological effect at the significance level of 0.01 (z= -15.303, P=0.000 < 0.01). The standardized path coefficient was 0.949>0 for the effect of natural condition on the ecological effect at the significance level of 0.01 (z=5.153, P=0.000 < 0.01).
In 2019, the standardized path coefficient was found to be -0.607 < 0 for the effect of human disturbances on the ecological effect at the significant level of 0.01 (z=25.538, P=0.000 < 0.01). The natural condition exhibited positive effects on the ecological effect with the standardized path coefficient of 0.538>0 at the significant level of 0.01 (z=-4.050, P=0.000 < 0.01).
In summary, each fitting index is at the statistically significant level, and the overall model fitting meets the requirements, suggesting that the model is acceptable. Both of the proposed hypotheses are valid and both human disturbances and natural conditions influence the ecological effect in the study area. The paths for the impact of natural conditions and human disturbances on the ecological effect show positive and negative effects respectively.
4 DISCUSSION 4.1 Structural equation modeling resultsThe results of empirical analysis are shown in Fig. 13. Each measurement variable can well reflect its corresponding latent variable.
As for human disturbance in 1990–2019, the shoreline use intensity had a greater impact on it, followed by the island remoteness, which represented the use intensity of marine and coastal projects based on the island beach and the coastal area around the island. The mean score for human disturbances was marine and coastal engineering development, urban construction and tourism activities, which had a great effect on ecological environment of islands. This is because the ocean and coastal projects directly change the island's coastline, urban and rural construction and the construction of various tourism facilities on the island directly change the island's surface morphology, occupy biological habitat, cause the loss of biomass and productivity, and split the natural landscape. When it comes to tourism, tourists may affect the environment by destroying the habitat and discharging waste.
As for natural conditions in 1990–2019, elevation and coastline proximity had a greater impact on it, indicating that in terms of natural conditions, elevation and the impact from the ocean had a greater impact on the island ecology. This is because the terrain is an important limiting factor of landscape pattern, which can restrict human activities and vegetation spatial distribution; the flat area is greatly affected by human activities, and the vegetation density is low. With the elevation rising, the area of biological habitat increases.
As for ecological effect, NPP and water yield had a great impact on it from 1990 to 2019. NPP was the key variable to characterize plant activities, while water yield represented the water supply of local natural environment, indicating that the ecological effect of Miaodao Archipelago was mainly affected by local vegetation and water yield, because of the unique geographical location and climate environment. Miaodao Archipelago is short of fresh water resources which plays an important role in the island ecosystem. Forest land is an important living environment for animals and plants, and carbon sequestration is also an important part of ecosystem service function, so NPP and water yield have a great impact on island ecological effect.
4.2 Analysis of the influence of human disturbance and natural condition on ecological effectIsland ecosystem is mainly affected by unique conditions and complex system interference. The results show that natural condition has a greater impact on ecological effect, which is positive correlation as a whole, while human disturbance has a smaller impact on ecological effect, which is negative correlation. This is because the special geographical location, limited scale and obvious spatial isolation are the most intuitive characteristics of the island ecosystem and also the most basic conditions of its own. Natural conditions are the basis for the formation and development of the island ecosystem, which does not mean that the impact of human disturbance on the ecological effect can be ignored. The island ecosystem is a natural human complex one, and therefore, with the increase of human activity types, scope, and intensity, the island ecosystem is increasingly affected by human interference, which further aggravates the island ecological vulnerability. We can improve the local ecosystem by artificially controlling and adjusting the natural conditions of the island and moderately restricting human activities.
4.3 Temporal coefficients of variation of standardized coefficientsTable 8 lists the temporal coefficients of variation obtained with the standardized factor loadings and the standardized path coefficients for the years of 1990, 2000, 2010, and 2019. According to Table 8, the time variation coefficient of elevation path standardization coefficient is large, which is 0.311, and its standardization coefficient is increasing year by year, indicating that the elevation has more and more influence on the natural conditions, due to the reason that the terrain is an important limiting factor of landscape pattern and can restrict human activities and the spatial distribution of vegetation. According to the analysis of the landscape pattern of Miaodao Archipelago, the construction land is on the rising trend year by year, which shows that the flat area is greatly affected by human activities and the vegetation density is low. With the increase of altitude, the area of natural and artificial forest and other biological habitats will increase.
|
In this work, the landscape pattern evolution characteristics of the Miaodao Archipelago from 1990 to 2019 were studied and an evaluation index system for the ecological effects of Miaodao Archipelago was constructed based on the PSR model. The effects with human disturbances and under natural conditions on the ecological effect were empirically analyzed with the structural equation modeling. The following conclusions are drawn:
(1) The landscape of the archipelago is dominated by forest, followed by construction land and cropland. Grassland also covers the area in a relatively large scale, and the areas of bare land and shrubland are small. The areas of the islands in the Miaodao Archipelago are obviously different, yet their landscape patterns are generally similar, despite of some differences.
(2) The overall fit of the model meets the requirements. Natural condition has a greater positive impact on the ecological effect, while human interference has a smaller negative impact on the ecological effect. As for the measurement variables of human disturbance intensity, the coastline use intensity and island remoteness play an important role. As for the measurement variables of natural conditions, the influence of elevation and coastline proximity is greater. NPP and water yield have a great influence on the measurement of ecological effect.
(3) There is a time difference between the standardized load coefficient of each measurement variable and the standardized path coefficient of the model from 1990 to 2019. The time variation coefficient of the elevation path standardization coefficient is large, and its standardization coefficient is increasing year by year, which shows that the elevation has more and more influence on the natural conditions.
Based on the above research results and conclusions, the following four suggestions are proposed for island ecological environment protection:
(1) Considering the local conditions, we should strengthen the construction of forestland, shrub or grassland and other biological habitats, build artificial green space and expand the park area, appropriately control the construction land area, and maintain the local ecological balance.
(2) Controlling the construction scale, optimizing the landscape layout, and improving the way of development and utilization are important measures to maintain the stability of island ecosystem.
(3) It is necessary to limit the increase of artificial shorelines, repair the damaged shorelines, control the scale of island and land utilization, optimize the development layout, strengthen the monitoring of marine ecological environment and actively carry out ecological restoration.
(4) Considering different local conditions, new construction land should be limited, reclamation scale should be controlled, urban green space network should be constructed, and damaged habitat restoration should be carried out step by step.
6 DATA AVAILABILITY STATEMENTRadiation calibration, band blending, and island contour extraction were conducted on the satellite remote sensing images of 1990 (LANDSAT 5), 2000 (LANDSAT 5), 2010 (LANDSAT 5), and 2019 (LANDSAT 8) with the spatial resolution of 30 m. The datasets generated and/or analyzed during the current study are available from the corresponding author on reasonable request.
Anderson J C, Gerbing D W. 1988. Structural equation modeling in practice: a review and recommended two-step approach. Psychological Bulletin, 103(3): 411-423.
DOI:10.1037/0033-2909.103.3.411 |
Chen L D, Sun R H, Liu H L. 2013. Eco-environmental effects of urban landscape pattern changes: progresses, problems, and perspectives. Acta Ecologica Sinica, 33(4): 1 042-1 050.
(in Chinese with English abstract) DOI:10.5846/stxb201205070659 |
Chi Y, Shi H H, Guo Z, Ding D W. 2015. Connotation, features and causes of island ecological vulnerability. Acta Oceanologica Sinica, 37(12): 93-105.
(in Chinese with English abstract) DOI:10.3969/j.issn.0253-4193.2015.12.010 |
Chi Y, Shi H H, Wang X L, Qin X B, Zheng W, Peng S T. 2016. Impact factors identification of spatial heterogeneity of herbaceous plant diversity on five southern islands of Miaodao Archipelago in North China. Chinese Journal of Oceanology and Limnology, 34(5): 937-951.
DOI:10.1007/s00343-016-5111-4 |
Chi Y, Shi H H, Wang Y Y, Guo Z, Ma D M. 2017. Evaluation on spatial heterogeneity of island ecosystem carrying capacity — A case study of southern Miaodao Archipelago. China Environmental Science, 37(03): 1 188-1 188.
(in Chinese with English abstract) DOI:10.3969/j.issn.1000-6923.2017.03.047 |
Cook E A. 2002. Landscape structure indices for assessing urban ecological networks. Landscape and Urban Planning, 58(2-4): 269-280.
DOI:10.1016/S0169-2046(01)00226-2 |
Du J, Li P Y. 2010. On the building of risk assessment system for geological hazards of island. Ocean Development and Management, 27(Z1): 80-82.
(in Chinese with English abstract) DOI:10.3969/j.issn.1005-9857.2010.z1.017 |
Fuh B P. 1981. On the calculation of the evaporation from land surface. Scientia Atmospherica Sinica, 5(1): 23-31.
(in Chinese with English abstract) DOI:10.3878/j.issn.1006-9895.1981.01.03 |
Jupiter S, Mangubhai S, Kingsford R T. 2014. Conservation of biodiversity in the Pacific Islands of Oceania: challenges and opportunities. Pacific Conservation Biology, 20(2): 206-220.
DOI:10.1071/pc140206 |
Katovai E, Burley A L, Mayfield M M. 2012. Understory plant species and functional diversity in the degraded wet tropical forests of Kolombangara Island, Solomon Islands. Biological Conservation, 145(1): 214-224.
DOI:10.1016/j.biocon.2011.11.008 |
Li F, Ye Y P, Song B W, Wang R S. 2011. Spatial structure of urban ecological land and its dynamic development of ecosystem services: a case study in Changzhou City, China. Acta Ecologica Sinica, 31(19): 5 623-5 631.
(in Chinese with English abstract) |
Lin M T, Sun H, Guo B. 2010. Landscape pattern change of tourism-type islands in Fujian province: taking Meizhou Island, the Mazu holy land, as an example. Chinese Journal of Ecology, 29(7): 1 414-1 419.
(in Chinese with English abstract) |
Ma X, De Jong M, Sun B Q, Bao X. 2020. Nouveauté or Cliché? Assessment on island ecological vulnerability to Tourism: application to Zhoushan, China. Ecological Indicators, 113: 106247.
DOI:10.1016/j.ecolind.2020.106247 |
McKinney M L. 2002. Urbanization, biodiversity, and conservation. Bioscience, 52(10): 883-890.
DOI:10.1641/0006-3568(2002)052[0883:ubac]2.0.co;2 |
Nogué S, De Nascimento L, Fernández-Palacios J M, Whittaker R J, Willis K J. 2013. The ancient forests of La Gomera, Canary Islands, and their sensitivity to environmental change. Journal of Ecology, 101(2): 368-377.
DOI:10.1111/1365-2745.12051 |
Potter C S, Randerson J T, Field C B, Matson P A, Vitousek P M, Mooney HA, Klooster S A. 1993. Terrestrial ecosystem production: a process model based on global satellite and surface data. Global Biogeochemical Cycles, 7(4): 811-841.
DOI:10.1029/93GB02725 |
Paulay G. 1994. Biodiversity on oceanic islands: its origin and extinction1. American Zoologist, 34(1): 134-144.
DOI:10.1093/icb/34.1.134 |
Qie L, Lee T M, Sodhi N S, Lim S L H. 2011. Dung beetle assemblages on tropical land-bridge islands: small island effect and vulnerable species. Journal of Biogeography, 38(4): 792-804.
DOI:10.1111/j.1365-2699.2010.02439.x |
Särkinen T, Pennington R T, Lavin M, Simon M F, Hughes C E. 2012. Evolutionary islands in the Andes: persistence and isolation explain high endemism in Andean dry tropical forests. Journal of Biogeography, 39(5): 884-900.
DOI:10.1111/j.1365-2699.2011.02644.x |
Shi H H, Wang X L, Wang A, Liu Z Y, Ma D M. 2013. Storage and drivers of forests carbon on the Beichangshan Island of Miaodao Archipelago. Acta Ecologica Sinica, 33(19): 6 363-6 372.
(in Chinese with English abstract) DOI:10.5846/stxb201305291220 |
Shi H H, Zheng W, Wang X L, Huo Y Z, Chi Y. 2017. Investigation and Assessment of Carbon Sequestration Biological Resources of Typical Island Ecosystems in Northern China. Ocean Press, Beijing. p. 42-43. (in Chinese)
|
Shimizu Y. 2005. A vegetation change during a 20-year period following two continuous disturbances (mass-dieback of pine trees and typhoon damage) in the Pinus-Schima secondary forest on Chichijima in the Ogasawara (Bonin) Islands: which won, advanced saplings or new seedlings?. Ecological Research, 20(6): 708-725.
DOI:10.1007/s11284-005-0087-0 |
Sun R, Wu Z X, Chen B Q, Yang C, Qi D L, Lan G Y, Fraedrich K. 2020. Effects of land-use change on eco-environmental quality in Hainan Island, China. Ecological Indicators, 109: 105777.
DOI:10.1016/j.ecolind.2019.105777 |
Sun S G, Kang J, Wang W W, Wang C J, Fu Y B, Li P Y, Suo A N. 2015. Effect of topographical factors on spatial characteristics of island vegetation landscape heterogeneity: a case study with Dachangshan Island. Chinese Journal of Ecology, 34(6): 1 705-1 712.
(in Chinese with English abstract) |
Tzanopoulos J, Vogiatzakis I N. 2011. Processes and patterns of landscape change on a small Aegean island: the case of Sifnos, Greece. Landscape and Urban Planning, 99(1): 58-64.
DOI:10.1016/j.landurbplan.2010.08.014 |
Vogiatzakis I, Pungetti G, Mannion A M. 2008. Mediterranean Island Landscapes. Springer, Dordrecht, https://doi.org/10.1007/978-1-4020-5064-0.
|
Wang C Y, Zhang J, Xin H M, Fu J. 2008. Ecological risk assessment of island exploitation based on landscape pattern. Acta Ecologica Sinica, 28(6): 2 811-2 817.
(in Chinese with English abstract) DOI:10.3321/j.issn:1000-0933.2008.06.045 |
Wang X L, Wang A, Shi H H, Zheng W, Zhou R. 2014. Discussion of carbon sequestration estimates in the island terrestrial ecosystems. Acta Ecologica Sinica, 34(1): 88-96.
(in Chinese with English abstract) DOI:10.5846/stxb201304280857 |
Wischmeier W H, Smith D D. 1958. Rainfall energy and its relationship to soil loss. Transactions, American Geophysical Union, 39(2): 285-291.
DOI:10.1029/tr039i002p00285 |
Yang J, Zhu Y L, He R. 2016. SEM model and evaluation method for operational effectiveness assessment of equipment system. Command Control and Simulation, 38(2): 33-36.
(in Chinese with English abstract) DOI:10.3969/j.issn.1673-3819 |