 2021, Vol. 39
Institute of Oceanology, Chinese Academy of Sciences
Article Information
- YIN Ziyao, LI Junsheng, HUANG Jue, WANG Shenglei, ZHANG Fangfang, ZHANG Bing
- Steady increase in water clarity in Jiaozhou Bay in the Yellow Sea from 2000 to 2018: Observations from MODIS
- Journal of Oceanology and Limnology, 39(3): 800-813
- http://dx.doi.org/10.1007/s00343-020-0124-4
Article History
- Received Mar. 27, 2020
- accepted in principle May. 25, 2020
- accepted for publication Jul. 10, 2020


2 University of Chinese Academy of Sciences, Beijing 100049, China;
3 College of Geomatics, Shandong University of Science and Technology, Qingdao 266590, China;
4 Institute of Remote Sensing and Geographic Information System, Peking University, Beijing 100871, China
Water clarity (or water transparency) is an important parameter that indicates the degree of turbidity, a key ecological index that is indicative of the light transmission capacity of water (Lee et al., 2018; Shi et al., 2018). It also serves as a basic parameter in water quality investigations. Monitoring temporal and spatial changes in water clarity is of great importance to studies on water optical parameters, physical and chemical properties, water quality changes, and water eutrophication (Gong, 2012; Bukata, 2013; Yu et al., 2014). Water clarity is traditionally monitored using the Secchi disk method, which is also known as the Secchi disk depth (Zsd, unit: m). The black-white Secchi disk with a diameter generally about 30 cm is gradually lowered into the water at the surface until it disappears out of the observer's sight. Here, the vertical distance between the observer's sight and water surface is the Zsd of the water body. Although this method is simple to perform, the obtained data are discontinuous, the experiments are time-consuming and expensive, and real-time synchronization suffers from poor quality (Gong, 2012; Lee et al., 2018). However, remote sensing technology can acquire macroscopic, timely, accurate, and periodic data for a wide range of Zsd distribution characteristics, especially in areas where access is diffcult to monitor. Therefore, remote sensing technologies have gradually become an important and effective means to monitor water clarity (Chen et al., 2007; Gong, 2012; Bukata, 2013; Lee et al., 2018).
Over the past 30 years, numerous studies have shown that the Zsd distribution in both open ocean and inland waters can be obtained from different types of remote sensing satellite data, including SeaWiFS, MODIS, MERIS, and Landsat TM/ETM+/OLI. At present, these studies have used remote sensing satellite data to retrieve Zsd characteristics and proposed various remote sensing methods. One of these methods is a semi-analytical model based on physical theories, such as a model based on the classic underwater visibility theory (Duntley, 1960), a second based on the diffuse attenuation coeffcient (Kd, /m) (Bukata et al., 1988; Kratzer et al., 2003; Aas et al., 2014; Alikas et al., 2015), and a third based on the remote sensing reflectance (Rrs(λ)), which corresponds to the spectral wavelengths from the visible domain (410-665 nm) (Lee et al., 2015, 2016). Finally, there is an empirical or semi-empirical model based on the use of band or band combinations, the band/band combination, or spectral coeffcients, which include green band algorithms at approximately 550 nm (Binding et al., 2007), red band algorithms at approximately 645 nm (Shi et al., 2018), blue-red band ratio algorithms (Kratzer et al., 2008; Olmanson et al., 2008), spectral coeffcient algorithms based on the surrounding baseline area and spectral curves in the 430- and 750-nm bands (Thiemann and Kaufmann, 2002), and algorithms based on the Forel-Ule index (FUI) and hue angle (α) (Van der Woerd and Wernand, 2015; Wang et al., 2015). Some Zsd retrieval algorithms have been applied to analyze the temporal and spatial variations of water clarity in many areas (Barnes et al., 2013; Shang et al., 2016; Hou et al., 2017). Remote sensing technology plays an important role in the analysis of temporal and spatial variations of Zsd, and it can also explore the causes for such changes.
Jiaozhou Bay is a semi-enclosed bay located in the southern coast of the Shandong Peninsula, China. It is the largest semi-enclosed bay of China, in Qingdao City, one of the biggest industrial cities in the northern China. With rapid coastal economic development, a large number of artificial buildings, such as aquaculture ponds, salt ponds, ports, wharves, and bridges, have gradually been built in the Jiaozhou Bay area, which has resulted in the gradual transformation of most of the coastline from natural to artificial areas (Zhang et al., 2015). In addition, Jiaozhou Bay has been eutrophicated over the last 30 years. (Jiao, 2001; Shen, 2001; Han et al., 2011). The Jiaozhou Bay Bridge, which was built in 2007, has also had a major impact on the hydrodynamic environment of Jiaozhou Bay. Collectively, Jiaozhou Bay is an ideal study site to investigate the natural and anthropogenic influences on the variation of water quality. Zsd distribution characteristics will provide additional information regarding water mass analysis, stream identification, marine primary productivity, and regional oceanography for the waters that surrounding Jiaozhou Bay, as well as for environmental assessments and ecological protection planning. However, there is a lack of information on the temporal and spatial distribution of Zsd in Jiaozhou Bay, and its natural and anthropogenic driving forces.
Based on MODIS data, we monitored the temporal and spatial changes in Zsd in Jiaozhou Bay from 2000- 2018 and analyzed its main influencing factors. First, we tested and optimized the Zsd retrieval model suitable for Jiaozhou Bay and then produced the Zsd product for Jiaozhou Bay from 2000-2018. In addition, we analyzed the influence that the environment (water depth), climate (wind speed, precipitation, and river discharge), and human activities have on the annual and spatial variations of Zsd in Jiaozhou Bay.
2 DATA AND METHOD 2.1 Data 2.1.1 Study areaJiaozhou Bay (36°06'N-36°25'N; 120°10'E- 120°37'E; Fig. 1) is located in Qingdao, Shandong Peninsula, China. The coastal administrative regions include districts of Shinan, Shibei, Licang, Chengyang, Laoshan, Jimo, Huangdao, and Jiaozhou. Jiaozhou Bay covers an area of nearly 500 km2 and is characterized by a complex underwater topography. The average water depth is approximately 7 m, with a maximum water depth of approximately 64 m (Song et al., 2015; Zhao et al., 2015). The main rivers flowing to Jiaozhou Bay include the Dagu, Moshui, Baisha, and Yanghe rivers. Due to the advancement of economic activities, and Qingdao City's recent population increase, these rivers have become discharge trenches for industrial and domestic waste waters (Shen, 2001; Liu et al., 2011).

|
| Fig.1 Locations of sampling, meteorological, and hydrological stations in Jiaozhou Bay |
The observed Zsd data in Jiaozhou Bay were obtained from the Jiaozhou Bay Marine Ecosystem Research Station (http://jzw.qdio.cas.cn/). A total of 29 water samples from stations S1-S12 were collected on the following dates: December 11, 2008 (7 Zsd measurements), July 15, 2009 (7 Zsd measurements), December 17, 2010 (7 Zsd measurements), August 19, 2013 (3 Zsd measurements), and September 10, 2015 (5 Zsd measurements) (Fig. 1). The Zsd values were measured using a standard black-white disk of 30 cm.
2.1.3 Remote sensing dataThe remote sensing data selected in this study was derived from MODIS-Terra data, which was launched in 2000. Therefore, we can perform long-term time series analysis using this data, which is the case for previous studies that have successfully applied this data to analyze turbid offshore and inland waters (Feng et al., 2012; Li et al., 2017; Wang et al., 2018). The MODIS surface reflectance product (MOD09) provided 500-m spatial resolution data at seven bands across the visible, near-infrared, and short-wave infrared wavelengths. Five scenes of MOD09 images, which were concurrent with the in-situ data, were used to calibrate and validate the Zsd estimation model. The calibrated and validated Zsd estimation model was then applied to the 8-day composite MOD09 products, which are called MOD09A1 products. The reason why MOD09A1 was used in this paper is that it can provide data over a longer time range than MYD09A1. Also, it has been used for long-term and large-area water quality monitoring research as this dataset is well georeferenced, synthesized, and cloud marked (Feng et al., 2012; Wu et al., 2013; Li et al., 2016; Hou et al., 2017; Klein et al., 2017; Wang et al., 2018). The MOD09A1 data, which covered Jiaozhou Bay from 2000-2018, was obtained from the U.S. NASA Goddard Space Flight Center (GSFC, http://oceancolor.gsfc.nasa.gov/). The MOD09A1 data contains 868 good-quality scenes (spring: 209 scenes, summer: 209 scenes, autumn: 228 scenes, winter: 222 scenes) that were selected after visual examination and exclusion of scenes that were affected by clouds, sun glint, and thick aerosols.
2.1.4 Meteorological and hydrological dataWe obtained daily average wind speed and precipitation data from 2000-2017 from the China Meteorological Data Network (http://data.cma.cn), which was collected from the nearest meteorological station (Qingdao Station) in Jiaozhou Bay. This was done in order to analyze the factors that affect the temporal and spatial variations in Zsd. The daily average wind speed during the day of in-situ measurements was less than 4 m/s, and the water surface was relatively calm. Therefore, it can be considered that the value of Zsd did not change considerably within hours of the difference between the in-situ measured data and the MODIS retrieved data. We also obtained monthly average river discharge data from the Nancun Hydrological Station in Dagu River from 2000-2013.
2.2 MethodTo determine an appropriate Zsd retrieval algorithm for Jiaozhou Bay, the MOD09A1 images first required preprocessing, followed by calibration and the testing of various retrieval methods based on satellite-ground synchronous data.
2.2.1 Data pre-processingThe MOD09A1 data required a series of pre-processing, including water-leaving reflectance correction and water body identification and extraction.
MODIS surface reflectance products (MOD09) were first atmospherically corrected for effects from atmospheric gases, aerosols, thin cirrus clouds, and for land adjacency effects (Vermote and Vermeulen, 1999). But the MOD09 data was still inadequate to monitor water quality parameters because of the effects of residual aerosol scattering, solar flares, and skylight reflection. In this study, a method was adopted to reduce noise in the MOD09 data and convert it into Rrs(λ) by subtracting the near-infrared (NIR) minimum value from the shortwave infrared (SWIR) band and dividing by π (Wang et al., 2016). Previous studies have shown that this method easily and steadily yields good performance when calculating Rrs(λ) for different inland water bodies with exposure to different conditions (Wang et al., 2016, 2018).
Due to influences from changes in water volume, the water boundary, to a certain extent, is characterized by dynamic changes. Therefore, we used the modified histogram bimodal method (MHBM) to segment the water body (Zhang et al., 2018) based on the reflectance of the short wave infrared remote sensing data in the 1 640 nm band. In order to reduce the effect of adjacent land pixels (which have a higher reflectance) the coastline was extended seawards by two pixels (Feng and Hu, 2017).
2.2.2 Calibration and validation of Zsd modelsOut of the 29 measured Zsd data samples, 20 were selected as the training samples to construct the model. The nine remaining samples were used as test samples to verify the model. Satellite products and field measurements have different temporal and spatial resolutions. It is necessary to determine a reasonable spatiotemporal window according to the spatial resolution of satellite products, as well as the spatiotemporal variation and uniformity of water bodies. Means of effective pixels in the spatial window and effective field measurements in the time window were taken as matching data pairs and incorporated into the validation data set. Several criteria were followed in obtaining matching pairs (Le et al., 2013; Feng et al., 2015). First, the time difference between field measurements and remote sensing images should be within ±3 h, and the wind speed during the day should be less than 4 m/s. Second, the water around the observation station should be uniform. Thus, a 3×3 pixel window centered on the measured site was selected. If the number of effective pixels, not including cloud and sun-glint, in the window exceeds five and the coeffcient of variation (CV) of the effective pixels is less than 0.4, the average pixel value of the window is calculated as the final value.
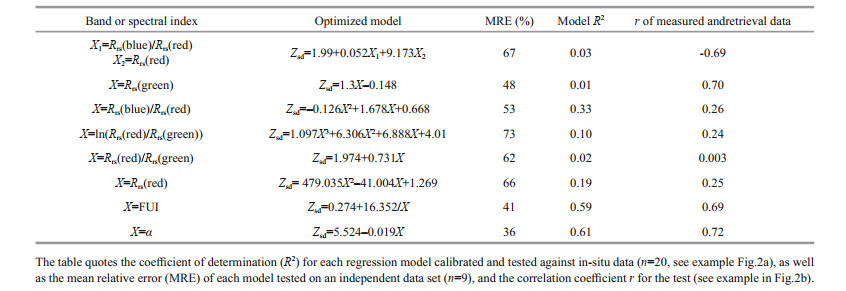
To obtain the optimal model to retrieve the Zsd values in Jiaozhou Bay based on the MODIS data, we used the 20 training samples to calibrate several commonly used Zsd estimation models, including the red band algorithms (Shi et al., 2018), blue-red band ratio algorithms (Kratzer et al., 2008; Olmanson et al., 2008), green band algorithms (Binding et al., 2015), red-green band ratio algorithms (Duan et al., 2009; Ren et al., 2018), the Forel-Ule index (FUI), and the hue angle (α) algorithms (Van der Woerd and Wernand, 2015; Wang et al., 2015). The R2 value for each model was calculated. Using the test samples, we then calculated the mean relative error (MRE) and correlation coeffcient (r) of the measured and retrieved data (Table 1). MRE was defined as follow:
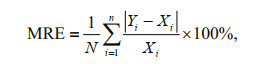 (1)
(1)
|
where Yi and Xi are the derived Zsd and field measurements Zsd, respectively. N is the number of matchups.
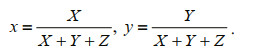
Out of these algorithms, the methods based on the FUI and α were the most complex. To obtain these two parameters, we used the Red, Green, Blue (RGB) conversion method to calculate X, Y, Z in the International Commission on Illumination (Commission Internationale de l'Eclairage, CIE) color system using the Rrs(λ) of three visible bands (469, 555, and 645 nm) (CIE, 1931; Wang et al., 2015; Li et al., 2016).
 (2)
(2)The CIE chromaticity coordinates (x, y) were obtained by normalizing X, Y, and Z to 0 and 1 as follows (CIE, 1931; Wang et al., 2015).
 (3)
(3)The hue angle α were calculated by the new definition in Wang et al. (2018), which has positive range from 0 to 2π from the downward x axis clockwise:
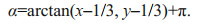 (4)
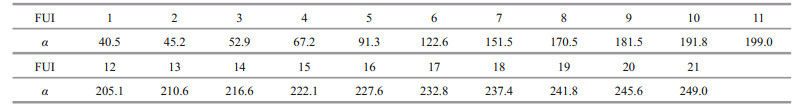
(4)To eliminate systematic deviation caused by hyperspectral Rrs(λ) and the equivalent MODIS bands, the corrected hue angle α was obtained using the method reported in Wang et al. (2018), which was based on the methods proposed in Van der Woerd and Wernand (2015), but with the new definition of α start axis and direction. Finally, the FUI was calculated using the lookup table (Table 2) based on the corrected hue angle α, which is transformed from the look-up-table in Novoa et al. (2013) with the new definition of α start axis and direction.
|
By comparison, we observed that the Zsd retrieval model based on α had the highest accuracy, with a model MRE of 36%, as well as elevated model and test R2 values compared with the other models. This indicates that, compared with other commonly used Zsd retrieval models, the model based on α had higher retrieval accuracy and was more suitable for Zsd retrieval in the Jiaozhou Bay area. Zsd showed a linear decrease with increasing hue angle α (Fig. 2a). There was a negative correlation between Zsd and α, with a model R2 of 0.61. Equation 1 defines the developed model:
 (5)
(5)

|
| Fig.2 Calibration (a) and validation (b) of the proposed model to estimate Zsd in Jiaozhou Bay |
The paired data were characterized by a significant correlation that was predominantly located near the 1:1 line (Fig. 2b; R2=0.518), which demonstrated that the model was effective and can be used to derive the Zsd in Jiaozhou Bay. Therefore, the model based on α was chosen for the derivation and the further analysis of the Zsd in Jiaozhou Bay.
3 RESULTBased on the MOD09A1 products that cover Jiaozhou Bay from 2000-2018, the long-term Zsd product for Jiaozhou Bay was derived using the established retrieval model based on α. Based on this product, we analyzed the Zsd temporal and spatial distribution and variation characteristics in Jiaozhou Bay.
3.1 Temporal variation in Zsd 3.1.1 Seasonal variationThe Zsd in Jiaozhou Bay varied significantly, ranging from a minimum value of 1.8 m in the spring of 2000 to a maximum value of 2.5 m in the winter of 2012, with a mean long-term Zsd mean value of 2.1 m (Fig. 3). Over the past 19 years, the Zsd of Jiaozhou Bay has been slowly increasing, but there were no obvious seasonal variations. The Zsd in summer (June- August) and winter (December-February) were higher than that in spring (March-May) and autumn (September-November), but the seasonal variations were not stable from year to year.

|
| Fig.3 Mean MODIS seasonal time series and Zsd linear regression line from 2000-2018 |
The mean annual Zsd was lowest in 2000, which was 1.8 m, and the highest in 2016, which was 2.2 m (Figs. 4 & 5). The mean annual Zsd in Jiaozhou Bay from 2000-2018 showed a significant upward trend (R2=0.78, P < 0.01), with a mean annual increase of 0.02 m. However, there was a sharp decline in the Zsd in 2008 that deviated from the inter-annual trend line (Fig. 5). Annual Zsd in Jiaozhou Bay was inversely correlated with wind speed (R2=0.65, P < 0.01).

|
| Fig.4 MODIS-derived mean annual Zsd in Jiaozhou Bay from 2000 to 2018 The Secchi depth has steadily increased over the observation period, indicating an improvement in water quality. |

|
| Fig.5 Mean annual MODIS-derived Zsd from 2000-2018 and mean annual wind speeds measured at Qingdao meteorological station from 2000-2017 Zsd was inversely correlated with wind speed (R2=0.65, P < 0.01). |
The MODIS derived Zsd data from 2000-2018 were averaged to calculate the Zsd distribution in Jiaozhou Bay (Fig. 6a). Zsd in Jiaozhou Bay gradually increased from the northwest to the southeast. The Zsd was highest in the southeastern region near the open sea area while the lowest value was in the northwest coastal estuary. The Zsd spatial distribution in Jiaozhou Bay was consistent for each year (Fig. 4).

|
| Fig.6 Spatial distribution of Zsd in Jiaozhou bay based on the average Zsd estimates from all MODIS data collected during 2000-2018 (a) and the spatial distribution of the mean CV in Jiaozhou bay based on all Zsd estimates from the MODIS data collected during 2000-2018 (b) |
The spatial distribution of CV was also calculated from the MODIS derived Zsd values from 2000-2018 (Fig. 6b). The CV increased from the inside to the outside of Jiaozhou Bay, ranging from 0 to 82%, with an average of 27%. This demonstrated that there was a certain Zsd spatial variation. The lowest Zsd values and the largest CV values were found in the coastal areas of Jiaozhou Bay that are connected to inland regions by several rivers and streams, while the lowest values were observed in the middle of Jiaozhou Bay. This indicates that Zsd variations in the coastal areas of Jiaozhou Bay which are strongly influenced by humans activities and coastal runoff.
4 DISCUSSION 4.1 Driving factorThe above results demonstrate that Zsd values in Jiaozhou Bay had clear temporal and spatial variations. We attempted to analyze the influence that the topography (water depth), hydrological (wind speed, precipitation, and river discharge), and human activities have on the annual, seasonal, and spatial variations of Zsd in Jiaozhou Bay.
4.1.1 Water depthXue et al. (2015) reported that water depth and runoff had the greatest impact on the Zsd distribution in Chinese offshore waters. Based on the water depth distribution map of Jiaozhou Bay reported in Ye et al. (2009), we divided it into five levels from low to high (Fig. 6a) and superimposed it with the mean Zsd from 2000-2018 to calculate the mean Zsd of each water depth level area.
Zsd in Jiaozhou Bay noticeably increased with increasing water depths (Fig. 6a). The mean Zsd of the five regions in Fig. 6a was 1.6, 1.7, 1.9, 2.0, and 2.1 m, with low and high Zsd values at nearshore and offshore locations, respectively, which indicates that water depth is an important factor that affects the Zsd spatial distribution in Jiaozhou Bay. Shallow depths are usually found in near-coastal areas while deeper waters are found in the inner bay. Coastal runoff transports a large amount of suspended sediment to the sea. In shallow coastal areas bottom sediments are easily re-suspended when exposed to waves and currents, which increases the concentration of suspended solids in the water column. The water depth mainly affects the spatial distribution of Zsd but seems to have little effect on the temporal variations in Zsd (Figs. 4 & 6).
4.1.2 Wind speedThe inter-annual variations in the Zsd values had a negative correlation with wind speed (R2=0.649, P < 0.01; Fig. 7a) indicating that lower wind speeds corresponded to higher Zsd values. This is possibly due to the fact that increased wind speeds in Jiaozhou Bay facilitate resuspension and transportation of sediments deposited on the seabed, thus leading lower Zsd values (Booth et al., 2000; Gao et al., 2017; Feng et al., 2019). Therefore, the significant inter-annual Zsd fluctuations in Jiaozhou Bay may also be due to inter-annual variations in wind or sand resuspension. Based on the annual Zsd variations in Jiaozhou Bay (Fig. 5), Zsd has been significantly higher since 2015 compared with the years before 2015, which is due to lower wind speeds between 2015 and 2018 compared with previous years. The results clearly suggest that wind speed is an important factor affecting the inter-annual Zsd variations in Jiaozhou Bay.

|
| Fig.7 Relationship between the mean annual MODIS-derived Zsd in Jiaozhou Bay and mean annual wind speed (a) and precipitation (b) from 2000 to 2017; the relationship between the mean annual MODIS-derived Zsd in Jiaozhou Bay and mean annual river discharge from 2000 to 2013 |
Precipitation data were averaged with respect to year and compared with the mean annual Zsd (Fig. 7b). We observed that the correlation between these parameters was not significant for the annual time scales (R2=0.044, P=0.40). The analysis showed that precipitation has a relatively small effect on the Zsd in Jiaozhou Bay and thus is not a key factor influencing inter-annual Zsd variations in Jiaozhou Bay. This is normal, because precipitation mainly affects the short-term change in Zsd, but not the long-term change such as inter-annual change (Song et al., 2015).
For the relationship between river discharge and Zsd in Jiaozhou Bay, we must consider the 16 rivers that flow into Jiaozhou Bay, which include the Dagu, Moshui, Baisha, Yanghe, and Licun rivers. Out of these rivers, Dagu River has the largest catchment area, which occupies 82% of the total catchment area of the Jiaozhou Bay river system (Jiang and Wang, 2013). Average monthly river discharge from Nancun Hydrological Station, which exists for 2000-2013, was used to analyze the relationship. Nancun Hydrological Station is located in the middle and lower reaches of the main stem of the Dagu River. Nancun is the closest station to the lower reaches of the Dagu River, with long-term river discharge data, and is representative of the overall flow characteristics in the basin. Dagu River is a river that is mostly fed by precipitation, and thus is subject to strong fluctuations in water levels. The flood season for the Dagu River occurs in the summer.
Using the same method to analyze the relationship between the mean annual river discharge and Zsd (Fig. 7c), we found that there was no clear correlation between these parameters (R2=0.018, P=0.65). This suggests that the influence that river discharge has on Zsd in Jiaozhou Bay is not significant, as well as the fact that river discharge is not the main factor that affects annual variations in Jiaozhou Bay.
4.1.4 Human activityHuman activity has an important impact on the temporal and spatial Zsd variations in Jiaozhou Bay. Zsd can also reflect changes, to a certain extent, in ecological environments in Jiaozhou Bay, which is of great significance to urban development planning. Zsd variations in the bay were mainly concentrated in coastal areas, whereas variations in the center of the bay were relatively small. This is likely due to the fact that coastal areas are more directly affected by anthropogenic factors, such as industrial pollution.
During the construction of the Jiaozhou Bay Bridge (2007-2010), Zsd values in the Jiaozhou Bay decreased compared with those of previous years, reaching their lowest level in 2008, which was only 1.9 m. After the bridge was completed and opened to traffc, the Zsd values displayed an upward trend. The mean Zsd during bridge construction was 2.0 m, while that after bridge construction was 2.1 m, mainly due to the construction of Jiaozhou Bay Bridge, which offcially began in 2007 and was completed the following year. A large number of operations associated with bridge foundations churned the water, which resulted in a sharp decline in the mean annual Zsd value in 2008. With the completion of the bridge, the Zsd value in the Jiaozhou Bay area began to gradually rise beginning in 2009. Relevant studies have shown that the construction of the Jiaozhou Bay Bridge has affected the hydrodynamic conditions in Jiaozhou Bay (Zhang et al., 2015) and further affected the spatial and temporal distribution of sea ice in Jiaozhou Bay in the winter (Huang et al., 2019). We infer that the changes in the hydrodynamic conditions in Jiaozhou Bay caused by the construction of the sea-crossing bridge, as well as operations, such as bridge piling, will cause sediment resuspension, which also has an impact on the Zsd distribution. Based on our analyses, it is clear that human activity rapidly changes the Zsd, such that human activity has an important impact on short-term annual Zsd variations in Jiaozhou Bay.
4.1.5 Summary of driving factorThe spatial Zsd distribution in Jiaozhou Bay displayed a trend of elevated values in the southeast and lower values in the northwest. The water depth distribution had a trend of high values in the southeast and decreased values in the northwest. In contrast, the northwestern region of Jiaozhou Bay is contiguous with inland areas, and is significantly influenced by human activity, such as industrial pollution, while the southeastern areas connect with the sea, such that the water is relatively clean. In addition, rivers along the coast, such as the Dagu, Moshui, and Baisha rivers, are mainly located in the northwestern and northern parts of Jiaozhou Bay. Therefore, when it rains, rivers have a greater effect on the northwest region, where changes in the river discharge contribute to changes in Zsd. Compared with wind, rainfall and river discharge, it was found that wind speed had a greater impact on the inter-annual Zsd variations in Jiaozhou Bay. Meanwhile, we explored the factors governing seasonal Zsd variations. We calculated the relationships between the seasonal average wind speed, precipitation, and river discharge, and the seasonal average Zsd, and found that the correlations are not strong (R2=0.3, 0.018, and 0.004, respectively). Therefore, there are possibly other factors on the seasonal scale that result in unstable seasonal Zsd variations. In addition, human activity has a significant influence on short-term annual variations in Zsd.
4.2 Uncertainty and future applicationThe biggest challenge associated with the long-term-scale Zsd retrieval model lies in its application to regional and seasonal scales, especially the stability of retrieval model in turbid waters. The commonly used quasi-analytical algorithm (QAA) based Zsd retrieval model requires Rrs products (Lee et al., 2002), but because of the highly turbidity of Jiaozhou Bay, there is no available Rrs products. Therefore, only the surface reflectance product MOD09A1 can be used, but MOD09A1 only has 469, 555, 645, and 859 available bands, so QAA algorithm cannot be used. Therefore, other empirical or semi-empirical methods should be used. The theoretical basis for Zsd retrieval using the hue angle α, is that water with different Zsd values exhibiting different hues, where α can more accurately capture this change in information. Compared with other commonly used models, we observed that the model based on the hue angle had a higher accuracy with respect to Zsd retrieval in Jiaozhou Bay. Therefore, a regional model suitable for the inversion of Zsd in Jiaozhou Bay was proposed based on α.
Some studies have shown that there is good correlation between water color and Zsd (Novoa et al., 2013; Van der Woerd and Wernand, 2015; Li et al., 2016; Wang et al., 2018). However, there are some limitations in the method of Zsd based on FUI or α. The color of water is mainly determined by the total absorption spectrum of suspended matter, chlorophyll a, colored dissolved organic matter (CDOM), and pure water. When the optical properties of water are dominated by suspended matter, CDOM, or pure water, it is not easy to have the same color corresponding to different Zsd values. However, when algae blooms occur, phytoplankton dominates the total absorption spectrum of the water, such that the color of the water does not change monotonously with the wavelength and the same color may correspond to different Zsd values. Fortunately, for Jiaozhou Bay, which has no large-scale and long-term water bloom and whose absorption spectrum is dominated by suspended matter, the same water color does not correspond to different Zsd. The atmospheric correction effect for remote sensing images is another challenge to water quality parameter retrieval. In this study, we adopted a correction method using the water-leaving reflectance based on the MODIS surface reflectance product, which essentially meets the retrieval requirements for the Jiaozhou Bay water-leaving reflectance. Furthermore, several previous and related studies have indicated that α was less sensitive to observation conditions and aerosol types (Wang et al., 2018; Pitarch et al., 2019). In addition, the α value used in this model was derived from the corrected synchronous MODIS surface reflectance products, rather than the measured water-leaving reflectance, which could further reduce the impact that the atmosphere has on the retrieval results. Therefore, the Zsd retrieval model using the MODIS hue angle α, can largely avoid the uncertainty associated with atmospheric correction.
Note that the accuracy of the measured Zsd data may affect the model, especially in water characterized by high Zsd values. The Zsd measurements are vulnerable to wind speed, wave, and even ship navigation, which may lead to associated uncertainties. Therefore, high-precision data measurements will reduce model uncertainty. More measured data can further improve the Zsd retrieval model. At the same time, the satellite transit time may be different from the measurement time (e.g., more than 3 h), which will also lead to certain errors in the Zsd retrieval results (Feng et al., 2012).
Due to the complex water environment in Jiaozhou Bay, it is diffcult to accurately obtain the characteristic changes in Zsd using traditional field surveys. In this study, for the first time through the analysis of Zsd MOD09A1 images in Jiaozhou Bay from the past 19 years, we were able to decipher the significant temporal and spatial changes in Zsd in Jiaozhou Bay and its driving factors. Although the MODIS data is characterized by strong stability and the advantages of a global data product service, its spatial resolution is not suffcient to monitor small bodies of water. With the atmospheric correction for high spatial and spectral resolution remote sensing data, such as Landsat-8 OLI and the production of water products, the algorithm established in this study can be used with new sensor images to cover more water bodies, which can provide new possibilities and challenges when evaluating Zsd changes in Jiaozhou Bay, as well as providing certain theoretical support to environmental assessments and ecological protection decision-making for the relevant governmental departments.
5 CONCLUSIONIn this study, using an eight-day composite MODIS-Terra surface reflectance product (MOD09A1), we established a model to derive the Zsd in Jiaozhou Bay using the CIE color space parameter of hue angle α. Using this model, we obtained the Zsd products in Jiaozhou Bay from 2000 to 2018. We investigated the temporal and spatial distribution characteristics of the Zsd in Jiaozhou Bay, as well as an analysis of its main influencing factors. The main conclusions of this study are as follows:
(1) The mean inter-annual Zsd in Jiaozhou Bay from 2000-2018 ranged from 1.8 m to 2.5 m, with a mean value of 2.1 m. The variations in Zsd with time showed an upward trend, with a mean annual increase of 0.02 m. Comparing wind, precipitation, river discharge, and other factors, we found that wind speed has a greater impact on Zsd.
(2) The spatial distribution of Zsd in Jiaozhou Bay was stable, showing high values in the southeast and low values in the northwest, where variations in Zsd in coastal areas were much larger than those in the inner bay. Water depth was an important factor that caused the spatial distribution of Zsd in Jiaozhou Bay. Deeper waters yield higher Secchi depths whilst more shallow areas are more influenced by resuspension of bottom sediments.
(3) Human activity has also caused changes in Zsd to a certain extent, where human activity, such as the large-scale construction of artificial facilities, has an impact on the short-term annual variations in Zsd.
This study shows that the Zsd retrieval model based on hue angle α can be applied to turbid water. Although we only selected Jiaozhou Bay to test this model, we suggest that this method can be extended to other water bodies with similar optical characteristics and ranges in Secchi depth, such as Liaodong Bay, Bohai Bay, and Laizhou Bay to explore their Zsd distributions. This study also shows that this method is a support tool for environmental managers to improve decision-making and governmental policies in Jiaozhou Bay.
6 DATA AVAILABILITY STATEMENTThe data of this study are available from the Jiaozhou Bay Marine Ecosystem Research Station but restrictions may apply due to the availability of some of the data that were used under license for this study, and thus, they are not publicly available. The data are however available from the authors upon reasonable request and with permission from the Jiaozhou Bay Marine Ecosystem Research Station.
7 ACKNOWLEDGMENTThe authors would like to thank NASA GSFC for providing MODIS data, and we are also grateful to Jiaozhou Bay Marine Ecosystem Research Station for providing in-situ Zsd data.
Aas E, Høkedal J, Sørensen K. 2014. Secchi depth in the Oslofjord-Skagerrak area: theory, experiments and relationships to other quantities. Ocean Science, 10(2): 177-199.
DOI:10.5194/os-10-177-2014 |
Alikas K, Kratzer S, Reinart A, Kauer T, Paavel B. 2015. Robust remote sensing algorithms to derive the diffuse attenuation coeffcient for lakes and coastal waters. Limnology and Oceanography: Methods, 13(8): 402-415.
DOI:10.1002/lom3.10033 |
Barnes B B, Hu C M, Schaeffer B A, Lee Z P, Palandro D A, Lehrter J C. 2013. MODIS-derived spatiotemporal water clarity patterns in optically shallow Florida Keys waters: a new approach to remove bottom contamination. Remote Sensing of Environment, 134: 377-391.
DOI:10.1016/j.rse.2013.03.016 |
Binding C E, Greenberg T A, Watson S B, Rastin S, Gould J. 2015. Long term water clarity changes in North America's great lakes from multi-sensor satellite observations. Limnology and Oceanography, 60(6): 1 976-1 995.
DOI:10.1002/lno.10146 |
Binding C E, Jerome J H, Bukata R P, Booty W G. 2007. Trends in water clarity of the Lower Great Lakes from remotely sensed aquatic color. Journal of Great Lakes Research, 33(4): 828-841.
DOI:10.3394/0380-1330(2007)33[828:TIWCOT]2.0.CO;2 |
Booth J G, Miller R L, McKee B A, Leathers R A. 2000. Wind-induced bottom sediment resuspension in a microtidal coastal environment. Continental Shelf Research, 20(7): 785-806.
DOI:10.1016/S0278-4343(00)00002-9 |
Bukata R P, Jerome J H, Bruton J E. 1988. Relationships among Secchi disk depth, beam attenuation coeffcient, and irradiance attenuation coeffcient for Great Lakes waters. Journal of Great Lakes Research, 14(3): 347-355.
DOI:10.1016/S0380-1330(88)71564-6 |
Bukata R P. 2013. Retrospection and introspection on remote sensing of inland water quality: "Like Déjà Vu All Over Again". Journal of Great Lakes Research, 39 Suppl 1: 2-5.
DOI:10.1016/j.jglr.2013.04.001 |
Chen Z Q, Muller-Karger F E, Hu C M. 2007. Remote sensing of water clarity in Tampa Bay. Remote Sensing of Environment, 109(2): 249-259.
DOI:10.1016/j.rse.2007.01.002 |
CIE. 1931. Commission Internationale de l'Eclairage Proceedings. Cambridge Univ. Press, London, England. p. 19-29.
|
Duan H T, Ma R H, Zhang Y Z, Zhang B. 2009. Remote-sensing assessment of regional inland lake water clarity in Northeast China. Limnology, 10(2): 135-141.
DOI:10.1007/s10201-009-0263-y |
Duntley S Q. 1960. The visibility of submerged objects. Scripps Institution of Oceanography. p. 16-21, https://escholarship.org/uc/item/2mz4d121.
|
Feng L, Hou X J, Zheng Y. 2019. Monitoring and understanding the water transparency changes of fifty large lakes on the Yangtze plain based on long-term MODIS observations. Remote Sensing of Environment, 221: 675-686.
DOI:10.1016/j.rse.2018.12.007 |
Feng L, Hu C M, Chen X L, Tian L Q, Chen L Q. 2012. Human induced turbidity changes in Poyang Lake between 2000 and 2010: observations from MODIS. Journal of Geophysical Research Oceans, 117(C7): C07006.
DOI:10.1029/2011JC007864 |
Feng L, Hu C M, Han X X, Chen X L, Lin Q. 2015. Long-term distribution patterns of chlorophyll-a concentration in China's largest freshwater lake: MERIS full-resolution observations with a practical approach. Remote Sensing, 7(1): 275-299.
DOI:10.3390/rs70100275 |
Feng L, Hu C M. 2017. Land adjacency effects on MODIS a qua top-of-atmosphere radiance in the shortwave infrared: statistical assessment and correction. Journal of Geophysical Research: Oceans, 122(6): 4 802-4 818.
DOI:10.1002/2017JC012874 |
Gao L, Yao H Y, Zhang M M, Ju L, Cao J. 2017. Temporal and spatial variation of seawater transparency and its relationship with environmental factors in Qingdao coastal area. Journal of Marine Sciences, 35(3): 79-84.
(in Chinese) DOI:10.3969/j.issn.1001-909X.2017.03.009 |
Gong P. 2012. Remote sensing of environmental change over china: a review. Chinese Science Bulletin, 57(22): 2 793-2 801.
DOI:10.1007/s11434-012-5268-y |
Han H Y, Li K Q, Wang X L, Shi X Y, Qiao X D, Liu J. 2011. Environmental capacity of nitrogen and phosphorus pollutions in Jiaozhou Bay, China: modeling and assessing. Marine Pollution Bulletin, 63(5-12): 262-266.
DOI:10.1016/j.marpolbul.2010.12.017 |
Hou X J, Feng L, Duan H T, Chen X L, Sun D Y, Shi K. 2017. Fifteen-year monitoring of the turbidity dynamics in large lakes and reservoirs in the middle and lower basin of the Yangtze River, China. Remote Sensing of Environment, 190: 107-121.
DOI:10.1016/j.rse.2016.12.006 |
Huang J, Guo L J, Jiang T, Zhu H C. 2019. Three decades of sea-ice variability in Jiaozhou Bay revealed by Landsat observations. Journal of Ocean University of China, 18(2): 349-357.
DOI:10.1007/s11802-019-3730-z |
Jiang D J, Wang X L. 2013. Variation of runoff volume in the Dagu River basin in the Jiaodong Peninsula. Arid Zone Research, 30(6): 965-972.
(in Chinese) |
Jiao N Z. 2001. Ecological Processes and Sustainable Development of Typical Coastal Water Ecosystems in China. Science Press, Beijing, China. p.241-253.
(in Chinese)
|
Klein I, Gessner U, Dietz A J, Kuenzer C. 2017. Global WaterPack—A 250 m resolution dataset revealing the daily dynamics of global inland water bodies. Remote Sensing of Environment, 198: 345-362.
DOI:10.1016/j.rse.2017.06.045 |
Kratzer S, Brockmann C, Moore G. 2008. Using MERIS full resolution data to monitor coastal waters—a case study from Himmerfjärden, a fjord-like bay in the Northwestern Baltic Sea. Remote Sensing of Environment, 112(5): 2 284-2 300.
DOI:10.1016/j.rse.2007.10.006 |
Kratzer S, Håkansson B, Sahlin C. 2003. Assessing Secchi and photic zone depth in the Baltic Sea from satellite data. AMBIO: A Journal of the Human Environment, 32(8): 577-585.
DOI:10.1579/0044-7447-32.8.577 |
Le C F, Hu C M, Cannizzaro J, English D, Muller-Karger F, Lee Z P. 2013. Evaluation of chlorophyll-a remote sensing algorithms for an optically complex estuary. Remote Sensing of Environment, 129: 75-89.
DOI:10.1016/j.rse.2012.11.001 |
Lee Z P, Arnone R, Boyce D, Franz B, Greb S, Hu C M, Lavender S, Lewis M R, Schaeffer B, Shang S L, Wang M H, Wernand M, Wilson C. 2018. Global water clarity: continuing a century-long monitoring. EOS, 99.
DOI:10.1029/2018EO097251 |
Lee Z P, Carder K, Arnone R A. 2002. Deriving inherent optical properties from water color: a multiband quasi-analytical algorithm for optically deep waters. Applied Optics, 41(27): 5 755-5 772.
DOI:10.1364/AO.41.005755 |
Lee Z P, Shang S L, Hu C M, Du K P, Weidemann A, Hou W L, Lin J F, Lin G. 2015. Secchi disk depth: a new theory and mechanistic model for underwater visibility. Remote Sensing of Environment, 169: 139-149.
DOI:10.1016/j.rse.2015.08.002 |
Lee Z P, Shang S L, Qi L, Yan J, Lin G. 2016. A semi-analytical scheme to estimate Secchi-disk depth from Landsat-8 measurements. Remote Sensing of Environment, 177: 101-106.
DOI:10.1016/j.rse.2016.02.033 |
Li J S, Hu C M, Shen Q, Barnes B B, Murch B, Feng L, Zhang MW, Zhang B. 2017. Recovering low quality MODIS-terra data over highly turbid waters through noise reduction and regional vicarious calibration adjustment: a case study in Taihu Lake. Remote Sensing of Environment, 197: 72-84.
DOI:10.1016/j.rse.2017.05.027 |
Li J S, Wang S L, Wu Y H, Zhang B, Chen X L, Zhang F F, Shen Q, Peng D L, Tian L Q. 2016. MODIS observations of water color of the largest 10 lakes in China between 2000 and 2012. International Journal of Digital Earth, 9(8): 788-805.
DOI:10.1080/17538947.2016.1139637 |
Liu S M, Li R H, Zhang G L, Wang D R, Du J Z, Herbeck L S, Zhang J, Ren J L. 2011. The Impact of Anthropogenic activities on nutrient dynamics in the tropical Wenchanghe and Wenjiaohe estuary and lagoon system in east Hainan. Marine Chemistry, 125(1-4): 49-68.
DOI:10.1016/j.marchem.2011.02.003 |
Novoa S, Wernand M R, Van der Woerd H J. 2013. The Forel-Ule scale revisited spectrally: preparation protocol, transmission measurements and chromaticity. Journal of the European Optical Society Rapid Publications, 8: 13057.
DOI:10.2971/jeos.2013.13057 |
Olmanson L G, Bauer M E, Brezonik P L. 2008. A 20-year Landsat water clarity census of Minnesota's 10, 000 lakes. Remote Sensing of Environment, 112(11): 4 086-4 097.
DOI:10.1016/j.rse.2007.12.013 |
Pitarch J, Van der Woerd H J, Brewin R J W, Zielinski O. 2019. Optical properties of Forel-Ule water types deduced from 15 years of global satellite ocean color observations. Remote Sensing of Environment, 231: 111249.
DOI:10.1016/j.rse.2019.111249 |
Ren J L, Zheng Z B, Li Y M, Lv G N, Wang Q, Lyu H, Huang C C, Liu G, Du C G, Mu M, Lei S H, Bi S. 2018. Remote observation of water clarity patterns in Three Gorges Reservoir and Dongting Lake of China and their probable linkage to the Three Gorges Dam based on Landsat 8 imagery. Science of the Total Environment, 625: 1 554-1 566.
DOI:10.1016/j.scitotenv.2018.01.036 |
Shang S L, Lee Z P, Shi L H, Lin G, Wei G M, Li X D. 2016. Changes in water clarity of the Bohai Sea: observations from MODIS. Remote Sensing of Environment, 186: 22-31.
DOI:10.1016/j.rse.2016.08.020 |
Shen Z L. 2001. Historical changes in nutrient structure and its Influences on phytoplantkon composition in Jiaozhou Bay. Estuarine, Coastal and Shelf Science, 52(2): 211-224.
DOI:10.1006/ecss.2000.0736 |
Shi K, Zhang Y L, Zhu G W, Qin B Q, Pan D L. 2018. Deteriorating water clarity in shallow waters: evidence from long term MODIS and in-situ observations. International Journal of Applied Earth Observation and Geoinformation, 68: 287-297.
DOI:10.1016/j.jag.2017.12.015 |
Song Z J, Gong L M, Chen Q, Gu Z K, Gao L, Huang H J. 2015. Influence on the Environment of the Coastal Area in Jiaozhou Bay of China. Environmental Engineering and Management Journal, 14(8): 1 897-1 903.
DOI:10.30638/eemj.2015.202 |
Thiemann S, Kaufmann H. 2002. Lake water quality monitoring using hyperspectral airborne data—a semiempirical multisensor and multitemporal approach for the Mecklenburg Lake District, Germany. Remote Sensing of Environment, 81(2-3): 228-237.
DOI:10.1016/s0034-4257(01)00345-5 |
Van der Woerd H J, Wernand M R. 2015. True colour classification of natural waters with medium-spectral resolution satellites: SeaWiFS, MODIS, MERIS and OLCI. Sensors, 15(10): 25 663-25 680.
DOI:10.3390/s151025663 |
Vermote E F, Vermeulen A. 1999. Atmospheric correction algorithm: spectral reflectances (MOD09). Algorithm theoretical background. National Aeronautics and Space Administration, p. 18-39, http://modis.gsfc.nasa.gov/data/atbd/atbd_mod08.pdf.
|
Wang S L, Li J S, Shen Q, Zhang B, Zhang F F, Lu Z Y. 2015. MODIS-based radiometric color extraction and classification of inland water with the Forel-Ule scale: a case study of Lake Taihu. IEEE Journal of Selected Topics in Applied Earth Observations and Remote Sensing, 8(2): 907-918.
DOI:10.1109/jstars.2014.2360564 |
Wang S L, Li J S, Zhang B, Shen Q, Zhang F F, Lu Z Y. 2016. A simple correction method for the MODIS surface reflectance product over typical inland waters in China. International Journal of Remote Sensing, 37(24): 6 076-6 096.
DOI:10.1080/01431161.2016.1256508 |
Wang S L, Li J S, Zhang B, Spyrakos E, Tyler A N, Shen Q, Zhang F F, Kuster T, Lehmann M K, Wu Y H, Peng D L. 2018. Trophic state assessment of global inland waters using a MODIS-derived Forel-Ule index. Remote Sensing of Environment, 217: 444-460.
DOI:10.1016/j.rse.2018.08.026 |
Wu G F, Cui L J, He J J, Duan H T, Fei T, Liu Y L. 2013. Comparison of MODIS-based models for retrieving suspended particulate matter concentrations in Poyang Lake, China. International Journal of Applied Earth Observation and Geoinformation, 24: 63-72.
DOI:10.1016/j.jag.2013.03.001 |
Xue Y H, Xiong X J, Liu Y Q. 2015. Distribution features and seasonal variability of the transparency in offshore waters of China. Advances in Marine Science, 33(1): 38-44.
(in Chinese) |
Ye X M, Zheng Q A, Ji Y Q, Hua F, Lin Z S, Feng Y K. 2009. Water depth extraction from TM image in Jiaozhou Bay. Hydrographic Surveying and Charting, 29(2): 12-15, 19.
(in Chinese) DOI:10.3969/j.issn.1671-3044.2009.02.004 |
Yu D F, Xing Q G, Zhou B, Sun Y F, Zhou Y, Gai Y Y, Shi P. 2014. Retrieval of Secchi disk depth in Sishili Bay using the HJ-1B CCD image. Marine Environmental Science, 33(4): 580-584.
(in Chinese) |
Zhang F F, Li J S, Zhang B, Shen Q, Ye H P, Wang S L, Lu Z Y. 2018. A simple automated dynamic threshold extraction method for the classification of large water bodies from Landsat-8 OLI water index images. International Journal of Remote Sensing, 39(11): 3 429-3 451.
DOI:10.1080/01431161.2018.1444292 |
Zhang W J, Chi W Q, Hu Z J, Liu J Q, Zhang Y Q. 2015. Numerical study on the effect of the Jiaozhou Bay bridge construction on the hydrodynamic conditions in the surrounding sea area. Coastal Engineering, 34(2): 40-50.
(in Chinese) |
Zhao K, Qiao L L, Shi J H, He S F, Li G X, Yin P. 2015. Evolution of sedimentary dynamic environment in the western Jiaozhou Bay, Qingdao, China in the Last 30 Years. Estuarine, Coastal and Shelf Science, 163: 244-253.
DOI:10.1016/j.ecss.2014.12.011 |